Revenue KPIs: What to Track, What to Ignore, and What Good Looks Like
Your board deck says 26% growth. Your CFO is flagging cash. Your VP of Sales is celebrating a record bookings quarter while finance shows recognized revenue flat. Everyone's looking at revenue KPIs - and nobody's looking at the same number.
Most guides on this topic are financial glossaries listing 30 metrics from AP turnover to budget cycle time, with no benchmarks, no frameworks, and zero opinion on what actually matters. This isn't that guide.
What You Need (Quick Version)
You don't need 30 KPIs. You need five your revenue team agrees on - the key metrics that drive revenue across your entire go-to-market motion.
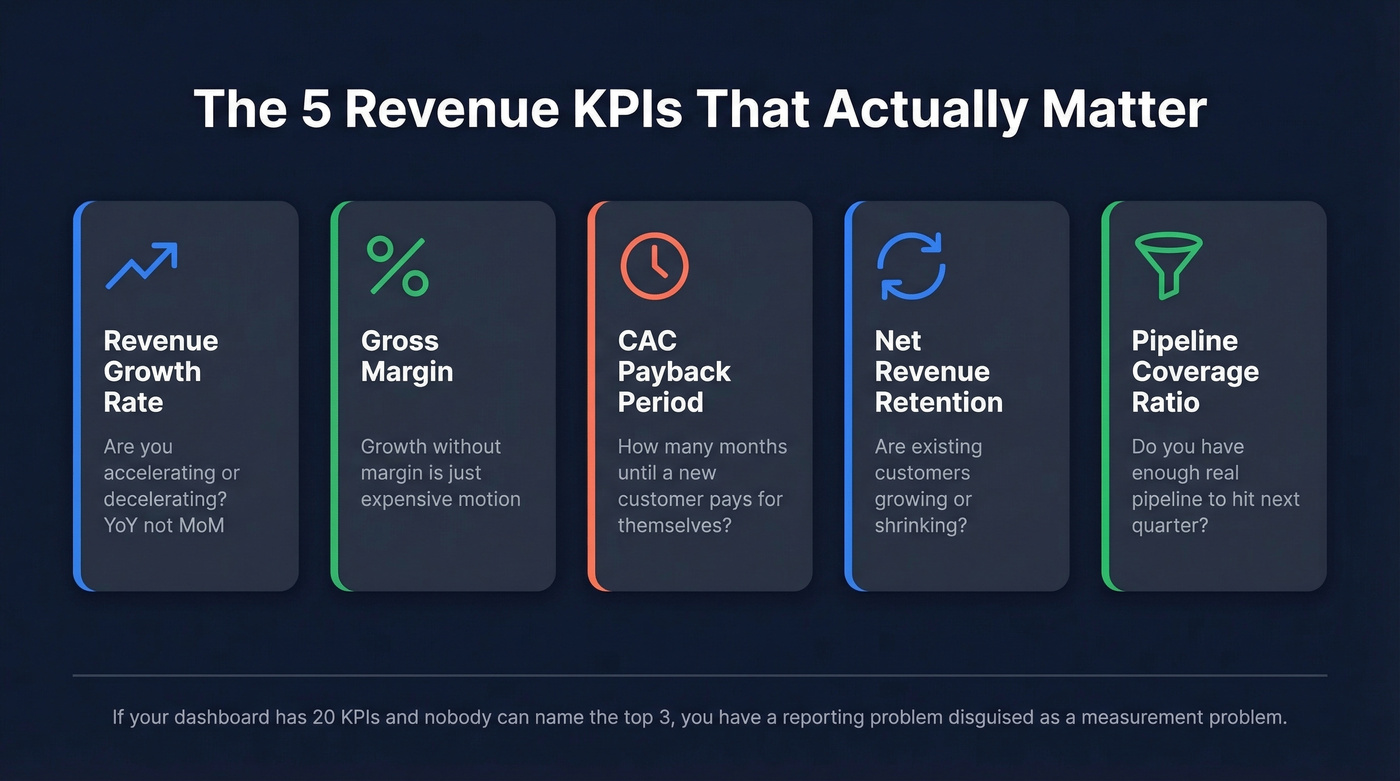
- Revenue growth rate - are you accelerating or decelerating? YoY, not MoM.
- Gross margin - growth without margin is just expensive motion.
- CAC payback period - how many months until a new customer pays for themselves?
- NRR - are existing customers growing or shrinking?
- Pipeline coverage ratio - do you have enough real pipeline to hit next quarter's number?
If your dashboard has 20 KPIs and nobody can name the top three this quarter, you have a reporting problem disguised as a measurement problem.
Vanity Metrics vs Real KPIs
Teams default to vanity metrics because they're auto-generated by tools and feel good to report. Nobody gets fired for showing traffic is up 40%. But traffic doesn't pay salaries.
| Vanity Metric | Revenue KPI |
|---|---|
| Website traffic | Pipeline value |
| Social followers | CAC |
| Email opens | LTV:CAC ratio |
| App installs | NRR |
| Unqualified form fills | Win rate |
The test is simple: can this metric explain why revenue went up or down last quarter? If not, it's vanity. Move it off the primary dashboard.
Leading vs Lagging Indicators
Revenue is a lagging indicator. By the time you see it decline, the damage happened weeks ago - the pipeline dried up in Q2, and you just didn't notice until Q3's close rate cratered.
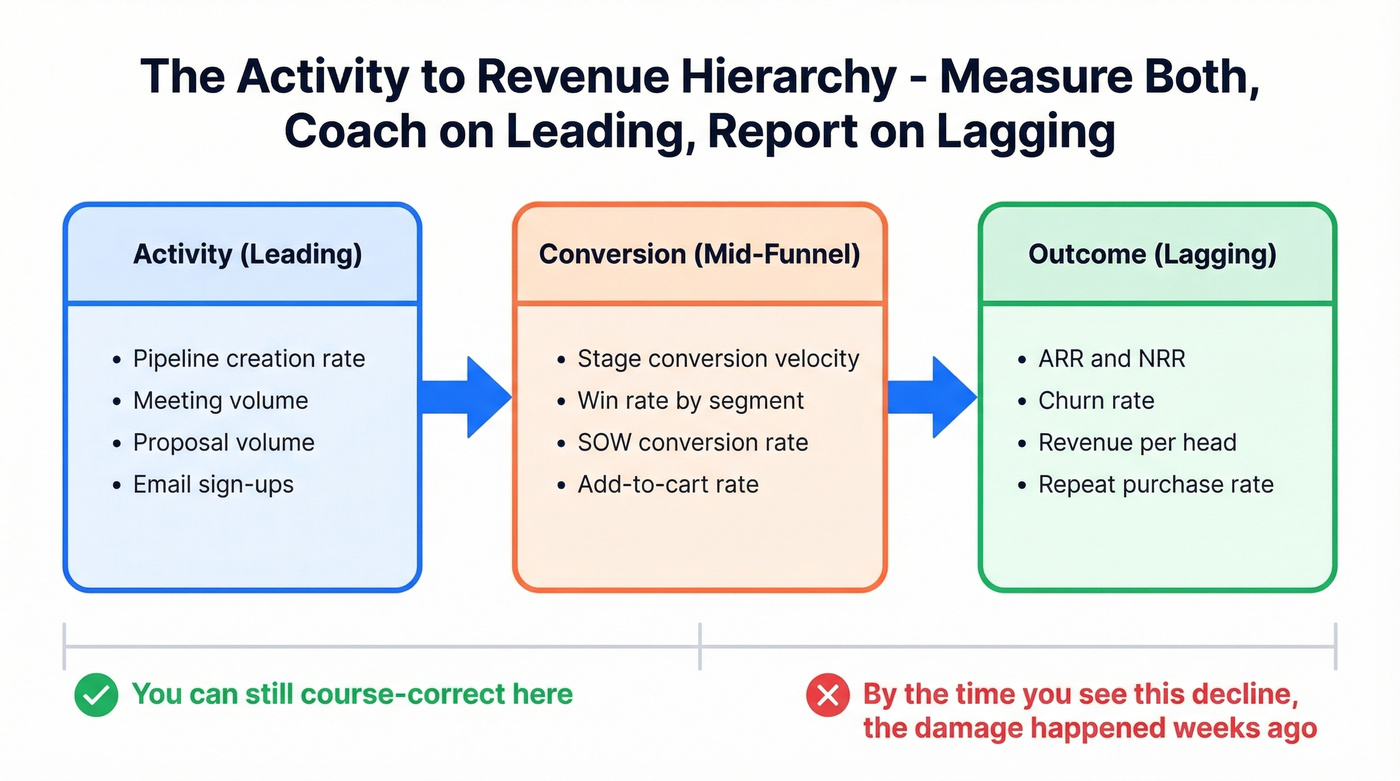
The hierarchy runs activity to conversion to outcome. Leading indicators let you course-correct before the lagging ones punish you.
| Business Model | Leading Indicators | Lagging Indicators |
|---|---|---|
| SaaS | Pipeline creation rate, stage conversion velocity, meeting volume | ARR, NRR, churn rate |
| Ecommerce | Add-to-carts, email sign-ups, time between purchases | Orders, repeat purchase rate, AOV |
| Services | Utilization rate, proposal volume, SOW conversion | Revenue per head, project margin |
The mistake most teams make is tracking only lagging indicators and then wondering why they can't predict revenue. Measure both. Coach on leading. Report on lagging.
The KPIs That Actually Matter
This isn't a flat list of 30 metrics. It's revenue KPIs organized by what they tell you, with formulas, benchmarks, and context.
Revenue Growth KPIs
ARR (Annual Recurring Revenue) is the north star for subscription businesses. The formula: ARR = new subscriptions + add-ons + upgrades - cancellations - downgrades. Over half of RevOps professionals emphasize ARR's importance for engaging leadership - and they're right.
As Dave Kellogg puts it: "Most enterprise SaaS companies should use ARR, not MRR, because most enterprise companies are doing annual contracts." MRR makes sense for PLG companies with monthly billing. Everyone else should default to ARR. Companies with usage-based or variable pricing should also track CARR (Contracted ARR) to capture committed revenue that hasn't yet been recognized.
Revenue growth rate - median YoY growth sits at roughly 26%. Phoenix Strategy's 2026 roundup pegs the prior-year median at 47%, and Benchmarkit shows top-quartile growth compressing from 60% to 50%. Growth is slowing across the board. Compare it quarter over quarter, not by cherry-picking your best month.
Expansion revenue now accounts for 40% of total new ARR at the median, and over 50% for companies above $50M ARR. If your expansion mix is weak, your growth ceiling is lower than you think.
Revenue concentration is the growth KPI nobody tracks until it's too late. If one customer represents 15%+ of your ARR, you don't have a growth engine - you have a dependency. We've seen this blindside teams at renewal time more than almost any other metric. The consensus on r/SaaS echoes the same warning: diversify before your biggest account gives you 90 days' notice.
One useful mental model: 11.6% MoM growth is what it takes to triple ARR in a year. Most companies aren't close.
Efficiency KPIs
CAC ratio - the median is $2.00 in S&M spend per $1.00 of new ARR. Fourth-quartile companies spend $2.82. If you're above $2.50, something in your funnel is broken: bad targeting, low conversion, or bloated teams.
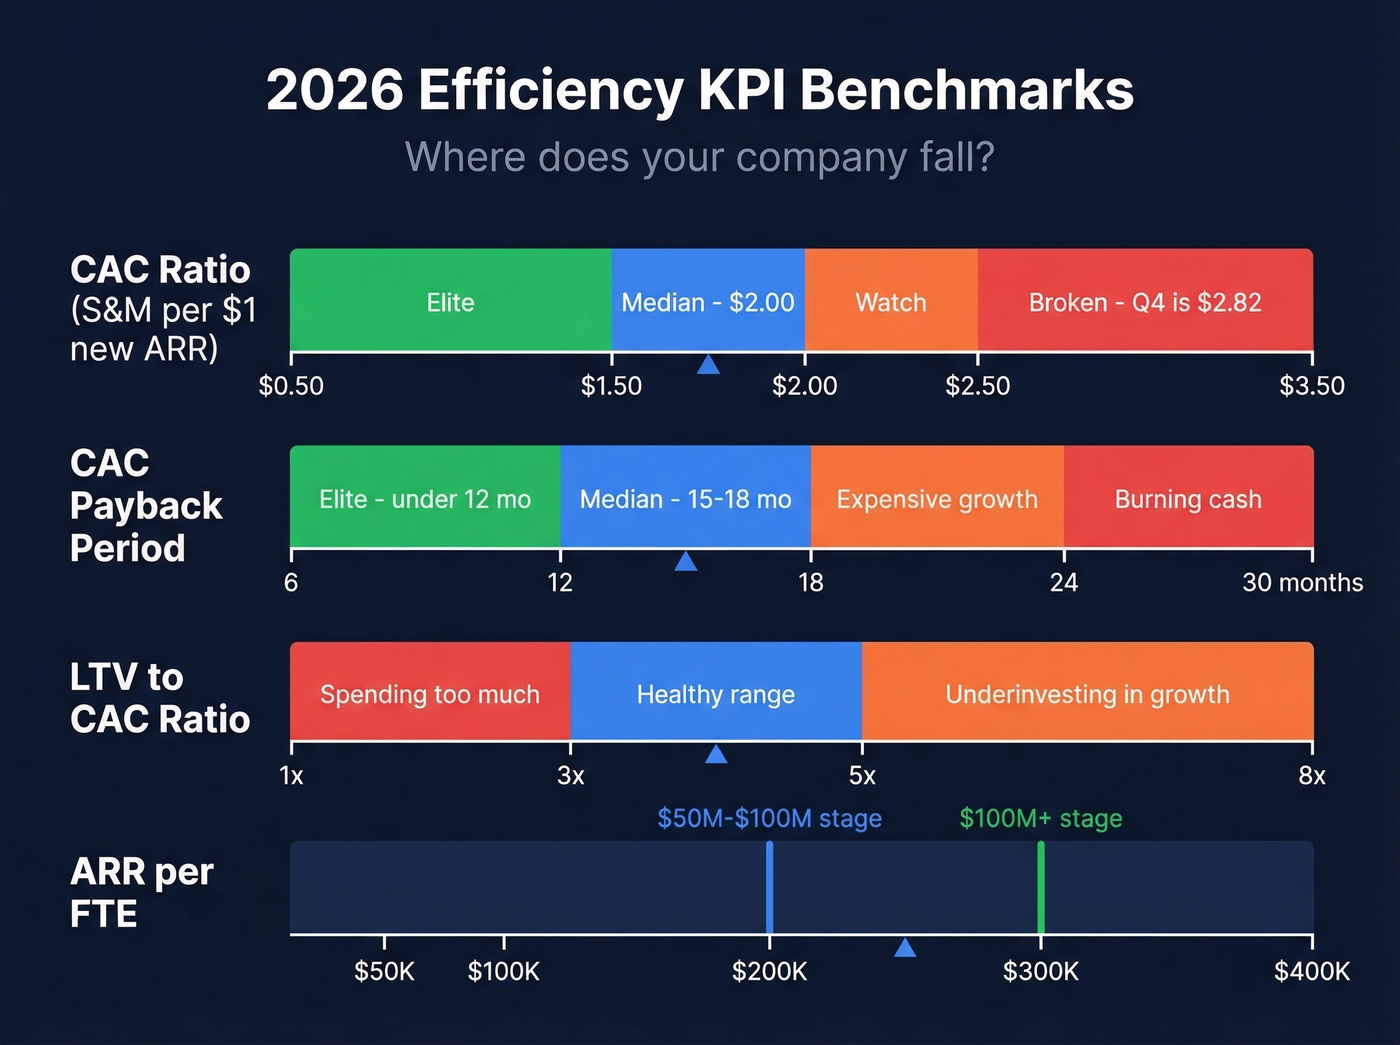
CAC payback period runs 15-18 months at the median. Elite companies get below 12. This is the metric that tells you whether growth is sustainable or just expensive - a company growing 50% with 24-month payback is burning cash faster than one growing 30% with 10-month payback.
LTV:CAC ratio - healthy range is 3:1 to 5:1. Below 3:1, you're spending too much to acquire customers who don't stick around long enough. Above 5:1, you're probably underinvesting in growth.
ARR per FTE - $200K at the $50M-$100M ARR stage, $300K above $100M ARR. This is the efficiency metric boards increasingly care about, and headcount-fueled growth without improving this ratio is a red flag.
Retention KPIs
NRR is the single most important metric for any subscription business. Full stop.
Median NRR across SaaS is 101%. That's barely above breakeven on existing customers. Top performers hit 120%+, and companies sustaining that level command 2.3x higher valuations.
GRR (Gross Revenue Retention) strips out expansion to show pure retention health. It's declined from 90% to 88% over the past three years - a quiet erosion that most teams aren't talking about enough. If your GRR is sliding and you're masking it with expansion, you're building on sand.
Revenue churn rate vs logo churn tell different stories. You can lose 5% of logos but 15% of revenue if your biggest customers leave. Or lose 10% of logos but only 3% of revenue if small accounts churn. Always track both, but revenue churn is the one that hits your P&L.
The right way to measure retention, per SaaS Capital's methodology: use per-customer data, compare month-over-year-ago-month, and smooth with 3-, 6-, and 12-month trailing averages. Annual snapshots hide too much.
Profitability KPIs
Gross margin tells you whether your revenue model works. Net margin tells you whether your business model works. Contribution margin by product line tells you which parts of the business are subsidizing which.
The Rule of 40 - growth rate + profit margin >= 40 - matters most above $10M ARR. Below that, pure growth usually wins. S&M as a percentage of revenue runs 47% for VC-backed companies vs 33% for PE-backed. That gap tells you everything about how different capital structures prioritize growth vs efficiency.
Pipeline and Leading Indicator KPIs
Pipeline coverage ratio is the forward-looking metric that predicts revenue before it shows up. A common operating target is around 3x quota, but that number is meaningless if your pipeline contacts are unreachable.
Here's the thing: teams report huge coverage, but a contact audit shows a meaningful chunk of the pipeline is tied to bad emails and dead phone numbers. The "coverage" looks great on a slide and collapses in execution. We've run these audits for our own pipeline, and the gap between reported coverage and reachable coverage was sobering the first time we saw it.
Pipeline coverage is only as good as the data underneath it. This is where contact verification matters - Prospeo's 98% email accuracy on a 7-day refresh cycle means your pipeline metrics reflect actual reachable buyers rather than inflated CRM records.

Win rate - track it by segment, not just overall. Your enterprise win rate and your SMB win rate are different businesses with different economics.
Sales velocity - (# of opportunities x average deal size x win rate) / sales cycle length. This single formula captures four variables that interact, and improving any one of them compounds.
Stage conversion rates - where do deals stall? If 60% of your pipeline dies between demo and proposal, that's a qualification problem, not a closing problem.
Pipeline coverage is only a real KPI when your contacts are reachable. Teams using Prospeo cut bounce rates from 35% to under 4% - turning inflated pipeline into actual revenue. 300M+ profiles, 98% email accuracy, refreshed every 7 days.
Stop reporting pipeline you can't actually convert.
Revenue Intelligence for Early Warnings
Benchmarks are snapshots. Revenue intelligence metrics give you a dynamic view of what's changing and why.
Pairing your core KPIs with signals like deal engagement scores, buyer intent data, and conversation analytics turns static dashboards into early-warning systems. The teams that combine pipeline data with these intelligence layers spot problems weeks before the lagging numbers confirm them. If you're only looking at your dashboard once a month, you're driving by looking in the rearview mirror.
2026 Benchmarks by Stage
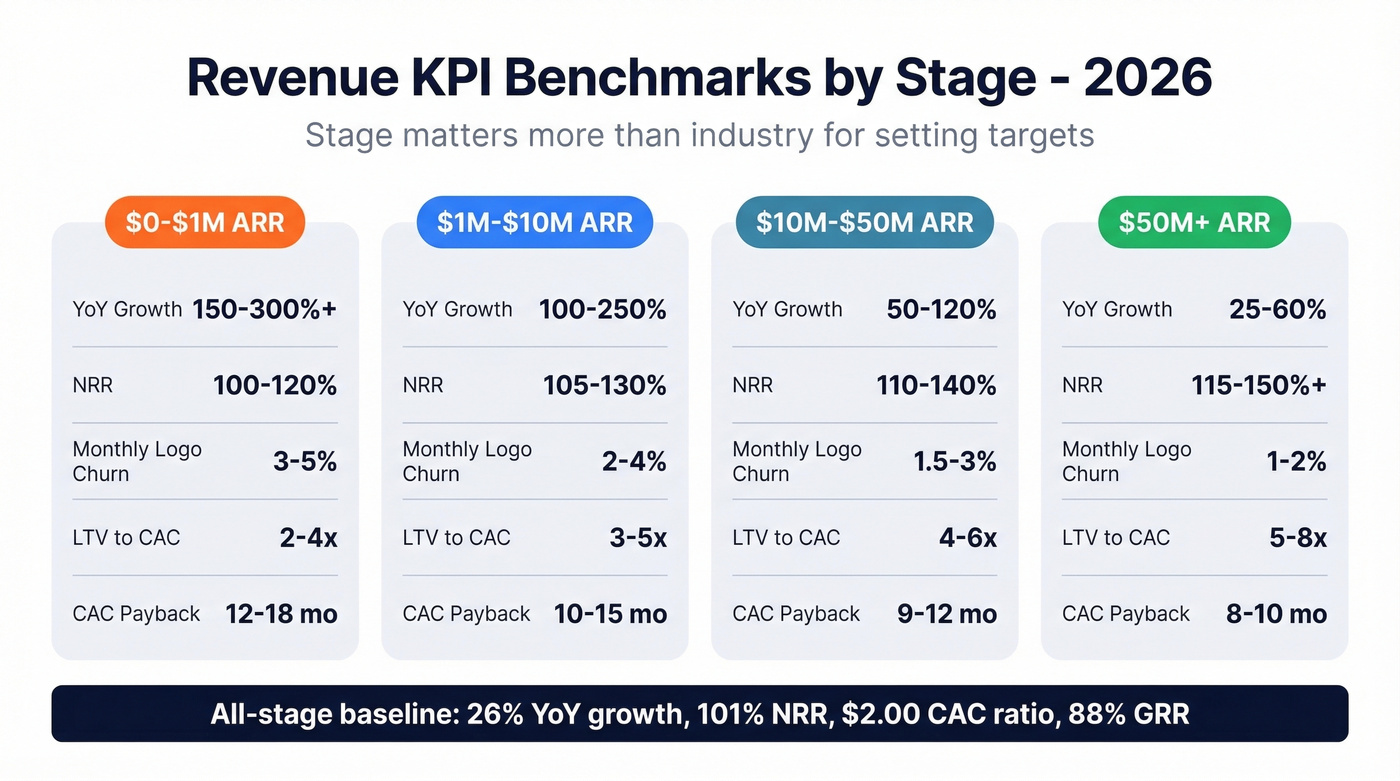
Stage matters more than industry for setting targets. A $2M ARR company and a $50M ARR company shouldn't benchmark against the same NRR.
| KPI | $0-$1M ARR | $1M-$10M | $10M-$50M | $50M+ |
|---|---|---|---|---|
| YoY Growth | 150-300%+ | 100-250% | 50-120% | 25-60% |
| NRR | 100-120% | 105-130% | 110-140% | 115-150%+ |
| Monthly Logo Churn | 3-5% | 2-4% | 1.5-3% | 1-2% |
| LTV:CAC | 2-4x | 3-5x | 4-6x | 5-8x |
| CAC Payback | 12-18 mo | 10-15 mo | 9-12 mo | 8-10 mo |
These ranges represent median to top quartile. If you're below the low end for your stage, that's a signal - not a crisis, but a signal worth investigating. If you're above the high end, make sure it's sustainable and not just one great quarter.
The all-stage baseline: 26% YoY growth, 101% NRR, $2.00 CAC ratio, 88% GRR. Use these as sanity checks, but always contextualize by stage.
This table is SaaS-focused. Ecommerce teams should benchmark against repeat purchase rate, AOV trends, and contribution margin per channel. Services firms should track revenue per head and project margin.
Common Mistakes That Cost You Money
Revenue definition fights. Sales calls it booked. Finance calls it recognized. Ops calls it fulfilled. All three show up on dashboards labeled "Revenue." A thread on r/CFO showed that alignment came from shared definitions and labeling, not better tools. Fix this with a glossary before you buy another dashboard.
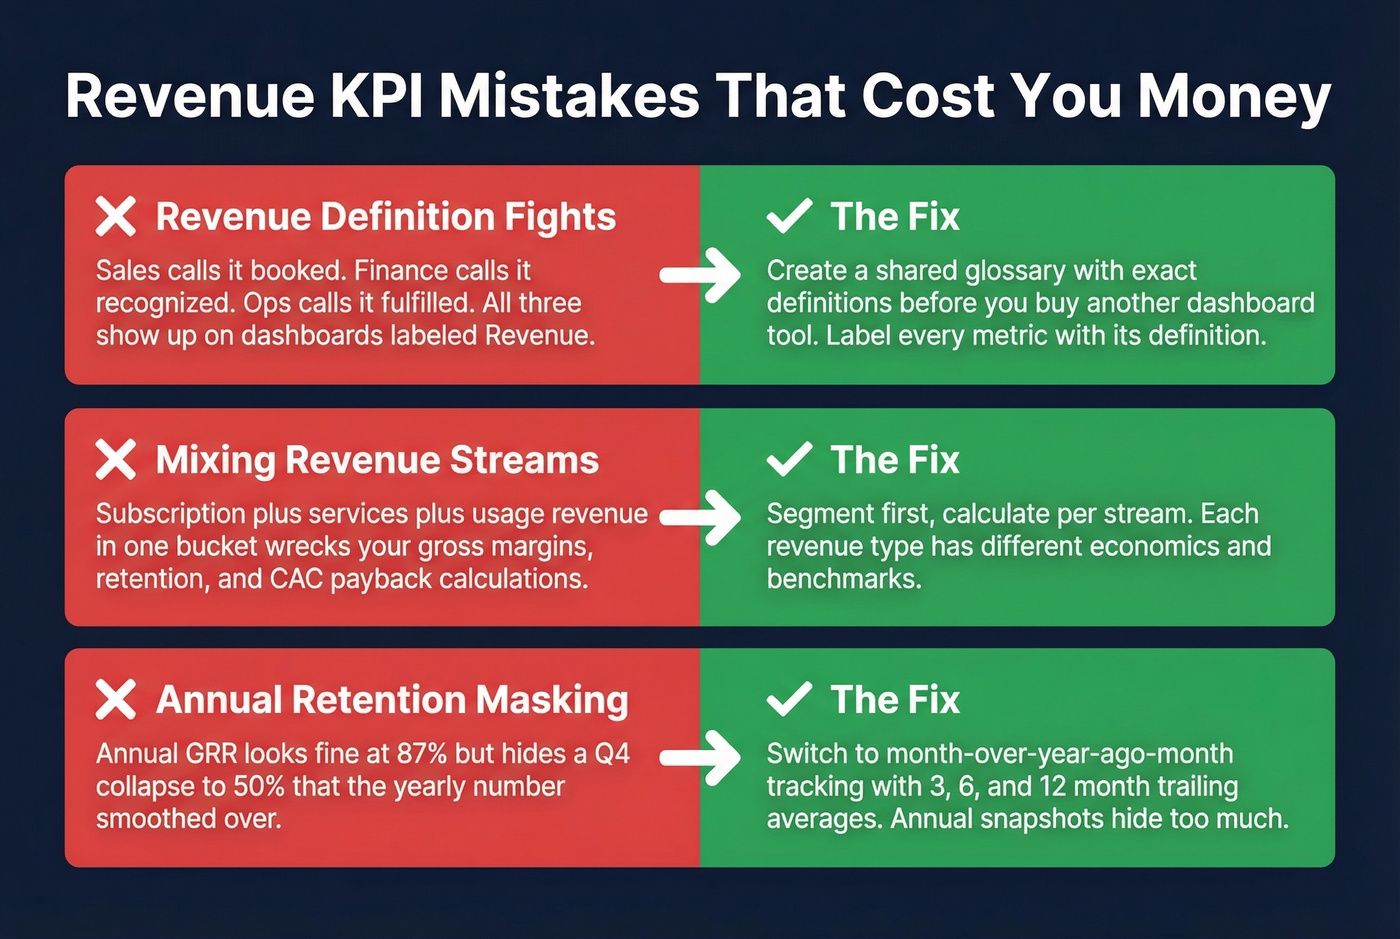
Mixing revenue streams. Subscription + services + usage revenue in one bucket wrecks your gross margins, retention calculations, and CAC payback. Segment first, calculate per stream.
Annual retention masking. One Series B company we worked with showed 87% annual GRR on their board deck. When they switched to month-over-year-ago-month tracking, they discovered a Q4 collapse to 50% that the annual number had smoothed over. They moved to trailing averages and caught the next dip two months earlier - in time to save three enterprise accounts. Annual snapshots are for board decks, not for operating decisions.
The ROAS trap. ROAS looks healthy while profit is negative - because ad spend eats into margins that the revenue number doesn't capture. Track profit per ad dollar, not just revenue per ad dollar. This is one of the most common ecommerce KPI mistakes flagged on Reddit, and it applies to B2B paid campaigns too.
Tracking too many metrics. If you're tracking 15+ KPIs, you're tracking none. Nobody can hold that many numbers in their head during a weekly review. Five to seven on the primary dashboard. Everything else goes in a drill-down view.
How to Build a KPI Dashboard
Dashboards should be management tools, not reporting tools. A reporting tool shows what happened. A management tool shows what to do next.
Let's be honest: most revenue teams don't have a KPI problem - they have a dashboard architecture problem. They're staring at 20 charts that all say something different, and the weekly meeting becomes a debate about which chart to believe. Five KPIs with one owner each will outperform a 25-metric dashboard every single time.
Every KPI needs one owner who controls the definition. Not a team - a person. When definitions drift (and they will), one person pulls them back.
Review cadence matters too. Weekly for leading indicators like pipeline creation, meeting volume, and stage conversion. Monthly for lagging indicators like ARR, NRR, and churn. Quarterly for benchmarks and strategic recalibration. Skip this cadence structure if your team is under five people - at that size, a single weekly review covering everything is fine.
CAC payback period explodes when reps waste cycles on bad data. Prospeo delivers verified emails at $0.01 each and 125M+ direct dials with a 30% pickup rate - so every dollar of S&M spend actually reaches a buyer.
Cut your CAC ratio by connecting reps to real decision-makers.
FAQ
What's the difference between revenue KPIs and financial KPIs?
Revenue KPIs measure metrics that directly drive or predict top-line performance - ARR, NRR, pipeline coverage, CAC payback. Financial KPIs include broader accounting metrics like AP turnover, current ratio, and budget variance. Revenue KPIs are the subset your go-to-market team should own and act on weekly.
How many KPIs should a revenue team track?
Five to seven on your primary dashboard. More than that and nobody can identify which metrics matter most this quarter. Teams with 25-metric dashboards consistently underperform those with five deeply-owned KPIs. Drill-down views handle the rest.
What's a good NRR benchmark in 2026?
Median NRR across SaaS is 101%, while top performers hit 120%+ and command 2.3x higher valuations. Below $10M ARR, aim for 105-115%. Above $50M ARR, 115-130% signals a healthy expansion engine.
How do I improve pipeline coverage without inflating numbers?
Start with verified prospect data - if half your contacts bounce, your 3x coverage is really 1.5x. Measure coverage against qualified, reachable contacts only, and audit your CRM data quality quarterly. Stale records are the fastest way to make a healthy pipeline look sick on execution day.