Sales Activity Metrics: What to Track, What Good Looks Like, and Why Most Teams Get It Wrong
69% of B2B reps missed quota last year. Not because they weren't busy - most teams log plenty of sales activity metrics. They missed because they tracked the wrong things, rewarded volume over quality, and never connected daily behaviors to pipeline math. Reps spend only 28% of their time actually selling. If you're going to measure that sliver, you'd better measure the right stuff.
Start Here: The Three Metrics That Matter Most
Forget tracking 30 metrics. Start with three: connect rate, meetings per 100 touches, and valid-contact yield (what percentage of your list is actually reachable). These three tell you whether reps are reaching real people, converting conversations into pipeline, and working clean data.
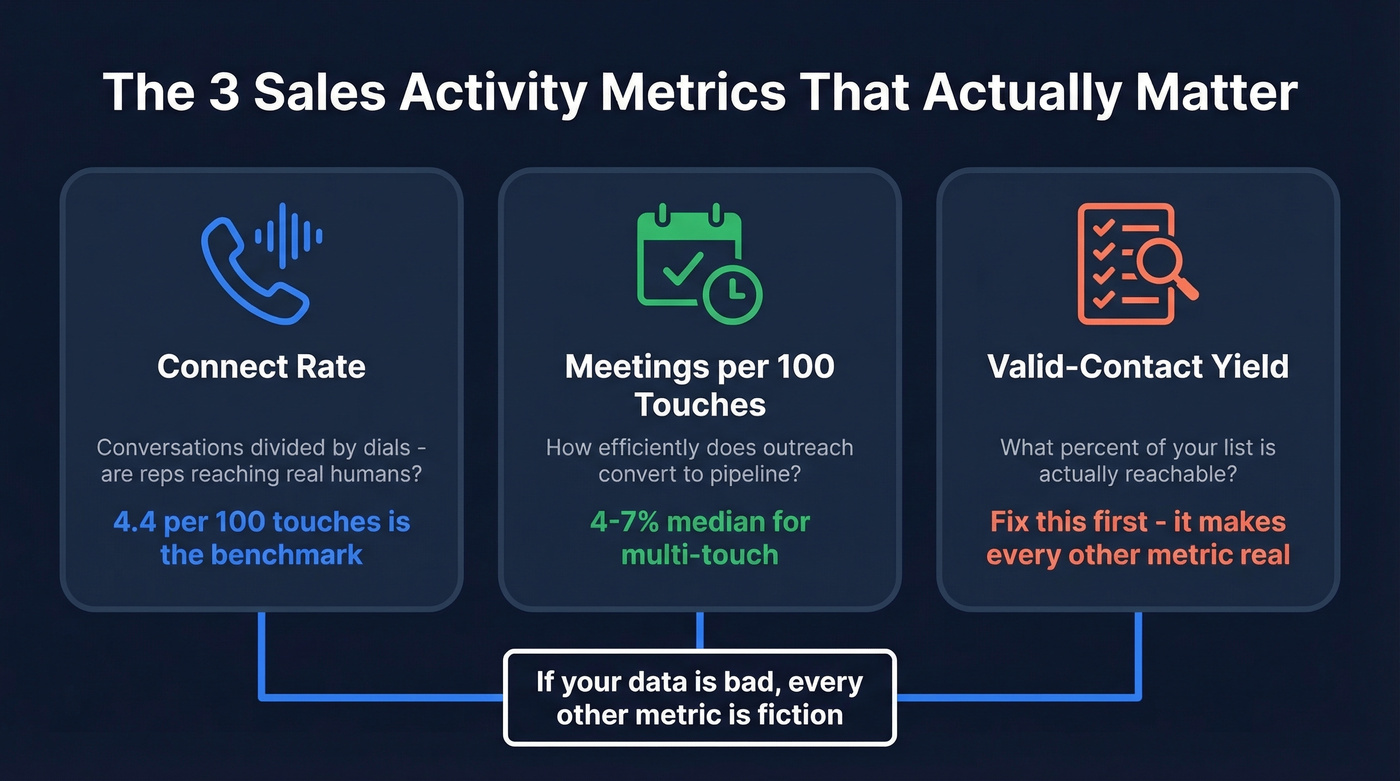
The biggest single fix for most teams isn't a new cadence or a better script - it's data quality. If a quarter of your emails bounce and half your phone numbers are disconnected, every other metric is fiction.
What Are Sales Activity Metrics?
Sales activity metrics measure the leading behaviors reps control - calls made, emails sent, meetings booked, accounts touched. They're distinct from pipeline metrics (deal velocity, stage conversion) and revenue metrics (win rate, quota attainment), which are lagging indicators. You can't will a deal closed. But you can control how many dials you make tomorrow morning.
There are really only three ways to grow sales: create more opportunities, close more of the ones you have, or both. Activity metrics sit squarely in the "create more opportunities" lane - the earliest signal that something's working or breaking. Activities are the inputs you control; outcomes are the results you influence.
Metrics That Actually Matter
Not all activity metrics deserve dashboard real estate. Track at least one from each category below and you'll have a complete picture. The right metrics shift by role: SDRs should obsess over connect rate and meetings booked, AEs over opportunity progression and pipeline health, managers over team-level conversion and cadence completion.
Volume & Channel Mix
Total outbound activities per day (calls + emails + social touches) tells you whether reps are putting in enough at-bats. But the mix matters as much as the total. A rep logging 100 emails and zero calls has a channel problem.
Track channel distribution alongside raw volume - a healthy split looks something like 40% calls, 35% emails, 25% social for most outbound motions. Monitoring activity levels across channels prevents reps from hiding behind a single comfortable medium.
Coverage & Targeting
Target-account coverage measures what percentage of your named accounts have received a meaningful touch. Top-performing teams average 16 touches per account across channels.
Multithread rate tracks how many accounts have two or more stakeholders engaged - accounts with 2+ contacts touched divided by total active accounts. A 51.7% multithread rate is strong. Below 30% means reps are single-threading and hoping their one contact champions the deal internally. Define "meaningful touch" carefully, too. An undelivered email or a voicemail to a disconnected number isn't a touch - it's noise.
Engagement & Conversion
Connect rate (conversations divided by dials) and reply rate (replies divided by emails sent) measure whether outreach is landing. Bridge Group benchmarks show 4.4 connects per 100 touches - if your team is below that, the problem is data, not effort.
Then track meetings per 100 touches to see how efficiently each activity converts to pipeline. This is the metric that separates busy reps from productive ones.
Cadence & Speed
Responding within 5 minutes makes leads 9x more likely to convert, and 35-50% of deals go to the first responder. Also track cadence completion rate - what percentage of reps finish their sequences versus abandoning early. Industry data shows 80% of deals require 5+ touches, yet 44% of reps give up after one.
New SDRs typically need 3-4 months to reach full productivity, so set ramp-adjusted activity targets rather than holding new hires to veteran benchmarks.
Data Quality & Hygiene
Your activity metrics are only as reliable as your contact data. If 17% of cold emails hit spam and phone numbers are outdated, volume counts are fiction. Track bounce rate, invalid-number rate, and valid-contact yield (verified contacts divided by total contacts in your lists).
We've seen this firsthand: Prospeo's real-time email verification on a 7-day refresh cycle keeps bounce rates under control. Meritt cut their bounce rate from 35% to under 4% after switching, which immediately made every other metric they tracked more trustworthy.

You just read it: 4.4 connects per 100 touches is the benchmark - and teams below that have a data problem, not an effort problem. Prospeo's 7-day data refresh and 98% email accuracy cut bounce rates from 35% to under 4% for teams like Meritt, tripling their pipeline overnight.
Stop inflating activity counts with dead contacts. Start measuring real conversations.
2026 SDR Benchmarks
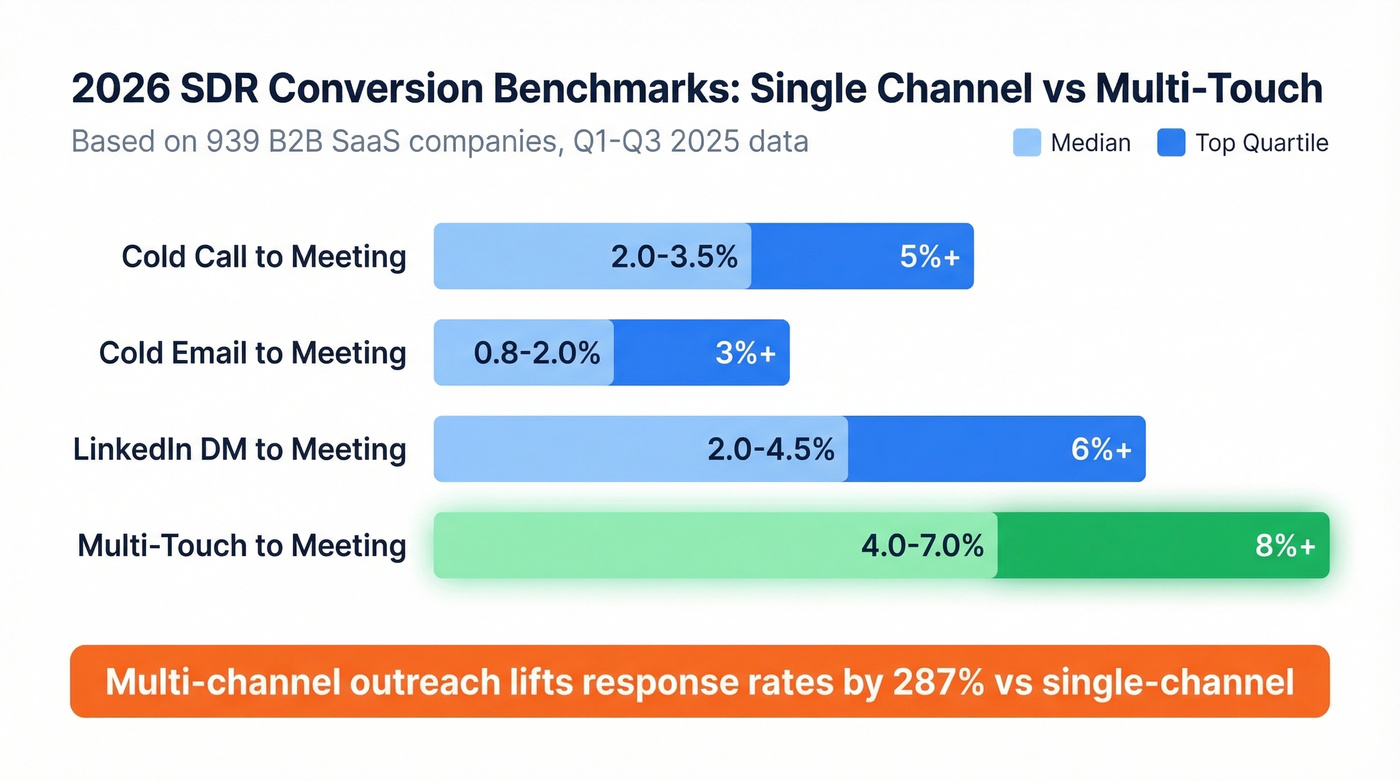
The numbers below reflect benchmarks from 939 B2B SaaS companies (CRM data from Q1-Q3 2025, updated Feb 16, 2026), supplemented by Bridge Group and Gradient Works aggregations.
| Metric | Median | Top Quartile | Source |
|---|---|---|---|
| Calls/day | 50-60 | 70-80 | Optifai |
| Emails/day | 30-40 | 45-55 | Optifai |
| Social touches/day | 15-20 | 25-35 | Optifai |
| Total activities/day | ~95-120 | 140-170 | Optifai |
| Meetings/month | 8-10 | 12-15 | Optifai |
| Connect rate | 8-12% | 8-12% | Optifai |
| Reply rate (cold email) | 1-5% | 5%+ | Martal |
| Cold call to meeting | 2.0-3.5% | 5%+ | Optifai |
| Cold email to meeting | 0.8-2.0% | 3%+ | Optifai |
| LinkedIn DM to meeting | 2.0-4.5% | 6%+ | Optifai |
| Multi-touch to meeting | 4.0-7.0% | 8%+ | Optifai |
The critical takeaway isn't the volume numbers - it's the conversion gap between single-channel and multi-touch. SDRs logging 80+ calls a day with poor targeting routinely underperform those making 50 calls backed by account research. Volume without precision is just expensive noise.
Here's the thing: if your connect rate is below 5%, buying a better dialer won't save you. The problem is upstream - your numbers are wrong. Fix the data before you touch the tech stack.
Activity Impact on Revenue
Let's work backward from a revenue target. Say your team needs $2M in new pipeline this quarter. With a 3:1 pipeline-to-quota ratio, you need $6M in pipeline. If your average deal is $40K, that's 150 opportunities needed.
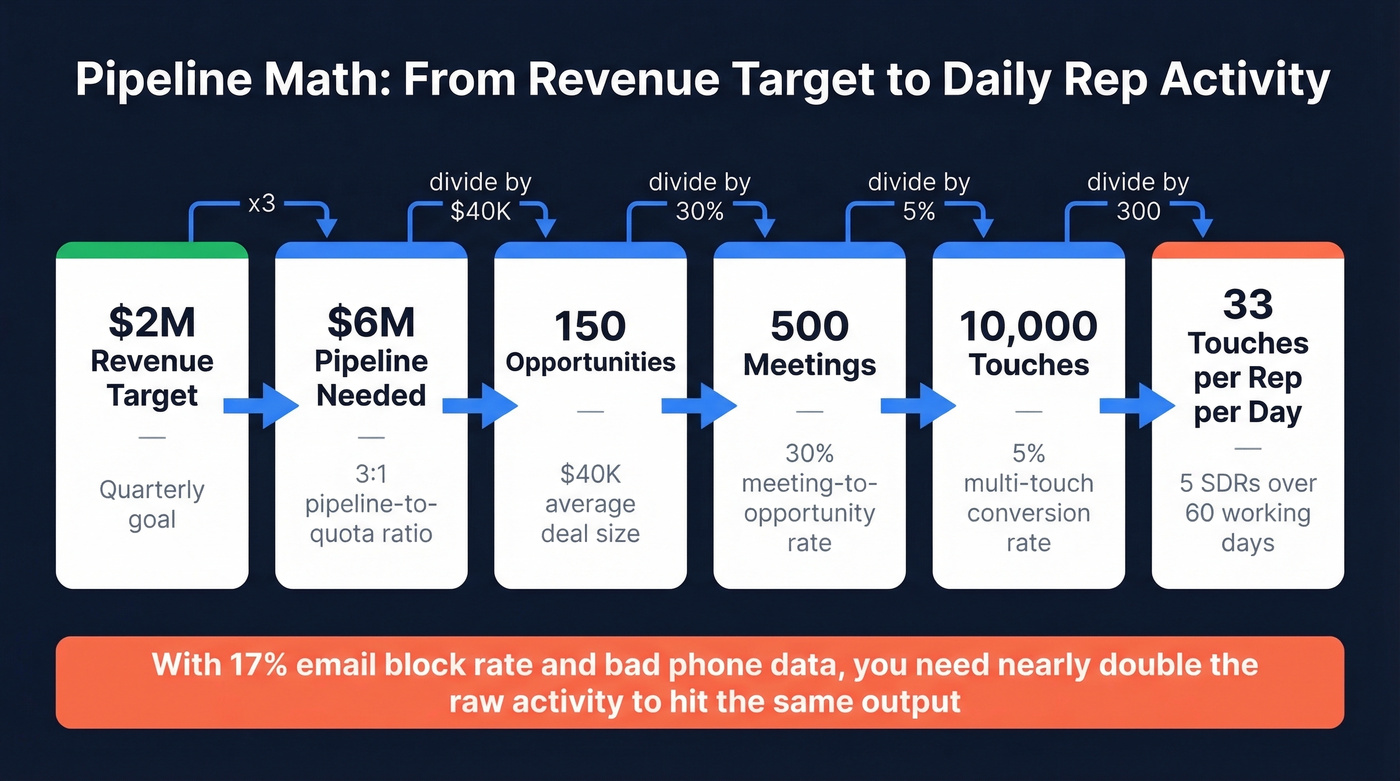
If 30% of meetings convert to opportunities, you need roughly 500 meetings. With a multi-touch conversion rate of 5%, you need about 10,000 meaningful touches to generate those meetings. Spread across a 5-person SDR team over 60 working days, that's 33 quality touches per rep per day - completely doable if the data is clean and the targeting is tight.
Using email, phone, and social together lifts response rates by 287% versus single-channel outreach. But the math breaks when inputs are garbage. A 17% email block rate and a 3% connect rate on bad numbers means you need nearly double the raw activity to hit the same output. Leading indicators earn their keep here - they flag the breakdown weeks before revenue reports do.
Why Most Activity Tracking Fails
Goodhart's Law kills sales teams. The moment a metric becomes a target, it ceases to be a good metric. Tell reps they need 80 calls a day and they'll log voicemails to dead numbers. Require 50 emails and they'll blast generic templates to unqualified lists just to hit the number. The average rep engages in 100+ outreach activities per day to generate just 3.6 quality conversations - that ratio should alarm every RevOps leader reading this.
The fix is pairing volume metrics with quality metrics. Track connect rate alongside dials. Track meetings per 100 touches alongside total touches. And track bounce rate - because if 17% of emails never arrive, your "50 emails sent" is really 41 emails delivered. That gap between logged activity and actual activity is where pipeline goes to die.
AI-generated outreach adds a new wrinkle. If a tool writes and sends 200 personalized emails on a rep's behalf, is that "rep activity"? Teams need to decide whether they're measuring human effort or system output and adjust their benchmarks accordingly. Skip this conversation at your peril - in our experience, teams that don't define this clearly end up with meaningless dashboards within a quarter.
Build Your Activity Dashboard
Don't build one dashboard. Build three views on a tiered review cadence.
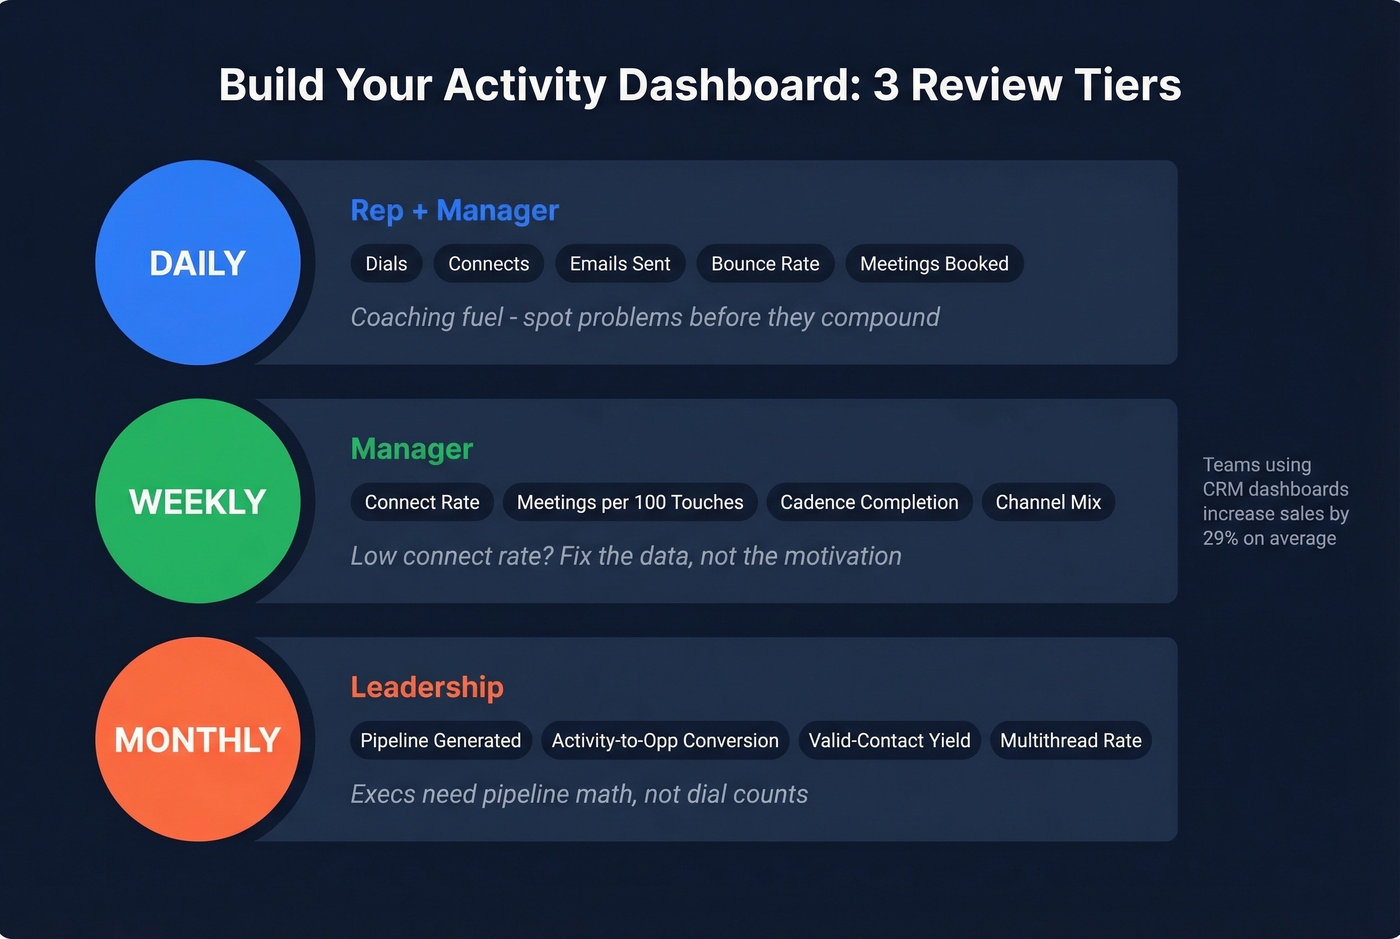
Daily (rep + manager) covers dials, connects, emails sent, bounce rate, and meetings booked. This is coaching fuel - spot problems before they compound. In Salesforce or HubSpot, set up a simple activity-by-rep report filtered to today's date.
Weekly (manager) focuses on connect rate, meetings per 100 touches, cadence completion rate, and channel mix. This is where you surface the insights that drive real coaching conversations. A rep with high volume but low connect rate needs a data cleanup, not a motivational talk. Prospeo's CRM enrichment can backfill missing contacts and flag stale records before they pollute your metrics.
Monthly (leadership) zooms out to pipeline generated, activity-to-opportunity conversion, valid-contact yield, and multithread rate. Execs need pipeline math, not dial counts. Teams using CRM dashboards increase sales by an average of 29%, and reps with mobile CRM access hit targets at 65% versus 22% without it.
If you want a tighter view of upstream performance, pair this with lead scoring and lead status so reps don’t waste touches on the wrong accounts.
That 10,000-touch pipeline math only works if your contacts are reachable. Prospeo gives you 300M+ verified profiles, 125M+ direct dials with a 30% pickup rate, and real-time verification - so every dial and every send counts toward a real metric, not a vanity one.
Make every activity metric trustworthy for $0.01 per verified email.
FAQ
What's the difference between sales activity metrics and KPIs?
Activity metrics measure leading behaviors reps control daily - calls, emails, meetings booked. KPIs measure lagging outcomes like revenue and quota attainment. When leading indicators drop, lagging results follow within weeks. Track both so you can intervene before pipeline dries up.
How many calls per day should an SDR make?
Median is 50-60 calls per day; top quartile hits 70-80. But fifty calls to verified mobile numbers outperform eighty calls to outdated data every time - connect rate drives meetings, not raw dials.
How do I stop reps from gaming activity metrics?
Pair volume metrics with quality metrics like connect rate, meetings per 100 touches, and bounce rate. When you track data hygiene alongside rep output, inflating numbers with bad contacts becomes obvious and pointless. Review conversion ratios weekly, not just totals.