Sales Development Metrics: What to Track, What to Comp, and What to Ignore
Your VP asks why pipeline is down 20% when your SDRs are making more calls than last quarter. You pull up the dashboard and see 94 activities per rep per day, email volume up 15%, and dials holding steady. Everything looks green - except the number that pays the bills.
Gartner calls this the operational-versus-strategic metric split. Most SDR teams are drowning in operational data while ignoring the sales development metrics that actually predict revenue. They're comping on activity, coaching on vibes, and wondering why pipeline doesn't move.
The Short Version
Comp on these 5:
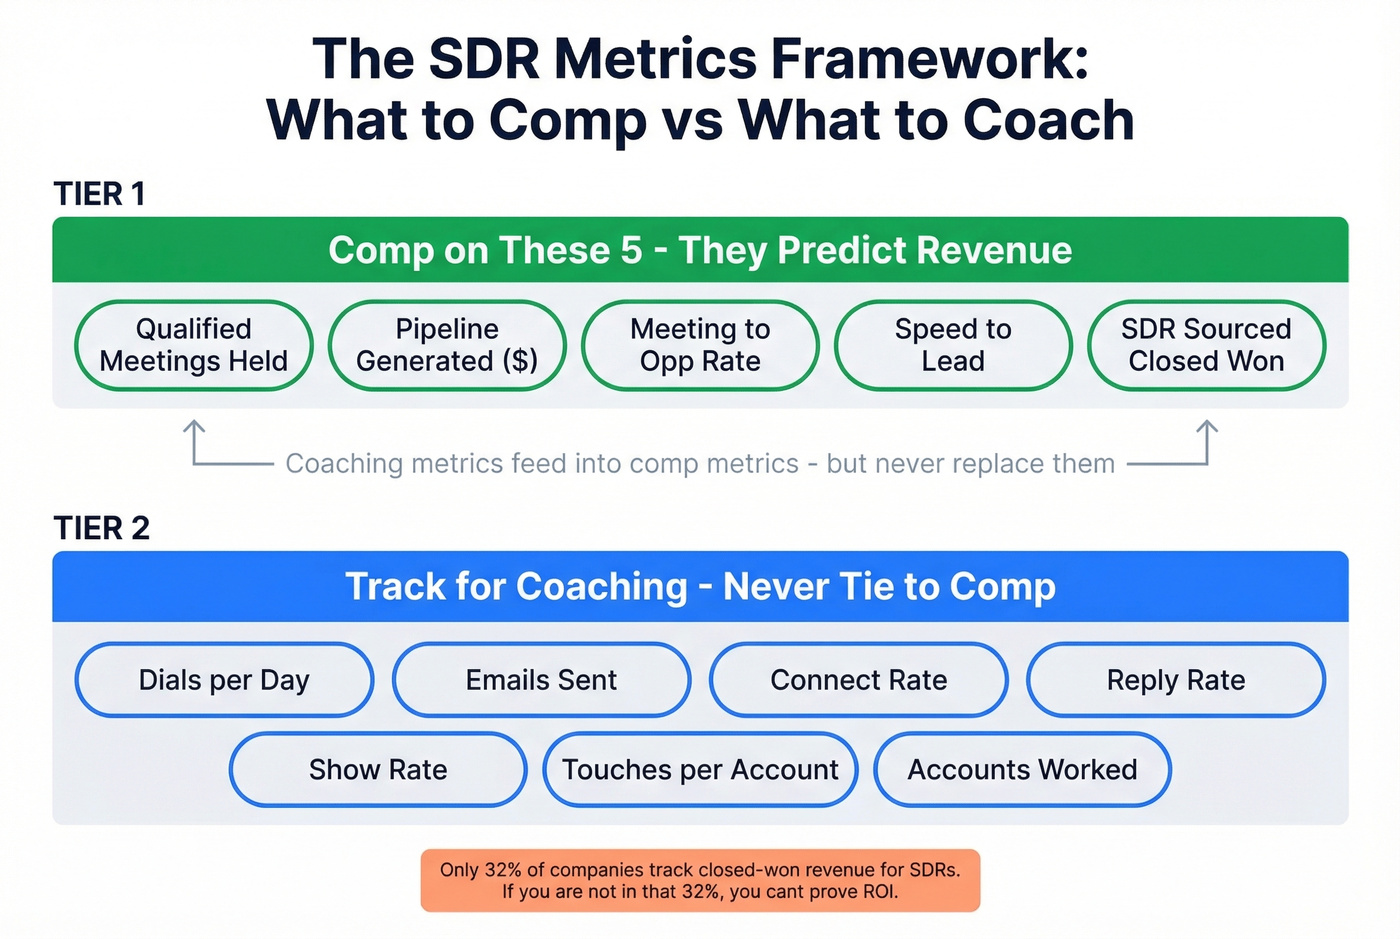
- Qualified meetings held
- Pipeline generated ($)
- Meeting-to-opportunity rate
- Speed-to-lead
- SDR-sourced closed-won revenue
Track for coaching, but don't comp:
- Dials per day
- Emails sent
- Connect rate
- Reply rate
- Show rate
- Touches per account
- Accounts worked per month
Everything else is noise. Only 32% of companies track closed-won revenue for SDRs. If you're not in that 32%, you can't prove your SDR team's ROI - and the next budget cut hits you first.
Set Targets by Working Backward from Revenue
Most teams set SDR quotas by looking at what last quarter's top performer did and calling that the benchmark. That's backwards.
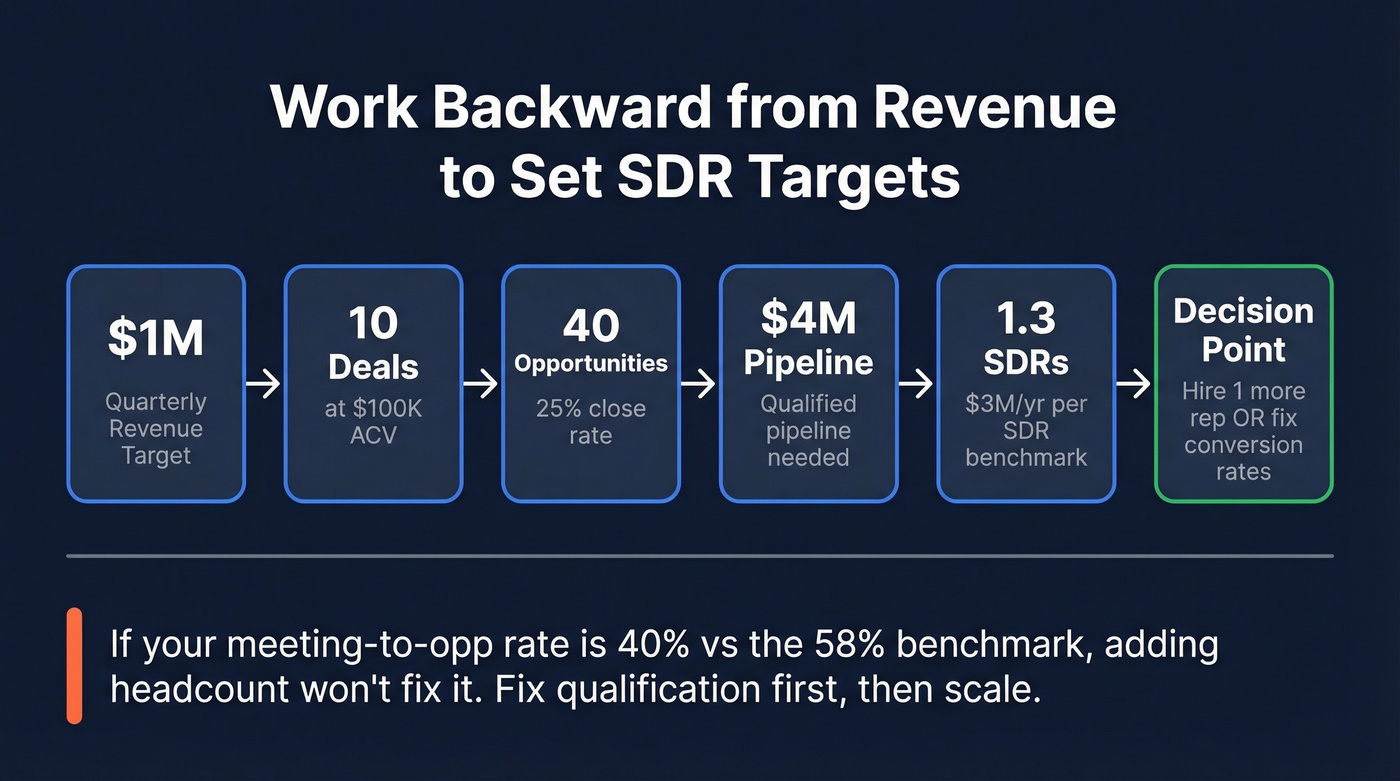
Start with the revenue number and work down. Say your team needs $1M in new revenue this quarter. At a $100K ACV, that's 10 closed deals. If your close rate is 25%, you need 40 opportunities - which means roughly $4M in qualified pipeline. The Bridge Group benchmark for SaaS SDR teams is around $3M/year in pipeline per SDR, so one rep covers about 75% of that $4M target. Now you know whether you need one more rep or better conversion rates - not more dials.
This math also tells you where to invest. If you're at a 40% meeting-to-opp rate versus the 58% benchmark, adding headcount won't fix it. Fix the qualification criteria first, then scale.
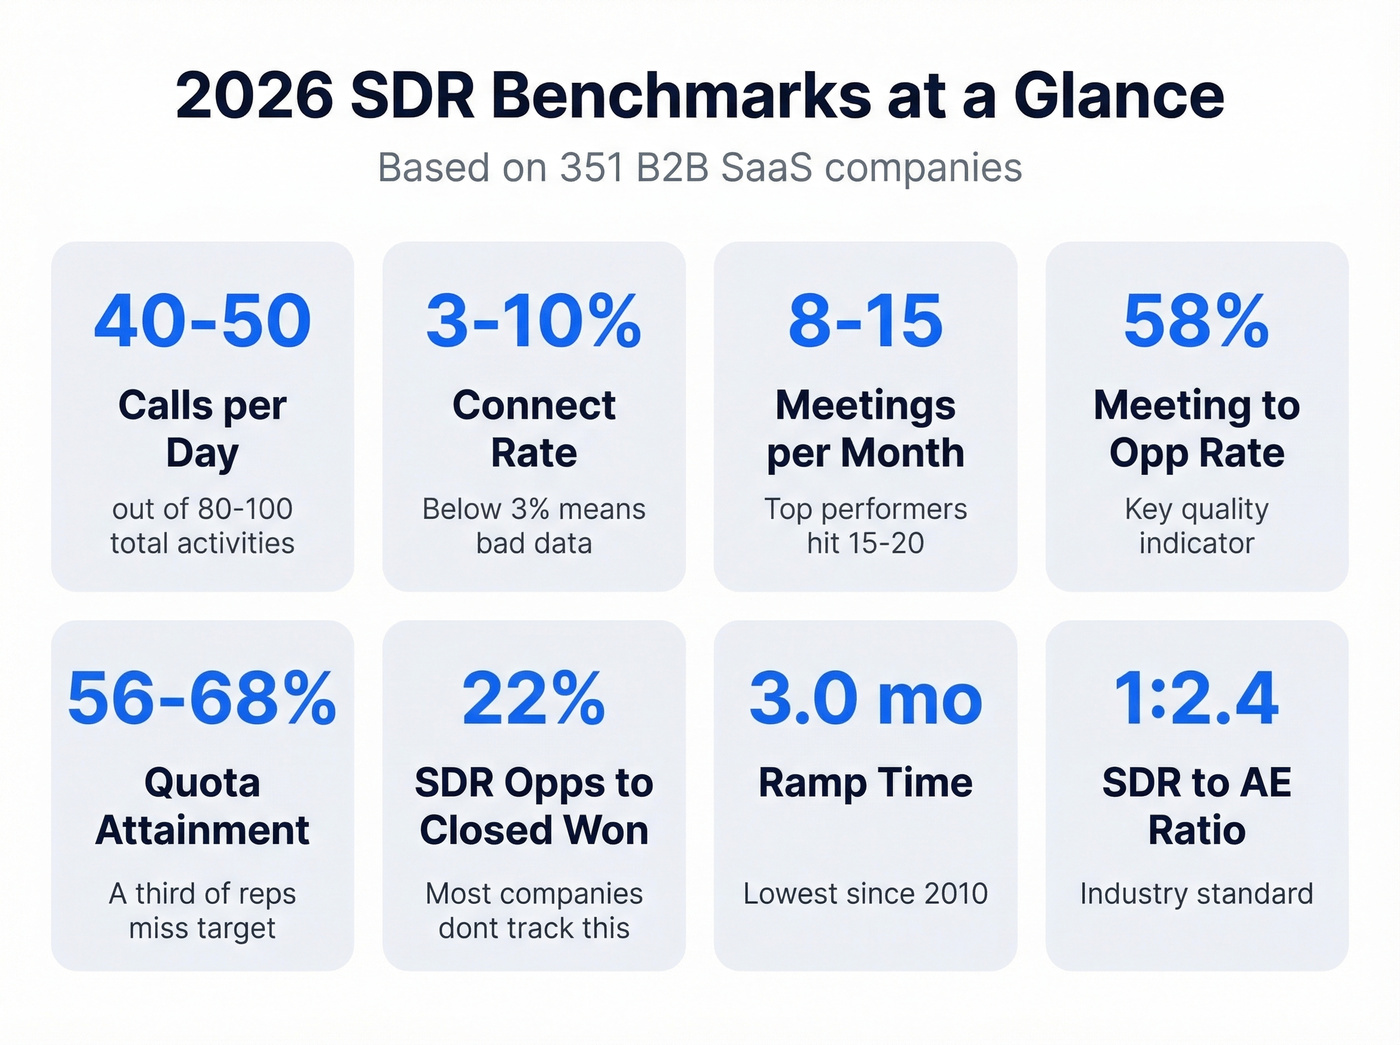
2026 SDR Benchmarks
These numbers come from the Bridge Group's latest study (351 companies, 83% B2B SaaS, $47M median revenue), TOPO, Operatix, Tenbound, and Outreach data. Your numbers will shift by ACV and motion, but these ranges give you a calibration point.
| Metric | Benchmark Range | Notes |
|---|---|---|
| Activities/day | 80-100 | ~36 calls, 33 emails, 15 VMs, 7 social |
| Calls/day | 40-50 | |
| Emails/day | 10-40 | |
| Connect rate | 3-10% | Below 3% = data problem |
| Cold email reply rate | 1-5% (top quartile: 15-25%) | |
| Effective sequence reply | 12% | |
| Show rate | ~80% | |
| Meetings/month | 8-15 | |
| Meeting-to-opp rate | 58% | |
| Pipeline/month per SDR | $50K-$150K | |
| Quota attainment | 56-68% | |
| SDR opps to closed-won | 22% | |
| SDR:AE ratio | 1:2.4 | |
| SDR ramp time | 3.0 months | Lowest since 2010 |
| SDR tenure | 1.9 years |
If your connect rate is below 3%, that's a data problem, not a rep problem. If your show rate is below 70%, look at your confirmation sequence and meeting-set process before blaming SDRs.
A connect rate below 3% isn't a rep problem - it's a data problem. Prospeo delivers 98% email accuracy, 125M+ verified mobile numbers with a 30% pickup rate, and refreshes every record every 7 days. Teams using Prospeo book 26% more meetings than ZoomInfo users and 35% more than Apollo.
Stop coaching reps on symptoms. Fix the input.
KPIs That Actually Move Pipeline
Activity Metrics
TOPO recommends 16 touches per account; HubSpot says at least 8. The real number depends on your ACV and buyer persona, but single-touch outreach is dead. Multichannel sequences - phone plus email plus social - boost results by 287% versus single-channel approaches.
Stop comping on activity volume. 94 activities a day means nothing if your reps are blasting the wrong personas. Track activity to spot reps who are underworking, but never tie comp to dials or emails sent. You'll get exactly what you incentivize: volume without targeting.
Conversion Metrics
Connect rate is the canary in the coal mine. It takes 18+ dials to reach one prospect, and callback rates run below 1%.
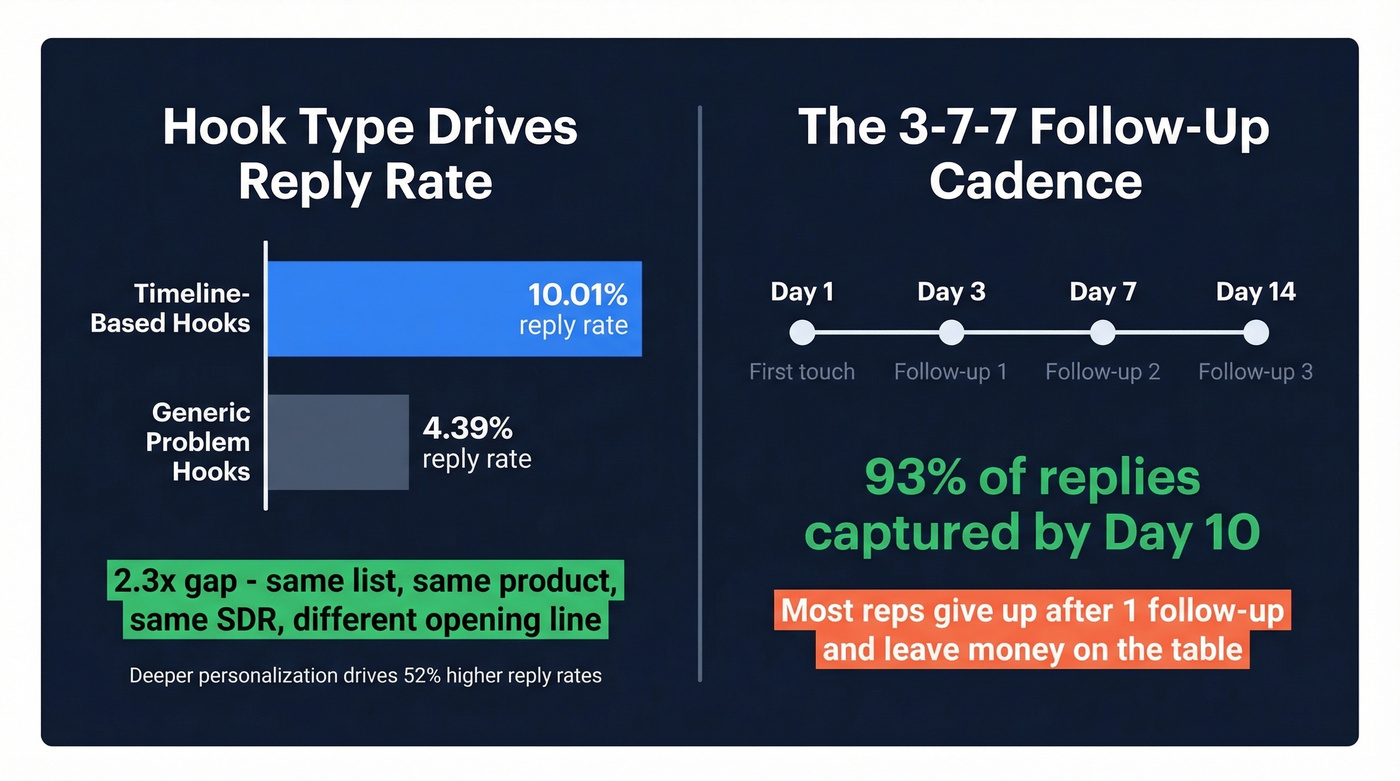
On email, hook type matters more than volume. Timeline-based hooks - referencing a trigger event like a funding round or job change - average a 10.01% reply rate versus 4.39% for generic problem hooks. That's a 2.3x gap from the same list, same product, same SDR, just a different opening line. Deeper personalization drives 52% higher reply rates across the board.
Follow-up cadence matters just as much as the first touch. A 3-7-7 cadence (follow up on days 3, 7, and 14) captures 93% of replies by day 10. Most reps give up after one follow-up and leave money on the table.
Speed-to-lead is the metric most teams know about and still ignore. Only 7% of companies respond to inbound leads within 5 minutes. 55% don't respond within 5 business days. The average response time is 42 hours. If you're not measuring this, you're leaking pipeline from your highest-intent channel.
The inbound-versus-outbound conversion gap is massive. High-intent inbound leads convert at 75-80%, while low-intent inbound converts at just 5-10%. The SaaS benchmark for lead-to-opportunity sits around 12%. If you're lumping all inbound together, you're hiding a targeting problem inside an average.
Pipeline and Revenue Metrics
SDRs generate 46-73% of total pipeline depending on the org. That's not a support function - that's the engine.
Yet only 22% of SDR-sourced opportunities convert to closed-won, and most companies don't even track that number. If you're not tracking SDR-sourced closed-won revenue, you can't justify headcount to finance. Quota attainment across the industry runs 56-68%, which means a third of your team is missing target. The question is whether that's a people problem, a targeting problem, or a data problem. In our experience, it's usually the data.
Here's the thing: most SDR teams don't have a performance problem. They have a measurement problem. They comp on meetings set, which creates a perverse incentive to book unqualified meetings that waste AE time. The perennial complaint in every r/sales thread and SDR Slack community is the same - reps gaming meeting quotas while AEs complain about lead quality. Switch your comp to pipeline generated and meeting-to-opportunity rate, and watch meeting quality improve within one quarter.
Diagnosing Problems with Your Metrics
Every upstream metric - connect rate, reply rate, show rate - collapses when contact data decays. People change jobs, get promoted, switch companies. The phone number that worked in January rings a disconnected line by July. Without reliable data feeding your analytics, you're coaching reps on symptoms instead of root causes.
If your connect rate is below 3%, that's a B2B company data problem, not a rep problem.
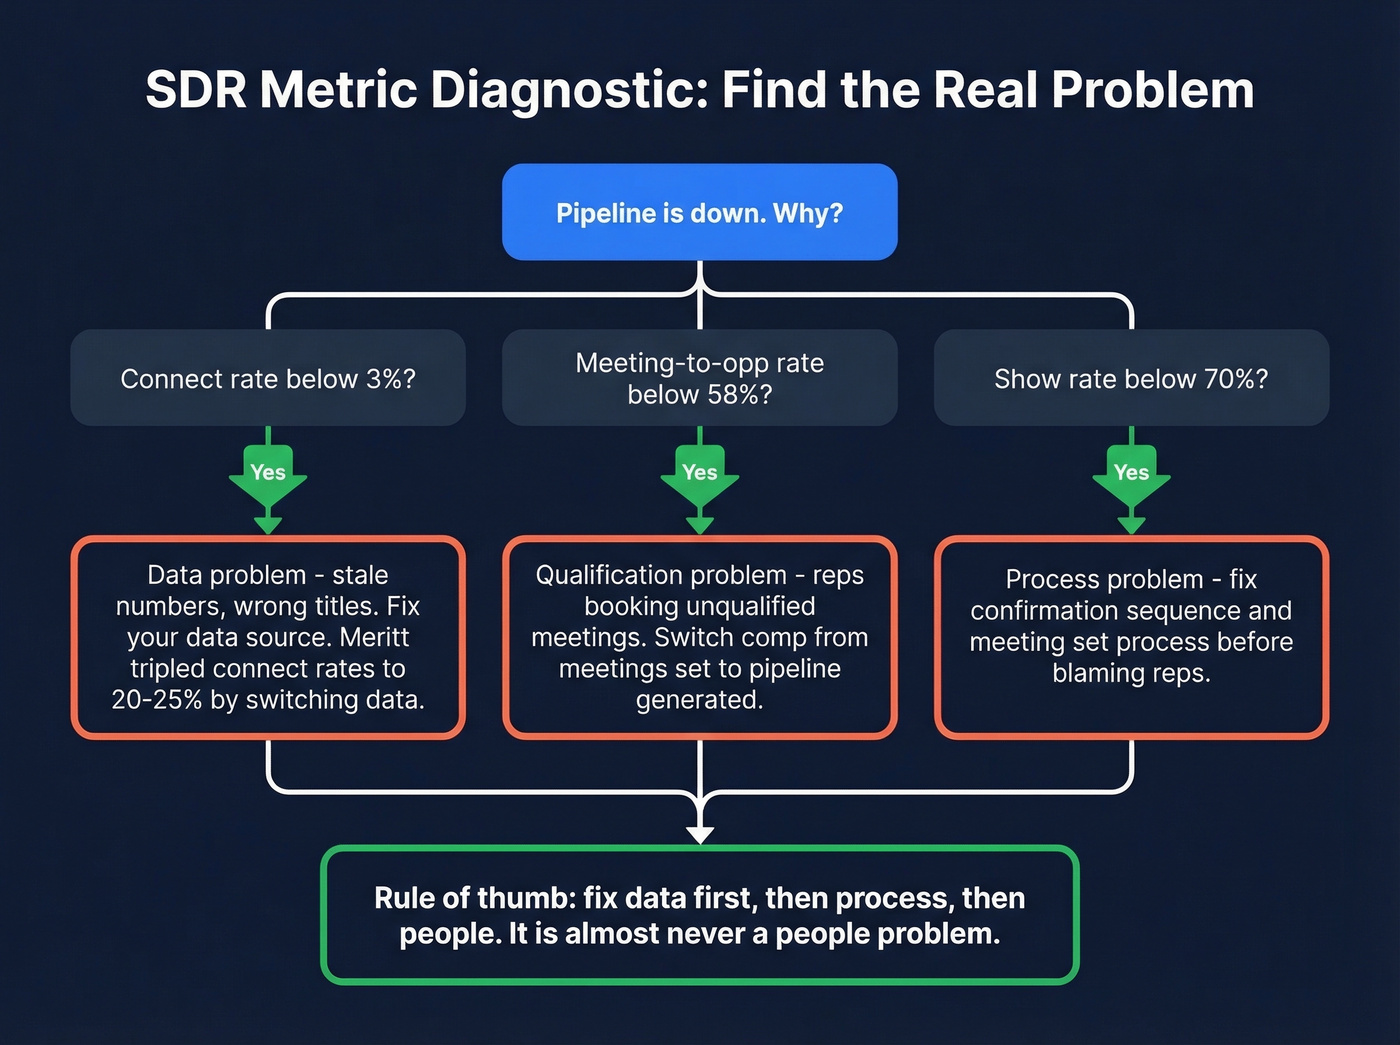
We've seen this pattern repeatedly across the teams we work with. Meritt tripled their connect rate to 20-25% after switching their data source - not by changing scripts, not by hiring better reps, just by fixing the input. Snyk took their bounce rate from 35-40% down to under 5% and saw AE-sourced pipeline jump 180%. GreyScout cut rep ramp time from 8-10 weeks to 4 weeks by giving new reps clean data from day one.
This is where Prospeo fits in: 98% email accuracy, 125M+ verified mobile numbers, and a 7-day data refresh cycle versus the 6-week industry average. When your data is clean, your metrics actually reflect rep performance instead of data rot.

You can't hit $3M/year in pipeline per SDR when a third of your emails bounce and your dials hit disconnected lines. Prospeo's 7-day data refresh cycle means your reps always reach real people - not ghosts. Snyk dropped bounce rates from 35% to under 5% and grew AE-sourced pipeline 180%.
Clean data turns every metric in this article green.
How SDR KPIs Are Changing in 2026
Around 30% of outbound messages are now AI-generated. The Bridge Group's latest report tracks "AI SDRs" as a category for the first time. When AI writes half the emails, email volume stops being a meaningful metric for individual rep performance.
The measurement shift is moving toward account progress - how many stakeholders are engaged, how deep into the buying committee an SDR has penetrated, and whether the account is advancing through stages. Comp models are evolving from meetings set toward multi-threading quality and engagement depth. Sales engagement platforms hit 84% adoption for allbound motions, and sales navigator tools sit at 88% among outbound teams.
Let's be honest: teams that still measure SDRs purely on meetings booked will find themselves optimizing for a metric that no longer predicts revenue. The shift toward account-level and revenue-level measurement isn't optional anymore - it's survival.
If you want to operationalize this shift, start with account-based selling and a tighter ideal customer profile.
FAQ
How many meetings should an SDR book per month?
8-15 is the standard range for mid-market B2B. Top performers hit 15-20. Show rate (target 80%+) and meeting-to-opportunity conversion (target 58%+) matter more than the raw number. Ten qualified meetings beat 20 no-shows every time.
What's a good SDR connect rate?
5-12% for outbound cold calls. Below 5% signals a data quality problem - stale numbers, wrong titles - not a rep issue. Teams using verified mobile numbers routinely push connect rates above 10% without changing scripts. Skip this metric as a comp lever; it's a diagnostic tool, not a performance indicator.
What are the most important SDR KPIs to comp on?
Pipeline generated, meeting-to-opportunity rate, and SDR-sourced closed-won revenue. These three tell you whether your team creates real revenue, not just activity. Layering in speed-to-lead and show rate gives managers the coaching visibility to improve those top-line numbers quarter over quarter. For a deeper look at comp structures, Pavilion's SDR compensation guide breaks down base-to-variable ratios by company stage.