Sales Enablement Content Strategy Reps Will Actually Use
Your marketing team created 47 pieces of sales enablement content last quarter. Reps opened 11 and shared 3 with prospects. That's a ~6% shared rate - and it's normal. Forrester found that 65% of sales enablement content goes unused, and revenue teams burn 440 hours a year searching for or recreating assets buried in shared drives nobody remembers.
You don't need more content. You need a sales enablement content strategy that makes fewer assets findable, relevant, and backed by clean data. Most guides on this topic are written by a platform vendor selling $50K/year software. This one isn't.
What You Need (Quick Version)
Before you build anything new, audit what you have. Most teams discover around 70% of content won't ever be used by sales. Then prioritize the three formats with the highest usage rates:
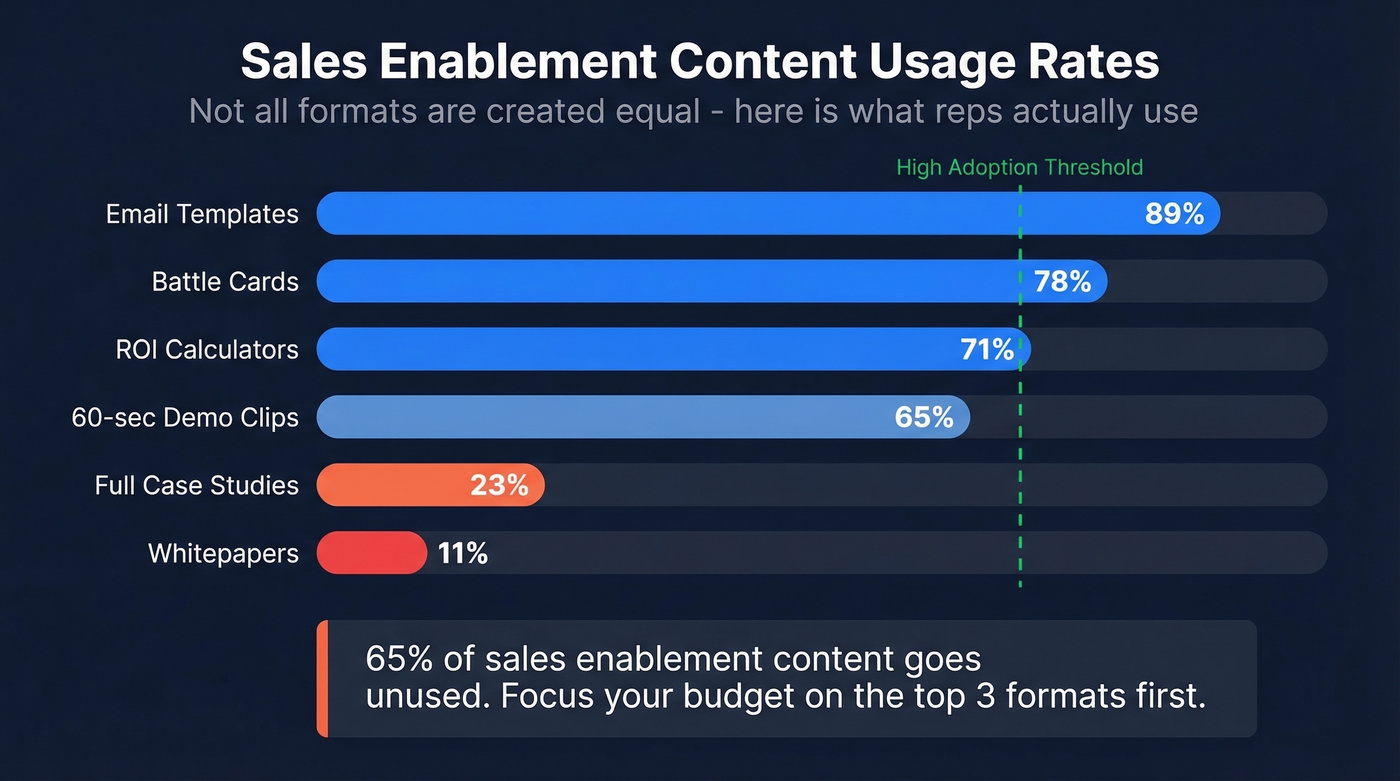
- Email templates/snippets - 89% usage rate
- One-page battle cards - 78% usage rate
- ROI calculators - 71% usage rate
Organize everything by buyer challenge, not internal product line. Apply the five-second findability rule: if a rep can't locate the right asset in five seconds, it doesn't exist. Measure deals influenced, not assets produced. And verify your prospect data before distributing anything - the best battle card in the world is worthless if the email bounces.
What Enablement Content Actually Is
Sales enablement content is any asset that helps a rep move a deal forward. It splits into two buckets: internal content like battle cards, playbooks, and competitive intel that reps consume, and external content like case studies, ROI calculators, and demo clips that reps share with buyers.
Here's the reframe that matters: content in the sales process isn't a supplement to the conversation. Content is the sales conversation. B2B buyers now spend only 17% of their purchase journey meeting with potential suppliers. Forrester projects that more than half of large B2B transactions - including $1M+ deals - will flow through digital self-serve channels.
The content you create is your proxy in rooms you'll never enter. If that doesn't change how you prioritize enablement, nothing will.
Which Content Formats Get Used
Not all formats are created equal. Here's what the usage data shows:
| Content Type | Usage Rate | Priority |
|---|---|---|
| Email templates | 89% | Create first |
| Battle cards | 78% | Create first |
| ROI calculators | 71% | Create first |
| 60-sec demo clips | 65% | High value |
| Full case studies | 23% | Only for BOFU |
| Whitepapers | 11% | Deprioritize |
Whitepapers have an 11% usage rate. Eleven percent. Yet most marketing teams keep producing them because they're comfortable and they look impressive in a content calendar. Meanwhile, reps are begging for a one-page battle card they can pull up during a live call. 50% of engagement comes from just 10% of content. Stop producing assets that make marketing feel productive but leave sales empty-handed.
The best enablement content in the world fails when it lands in a dead inbox. Prospeo's 98% email accuracy and 7-day data refresh mean every battle card, ROI calculator, and case study you send actually reaches the buyer.
Stop perfecting content that bounces. Start with verified data.
How to Build Your Strategy Step by Step
Step 1 - Audit What You Have
Before you create a single new asset, inventory what already exists. Over 25% of marketing budget goes to content, and most of that investment is sitting unused in forgotten folders.
For every asset, document the funnel stage it targets - awareness, consideration, or decision. Log the content type, when it was last updated (flag competitive battle cards older than 6 months), its usage data including views, shares, and attachment rate, and who owns keeping it current. This is content governance at its most basic, and most teams skip it entirely.
Then apply four decision rules: keep, update, consolidate, or retire. In our experience, most teams retire 40-50% of their library on the first pass and flag another 20-30% for updates. A lean, current library beats a bloated one every time.
Step 2 - Map Content to Deal Moments
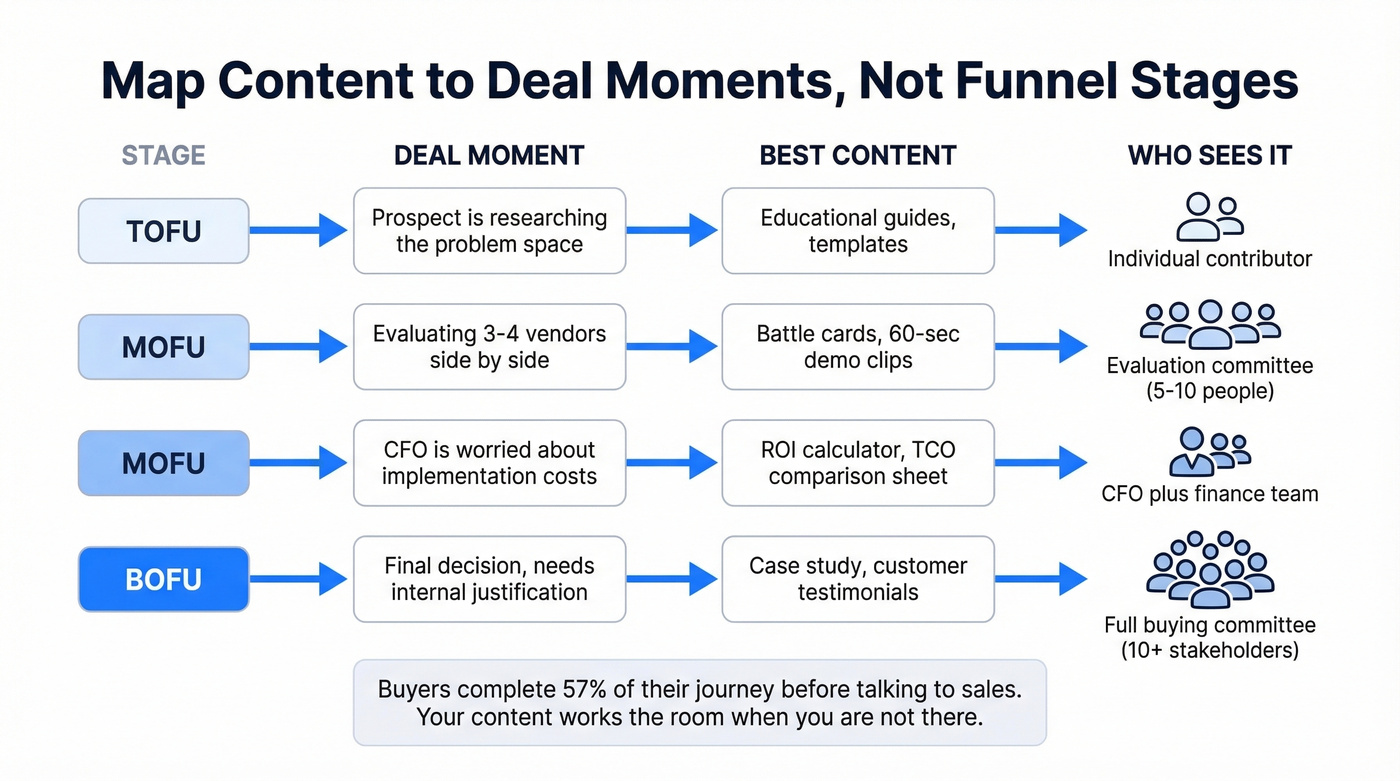
Generic funnel stages are a starting point, but they're not specific enough. Mapping content to the sales process at the deal-moment level is what separates teams that influence revenue from teams that just produce assets. "MOFU content" doesn't tell a rep what to send when the CFO is worried about implementation costs and needs something in 10 minutes.
| Stage | Deal Moment | Best Content |
|---|---|---|
| TOFU | Prospect researching | Educational guides, templates |
| MOFU | Evaluating options | Battle cards, demo clips |
| MOFU | CFO cost concerns | ROI calculator, TCO sheet |
| BOFU | Final decision | Case study, testimonials |
Buyers complete about 57% of their journey before their first meaningful interaction with sales, and over 50% of younger B2B buyers will include 10+ external influencers in their purchase decisions. Your content needs to work for the buyer persona you're targeting and the five people they're forwarding it to internally. Map content to specific objections and questions at each moment, not abstract funnel labels.
Step 3 - Build a Seller-Centric Taxonomy
Your top AE just spent 40 minutes before a demo hunting through Google Drive, Slack, and the CRM for a competitive battle card she swears existed. She gave up and winged it. The deal stalled.
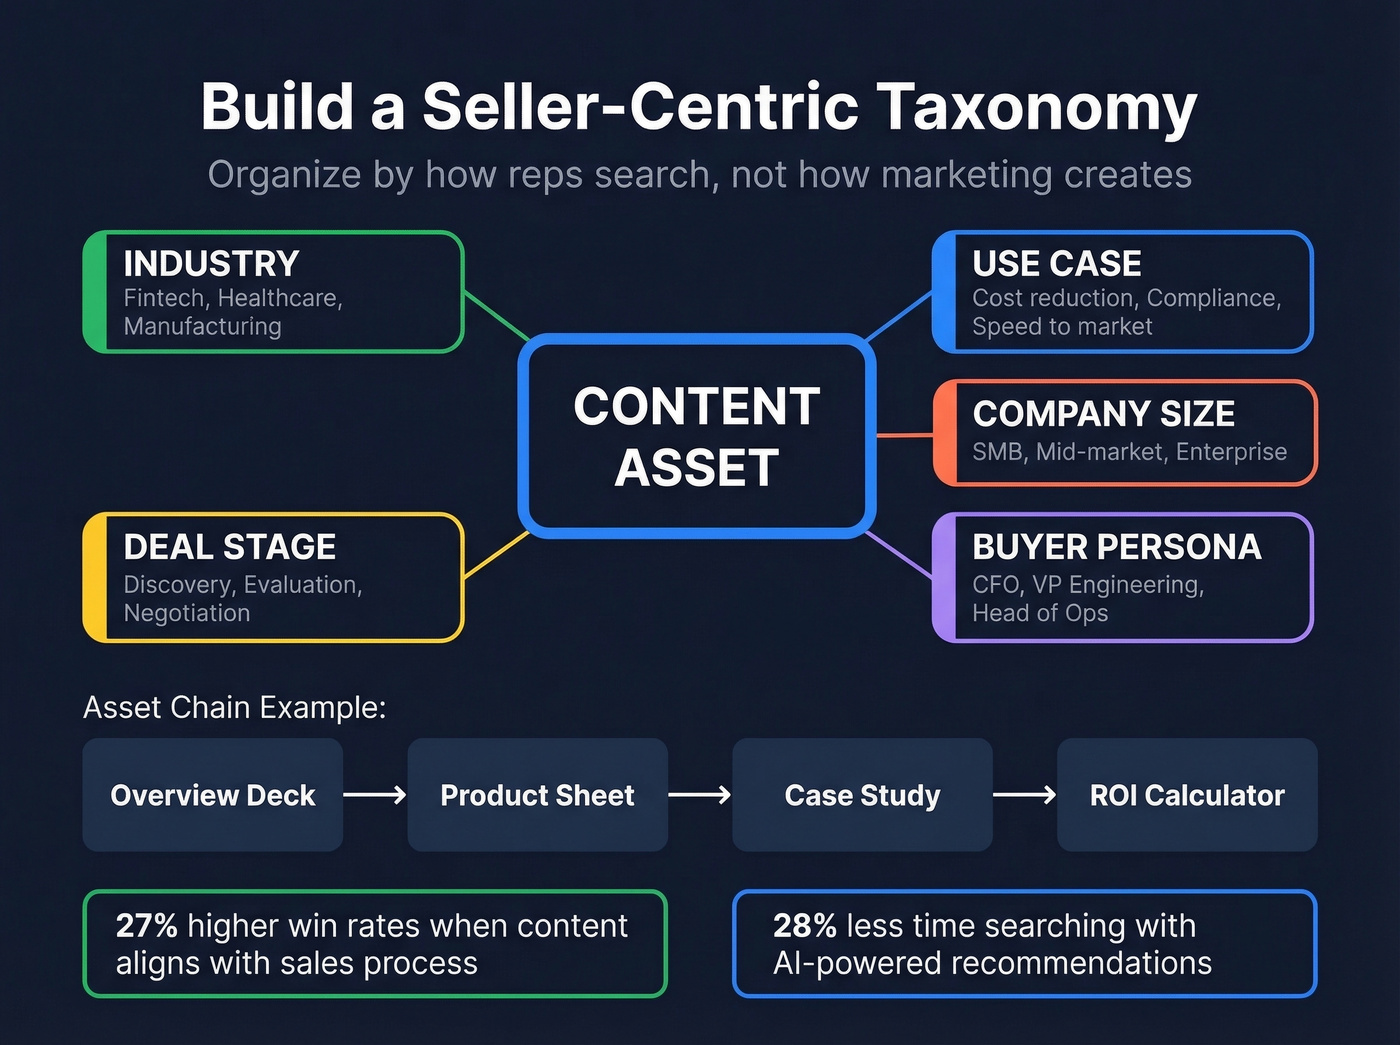
This happens because most content libraries are organized by internal product lines or marketing campaigns - structures that make sense to the people who created the content, not the people who need to use it. Build a multi-dimensional tagging system instead:
- Industry - fintech, healthcare, manufacturing, other verticals
- Use case - cost reduction, compliance, speed-to-market
- Company size - SMB, mid-market, enterprise
- Buyer persona - CFO, VP Engineering, Head of Ops
- Deal stage - discovery, evaluation, negotiation
Then link related assets into chains: overview deck → product sheet → case study → ROI calculator. A rep should start with any asset and navigate to the next one they need without leaving the flow. AI-powered content recommendations improve content relevance by 41% and cut time spent searching by 28%. Sales reps spend 26% of their time searching for or creating materials - a proper taxonomy cuts that dramatically, and aligning content with the sales process yields 27% higher win rates.
Step 4 - Create High-Adoption Formats First
Go back to the usage-rate table. Your first investment should be email templates, battle cards, and ROI calculators - the three formats with 71%+ usage. These are the content pillars for reps in live deal situations, not the assets they bookmark and forget. Concentrate your budget on the top 10-20% of assets driving the majority of engagement. You can always add whitepapers and long-form content later, but only after the high-adoption foundation is solid.
Step 5 - Distribute Where Reps Already Work
If content lives in a separate portal that requires a different login, reps won't use it. The five-second findability rule isn't aspirational - it's a survival threshold. When a seller clicks through more than two folders, the asset doesn't exist as far as they're concerned.
Distribute content through the tools reps already live in: CRM, Slack, email. Centralized content libraries drive 25% higher usage rates compared to scattered repositories, but "centralized" means accessible from where reps work, not locked in a standalone platform. Nobody wants another login.
Here's the thing: even the best enablement content is useless if your reps are sending it to bounced emails. Before rolling out new assets, verify your prospect data. We've seen teams invest weeks building a killer battle card only to discover 30% of their CRM contacts had dead email addresses. Prospeo verifies emails at 98% accuracy on a 7-day refresh cycle, so reps reach real prospects instead of wasting perfectly good content on dead inboxes.
Step 6 - Launch with Peer Endorsement
Don't announce new content with a marketing email blast. Get your top-performing rep to demo how they used the asset in a real deal. "I sent this ROI calculator to the CFO at [account] and it unstuck a deal that had been stalled for three weeks" is infinitely more compelling than "New asset available in the content library!" We've seen adoption rates double just by changing who delivers the message.
Step 7 - Measure What Matters
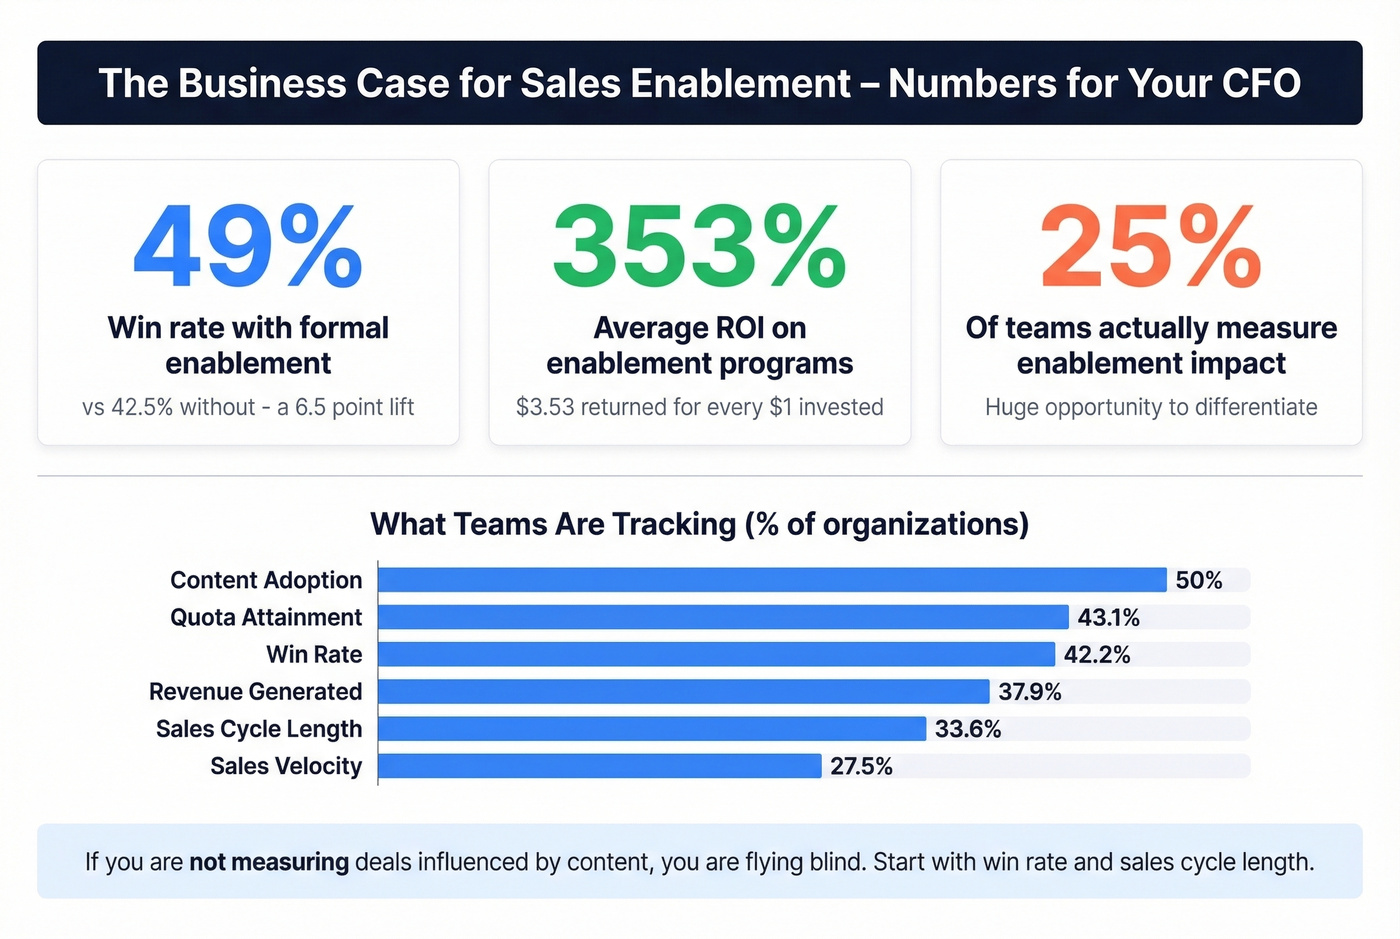
If you're measuring how many people opened a battle card but not whether deals closed faster, you're measuring the wrong thing. Only 25% of organizations measure enablement impact at all. Here's what to track:
| Metric | % of Teams Tracking |
|---|---|
| Content adoption | 50% |
| Quota attainment | 43.1% |
| Win rate | 42.2% |
| Revenue generated | 37.9% |
| Sales cycle length | 33.6% |
| Sales velocity | 27.5% |
The benchmark that matters most: companies with formal enablement programs see a 49% win rate on forecasted deals vs 42.5% without. That 6.5-point lift is the number you bring to your CFO. Pair it with the fact that structured enablement programs deliver a 353% average ROI - $3.53 returned for every $1 invested - and the business case writes itself.
One measurement most enablement teams never think about: how much of your pipeline is actually reachable. Run your CRM contact list through an enrichment API that returns verified contact data, and you'll immediately see how many deals are sitting on dead emails. That gap directly impacts every other metric on this list.
Who Should Own the Strategy
Enablement ownership is shifting. Here's where it sits in 2026:
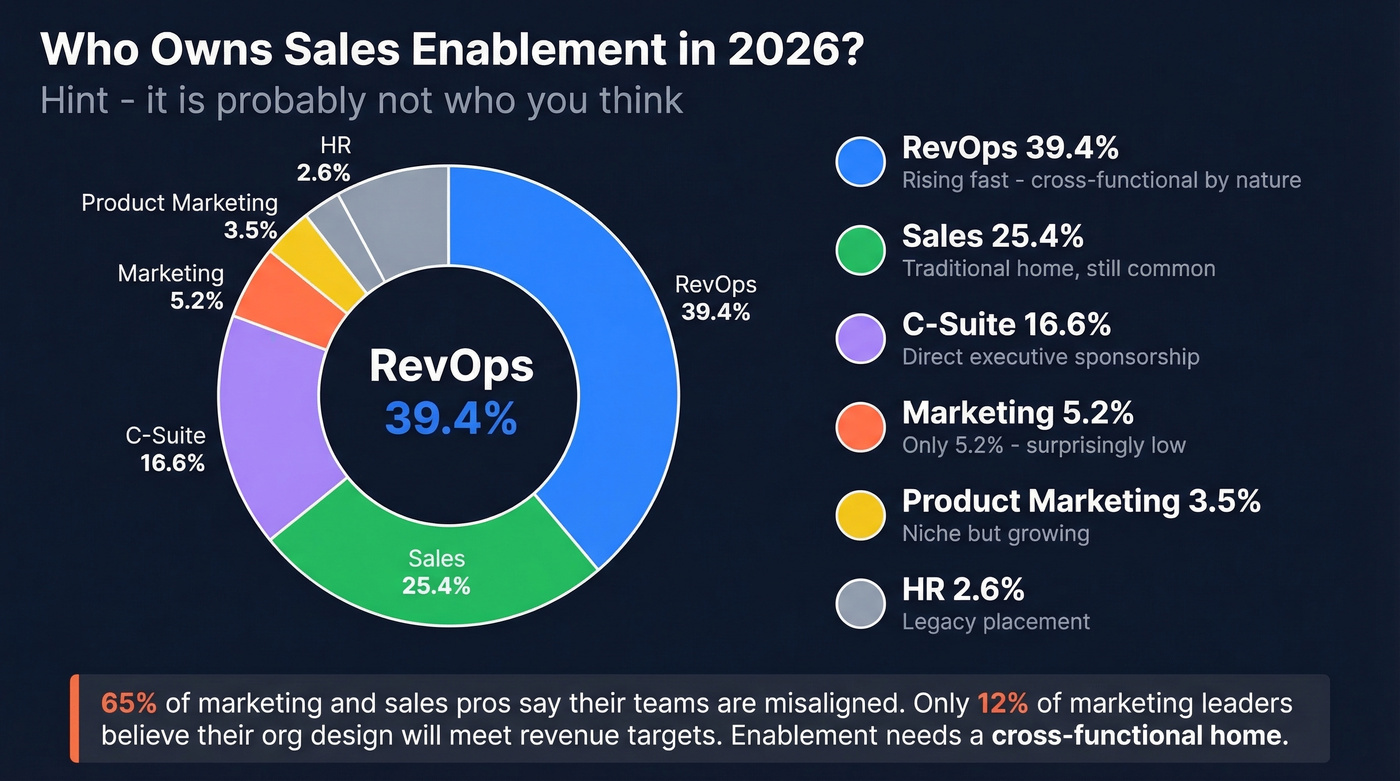
| Department | Ownership % |
|---|---|
| RevOps | 39.4% |
| Sales | 25.4% |
| C-Suite | 16.6% |
| Marketing | 5.2% |
| Product Marketing | 3.5% |
| HR | 2.6% |
RevOps ownership is rising because enablement is fundamentally a cross-functional problem. Content comes from marketing, usage data comes from sales, and tech stack decisions sit in ops. It's no surprise that 65% of marketing and sales professionals believe there's a lack of alignment between their teams - and only 12% of marketing leaders believe their current org design will meet revenue targets. The worst outcome is when enablement reports to a single department and becomes a reactive order-taker instead of driving strategy.
If your enablement function doesn't have a seat at the revenue planning table, it'll always be playing catch-up.
Five Mistakes That Kill Enablement Programs
1. Measuring surface metrics instead of revenue outcomes. Course completion rates and content views feel productive but tell you nothing about pipeline impact. Track win rates, cycle length, and quota attainment. Everything else is vanity.
2. Producing more content when 65% goes unused. The instinct when content isn't working is to create more. The correct instinct is to fix findability and relevance first. Reps recreate existing content 40% of the time because they can't find what already exists - that's a distribution problem, not a production problem.
3. Organizing by internal product lines instead of buyer challenges. Your prospect doesn't care about your product org chart. They care about solving a problem. Tag and organize content by the challenge it addresses, not the team that created it.
4. Launching content without peer endorsement. A Slack message from marketing gets ignored. A 2-minute Loom from your top AE showing how she used the asset to close a deal gets watched. The messenger matters more than the message.
5. Ignoring data quality. Your enablement team spent 20 hours building a competitive battle card. Your rep attaches it to a personalized email. The email bounces. Bad prospect data quietly wrecks enablement ROI before anyone notices, and reps lose trust in the entire process. The consensus on r/sales is that data hygiene is the most underrated part of any enablement stack - and they're right.
Enablement Platform Landscape in 2026
The market is in chaos. Seismic and Highspot announced a definitive merger in February 2026. Showpad completed its merger with Bigtincan in October 2025. Gong expanded into full revenue enablement in early 2026. Fewer independent vendors, bigger platform bets.
On Gartner Peer Insights, the ratings are tightly clustered: Seismic 4.7, Showpad 4.7, Highspot 4.7, Mindtickle 4.5, Allego 4.7. When everyone's a 4.7, the differentiator is pricing, integration depth, and whether you actually need a full platform.
Typical enterprise contracts run $15K-$100K+/year depending on seats and modules. Let's be honest: if you're a sub-200-person company, you almost certainly don't need a dedicated enablement platform. A well-organized Google Drive with a proper taxonomy, a solid sales playbook, and clean prospect data underneath will outperform a $50K platform that nobody logs into. Skip the platform if your team hasn't nailed the basics of content organization and data quality first. Reps don't need another tool - they need the right content for their pipeline at the right time. If you do buy a platform, negotiate aggressively and avoid 3-year contracts. The vendor landscape will look completely different by 2028.
Reps waste 26% of their time searching for content - and even more chasing bad contact data. Prospeo gives your team 300M+ verified profiles with 30+ filters so every asset hits the right persona at the right deal moment.
Match your enablement strategy with data reps actually trust.
FAQ
What's the most important enablement content type?
Email templates and one-page battle cards have the highest usage rates - 89% and 78% respectively. Start with formats reps use daily in live deals. Whitepapers sit at just 11% usage. Prioritize assets that get pulled up during calls and sent in real-time, not long-form content that gets bookmarked and forgotten.
How do you measure enablement content effectiveness?
Track revenue outcomes: win rate, sales cycle length, quota attainment, and pipeline influenced - not vanity metrics like views or downloads. Companies with formal enablement programs see a 49% win rate versus 42.5% without. Only 25% of organizations measure enablement impact at all, so doing it puts you ahead of most competitors.
How does prospect data quality affect enablement ROI?
Even the best battle card fails if the rep's email bounces or phone number is disconnected. Bad data silently undermines every piece of content your team creates. Teams that clean CRM data before launching new content consistently see higher adoption and faster deal cycles - one of our customers cut their bounce rate from 35% to under 4% just by running their list through a verification step before outreach.
How do you build a content strategy for sales from scratch?
Start by auditing existing assets, retiring anything outdated, and mapping what remains to specific deal moments - not generic funnel stages. Build your first new assets in the three highest-usage formats: email templates, battle cards, and ROI calculators. Distribute through tools reps already use, launch with peer endorsement, and measure deals influenced. Most teams stand up a functional strategy in 4-6 weeks.