Every Sales Forecast Formula You Need (Plus How to Know If Yours Is Right)
It's the last week of the quarter. Your VP asks for the number. You pull up the spreadsheet, squint at the pipeline, and produce a forecast that's basically a guess dressed in math. 79% of sales orgs miss their forecast by more than 10%. You're not alone, but you can be better.
Before we get into formulas, let's clear up three terms people use interchangeably when they shouldn't:
- Forecast - what you expect given current pipeline and conditions
- Projection - what might happen under a hypothetical scenario
- Budget/Target - what management hopes will happen, which is a goal, not a prediction
What You Need (Quick Version)
| Your Situation | Use This Formula | When It Breaks |
|---|---|---|
| Stable historical data | Historical growth rate | Market shift or new segment |
| Defined pipeline stages | Weighted pipeline | Uncalibrated probabilities |
| Early-stage / new product | Bottom-up conversion | No conversion data yet |
| Board deck / sanity check | Top-down (TAM) | Always - it's a napkin exercise |
| Volatile deal flow | Scenario-based (3 buckets) | No base formula underneath |
| Long enterprise cycles | Sales-cycle-length | Inconsistent cycle lengths |
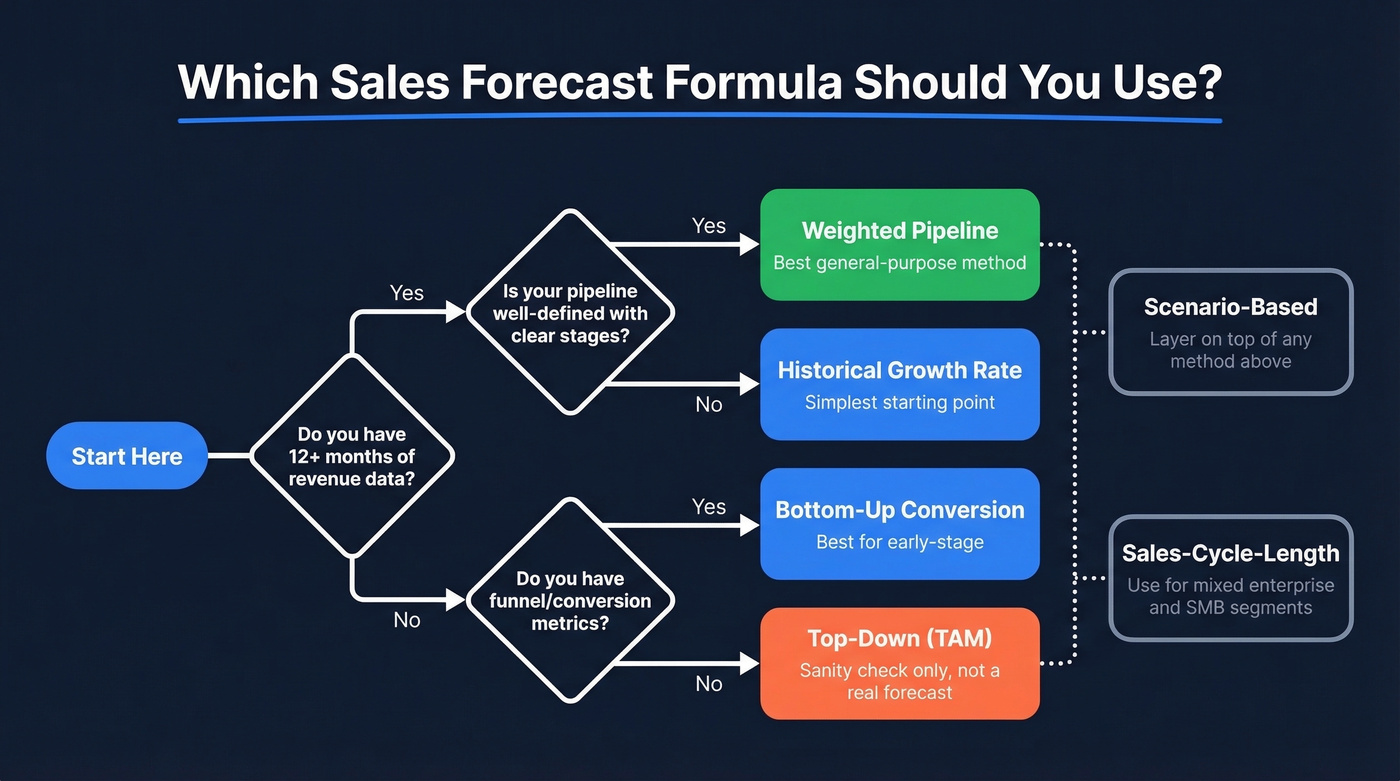
You don't need all six. Pick one for your pipeline and one for your plan, then build a way to measure which one was right.
How to Calculate a Sales Forecast
Historical Growth Rate
The simplest forecasting calculation in the toolkit, and the one most teams should start with.
Forecast = Previous Period Sales x (1 + Growth Rate)
Closed $500K last quarter at 15% QoQ growth? Your forecast is $500K x 1.15 = $575K. This works best when you have at least 12-24 months of consistent data and your business hasn't undergone a major shift in ICP or go-to-market motion. Adjust for seasonality if your business has predictable peaks - a Q4-heavy SaaS company can't use Q3 as a straight baseline. If you just pivoted your target market, this number is fiction.
Weighted Pipeline
This is the best general-purpose method for B2B teams with an established sales process. Full stop.
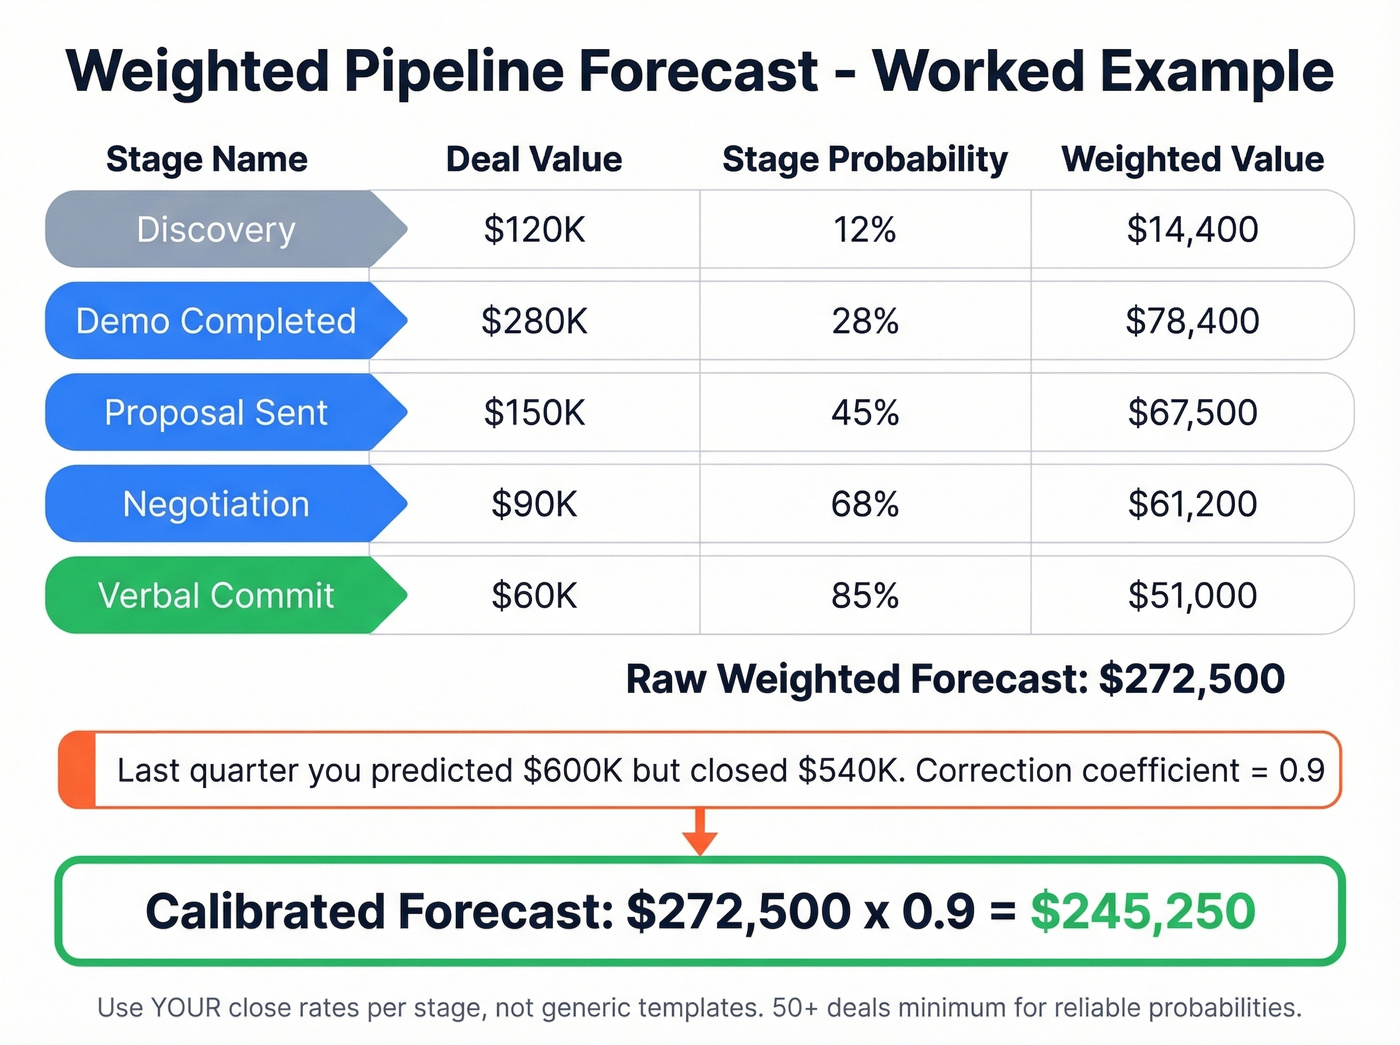
Forecast = Sum of (Deal Value x Stage Probability)
Don't copy generic probability tables. Calibrate from your own data. Pull your last closed opps per stage - you want a meaningful sample, ideally 50+ deals minimum. If 28 of 100 demo-stage deals closed, your demo probability is 28%, not the 30% some template told you to use.
Forecastio's calibration framework adds a correction coefficient based on aggregate forecast vs. actuals. If your weighted pipeline predicted $600K and you closed $540K, your coefficient is 0.9. Apply it next quarter and watch your accuracy tighten. We've seen teams shave 5-8 points off their WMAPE just by adding this single correction step, which takes about ten minutes in a spreadsheet.
Sales-Cycle-Length
Monthly Forecast = Total Qualified Pipeline Value / Avg Cycle Length (months)
Got $1.2M in qualified pipeline with a 3-month average cycle? Expect ~$400K/month. But here's where teams get burned: enterprise deals at 6 months and SMB deals at 3 weeks don't belong in the same average. Segment them or this formula lies to you.
Top-Down (TAM-Based)
Forecast = TAM x Market Share %
Look, this is a sanity check, not a forecast. "We'll capture 1% of a $10B market" sounds reasonable in a pitch deck and means absolutely nothing operationally. Use it to gut-check your bottom-up number. Never use it as your primary method.
Bottom-Up Conversion
Reachable Audience -> Engagement Rate -> Conversion Rate -> Avg Deal Size = Revenue
10,000 prospects x 5% engage x 10% convert x $15K average deal = $750K. This is the right approach for early-stage companies where you lack historical revenue data but have funnel metrics. If you're trying to predict sales with zero closed-won history, this conversion-based method is your best starting point - and the quality of your prospect list matters enormously here, since inflated or unreachable contacts will throw off every downstream number.
Scenario-Based Forecasting
This isn't a standalone method. It's a reporting layer. Run your weighted pipeline three times with optimistic, calibrated, and conservative probabilities. The hardest part is getting reps to classify deals into buckets consistently. Define the criteria once, write them down, hold reps to them. If "best case" means something different to every AE on your team, you don't have scenarios - you have opinions.
Your bottom-up forecast is only as accurate as the prospect list feeding it. Inflated or unreachable contacts break every conversion rate downstream. Prospeo's 300M+ profiles with 98% email accuracy mean your reachable audience number is real - not a fiction that inflates your forecast by 20%.
Stop forecasting on bad data. Start with contacts that actually convert.
How to Measure Forecast Accuracy
Most teams talk about accuracy but never actually measure it. A thread on r/SalesOperations put it bluntly: practitioners suspect many orgs don't track error rates at all.
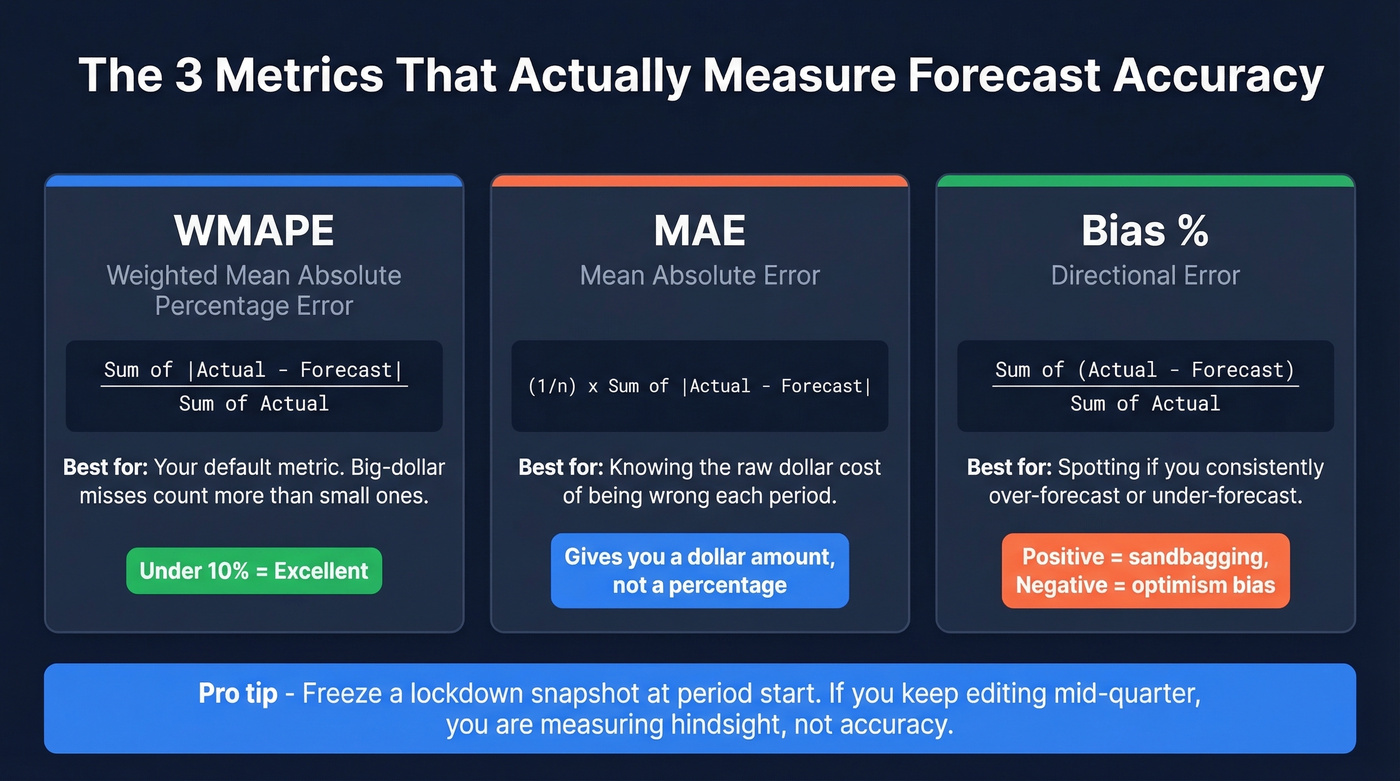
WMAPE (Weighted Mean Absolute Percentage Error) is your default metric:
WMAPE = Sum of |Actual - Forecast| / Sum of Actual
WMAPE is a revenue-weighted error rate, so big-dollar misses count more than small-dollar misses. That's why it's usually a better fit for sales forecasting than MAPE, which gets distorted when actuals are small and breaks entirely when actuals are zero.
MAE gives you the raw-dollar cost of being wrong: MAE = (1/n) x Sum of |Actual - Forecast|. Bias % tells you if you're consistently over- or under-forecasting: Bias % = Sum of (Actual - Forecast) / Sum of Actual.
Two operational requirements most teams skip. First, freeze a lockdown snapshot at period start so you have something to compare against - if you keep editing mid-quarter, you're measuring hindsight, not accuracy. Second, watch for the aggregation fallacy: your top-line number can look accurate while hiding massive regional misses that cancel each other out. We've seen a team hit within 3% of their global target while being off by 40% in EMEA and 35% in APAC, in opposite directions.
Practical bands: WMAPE under 10% is excellent. 10-20% is workable. Over 20% means your formula or your data has a serious problem.

Accuracy Benchmarks by Method
Only 7% of sales orgs achieve 90%+ forecast accuracy. The median sits at 70-79%. Based on an Optifai benchmark of 939 companies:
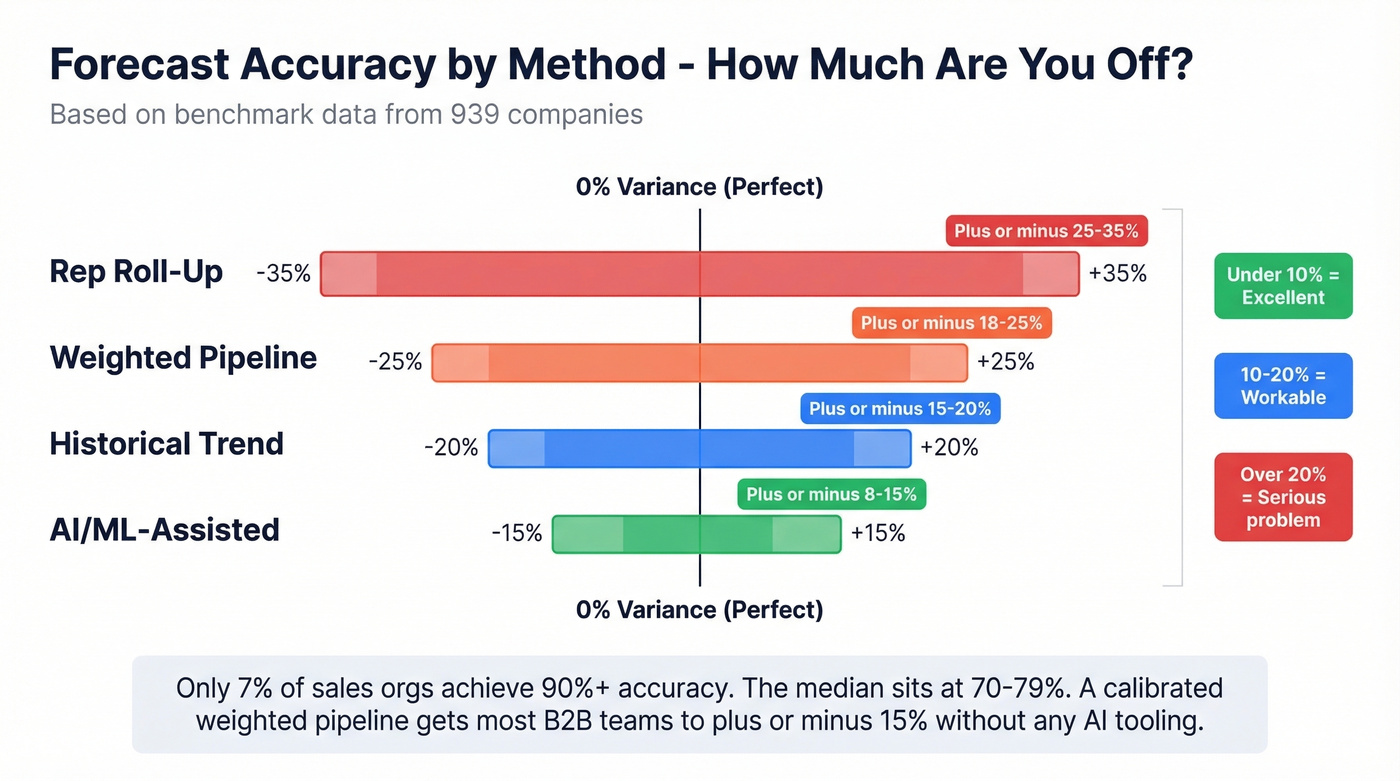
| Method | Typical Variance |
|---|---|
| Rep roll-up | +/-25-35% |
| Weighted pipeline | +/-18-25% |
| Historical trend | +/-15-20% |
| AI/ML-assisted | +/-8-15% |
Rep roll-up at +/-25-35% is a guess with a spreadsheet. If that's your primary method, you're leaving serious planning risk on the table.
Forecast accuracy decays with horizon length: 30-day forecasts land at 85-90% accuracy, 60-day at 75-80%, 90-day at 65-75%. This is why rolling 30/60-day forecasts beat quarterly snapshots for teams that can handle the cadence.
Hot take: most B2B teams under $5M ARR don't need AI forecasting tools. A properly calibrated weighted pipeline with honest stage probabilities will get you to +/-15%, and that's good enough to plan hiring, spend, and capacity. Save the ML budget for when your data volume actually justifies it.
One more number worth knowing: coverage ratio. Weighted Pipeline / Target = Coverage Ratio. SMB teams typically need 1.5-2x coverage. Enterprise teams with longer cycles need 4-5x coverage to hit the same confidence level.
Common Mistakes That Kill Accuracy
Relying on rep gut feel. If your methodology is "ask each rep what they'll close," you're running +/-25-35% variance. That's a poll, not a forecast.
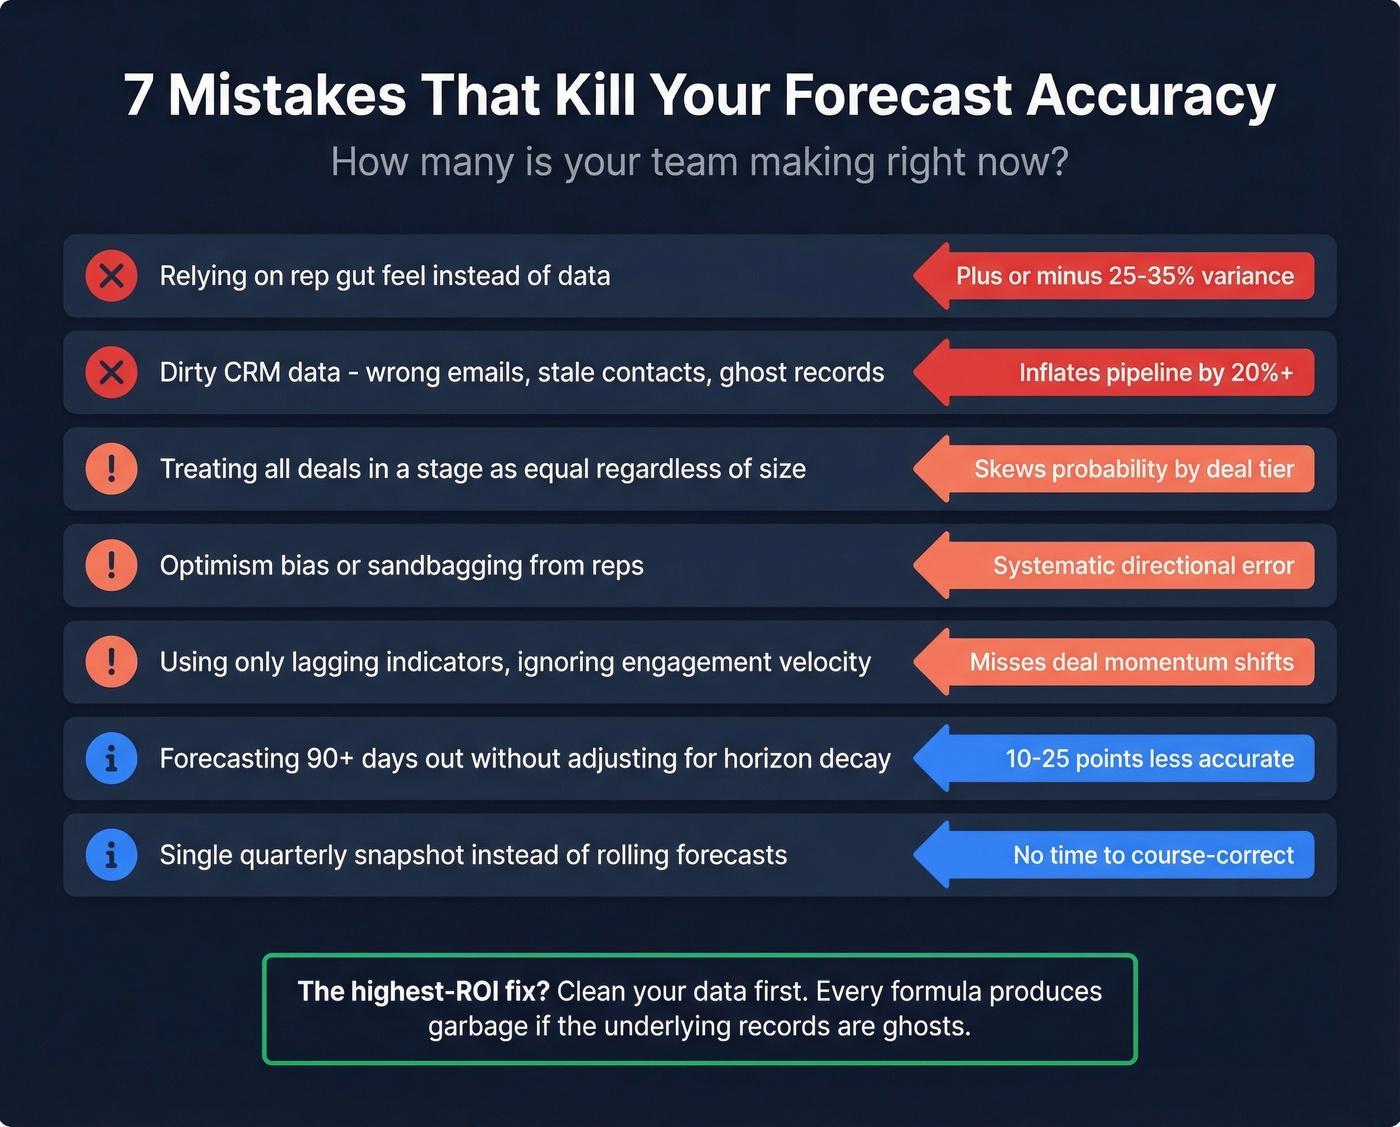
Dirty CRM data. Wrong emails and stale contacts inflate your pipeline with deals that aren't real. This is the silent killer - your formula can be perfect and still produce garbage if the underlying records are ghosts. Prospeo's 7-day data refresh cycle and 98% email accuracy help here, since enriching CRM records with 50+ verified data points per contact means your pipeline reflects actual reachable buyers.
Treating all deals in a stage as equal. A $10K deal and a $200K deal at proposal don't have the same close probability. Segment by deal size at minimum.
Optimism bias and sandbagging. Both distort the number. Calibrate from data, not feelings. If your reps consistently sandbag by 15%, build that into the model rather than fighting human nature every quarter.
Using only lagging indicators. Layer in leading signals like engagement velocity and stage progression speed. A deal that's been sitting at "negotiation" for 60 days isn't the same as one that moved there last week.
Forecasting 90+ days out without adjusting for horizon decay. Your 90-day forecast is around 10-25 percentage points less accurate than your 30-day. Plan accordingly.
Not running rolling forecasts. A single quarterly number locked in January and reviewed in March is a recipe for surprises. Skip this mistake and you'll sleep better.
Coverage ratio means nothing if half your pipeline is built on stale contacts. Prospeo refreshes every record on a 7-day cycle - not the 6-week industry average - so your weighted pipeline reflects deals you can actually reach, not ghosts dragging down your forecast accuracy.
Fresh data every 7 days. Your forecast deserves better than month-old contacts.
FAQ
What's the simplest sales forecast formula?
Historical growth rate: last period's sales x (1 + growth rate). It requires at least 12-24 months of consistent data and works best for stable businesses without major ICP shifts. Adjust for seasonality before applying.
How accurate should a forecast be?
WMAPE under 10% is excellent; 10-20% is workable for most B2B teams. Only 7% of sales organizations hit 90%+ accuracy, so anything below 20% variance puts you ahead of the median.
How do I improve accuracy with bad CRM data?
Start by enriching and verifying contacts so your pipeline reflects real opportunities. Clean data turns every formula from guesswork into planning - and it's the single highest-ROI fix most teams can make before touching their forecasting methodology.
What inputs do I need before calculating a forecast?
You need reliable historical close rates by pipeline stage, an average deal size, and a CRM that reflects your current pipeline - not last quarter's leftovers. Without those three inputs, no forecasting method will save you.