Sales Growth: Measuring and Accelerating It in 2026
A RevOps lead we know ran a "growth audit" last quarter. Revenue was up 18% year-over-year. The board was thrilled - until someone pulled the profit numbers and realized the company had spent $1.27 for every $1.00 it earned. Sales growth without context is a vanity metric. Here's how to measure it properly, benchmark it honestly, and actually move the number in 2026.
The Short Version
Sales growth rate = ((Current Period - Previous Period) / Previous Period) x 100. Use CAGR for multi-year trends. "Good" growth depends entirely on your stage and industry - 26% is median for SaaS, but a $500M manufacturer celebrating 8% is doing great. The three highest-leverage moves right now: fix your data foundation, invest in expansion revenue through NRR, and build a coaching culture instead of a metrics culture.
What Is Sales Growth?
It measures the percentage change in revenue between two comparable time periods. It's one of the most-watched numbers on any revenue leader's dashboard because it captures whether the business is expanding, stagnating, or contracting in a single clean metric.
The formula is straightforward:
Sales Growth Rate = ((Current Period Revenue - Previous Period Revenue) / Previous Period Revenue) x 100
Say your team closed $420,000 in Q1 and $483,000 in Q2. Your quarterly rate is (($483,000 - $420,000) / $420,000) x 100 = 15%. That's a healthy quarter. But one quarter doesn't tell you much - you need to track this consistently across months, quarters, and years to spot real trends versus seasonal noise.
Here's a distinction most articles skip: organic growth comes from winning new customers, expanding existing accounts, and entering new markets. Inorganic growth comes from mergers and acquisitions. Both show up in the same formula, but they tell very different stories about the health of your sales engine. A company that "grew" 40% through an acquisition didn't improve its sales motion - it bought someone else's.
Revenue increases can be measured in total revenue, units sold, average deal size, or expansion revenue from existing customers. The formula stays the same. What changes is the story it tells.
How to Calculate Sales Growth Rate
Month-over-Month and Quarter-over-Quarter
The basic formula works for any time period. If January revenue was $150,000 and February hit $172,500, your MoM growth rate is 15%. Simple enough.
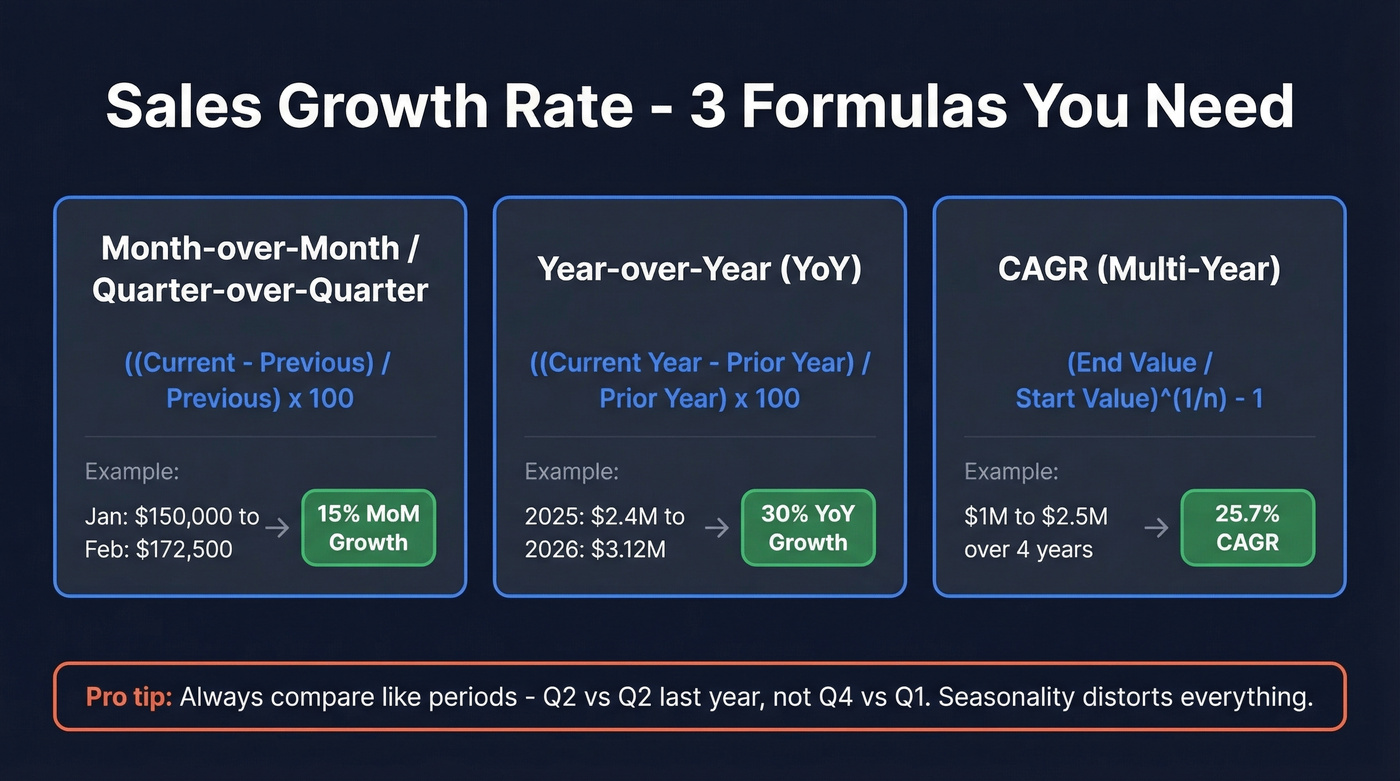
But here's the seasonality trap: comparing December to January in B2B SaaS is misleading because December is inflated by year-end deal pushes. Always compare like periods - January 2026 to January 2025, Q1 to Q1, not Q4 to Q1. Two other interpretation traps worth flagging: one-off deals and team structure changes. If a single whale deal doubled your March revenue, that's not repeatable growth - strip it out for trend analysis. And if you added five reps in Q2, comparing Q2 to Q1 without normalizing for headcount tells you nothing about per-rep productivity.
For quarterly tracking, the same logic applies. Q2 versus Q1 can show momentum, but Q2 versus Q2 last year shows real growth. Most revenue leaders track both, but report the year-over-year number to the board.
Year-over-Year (YoY)
YoY is the standard for board decks and investor conversations. If you closed $2.4M in 2025 and $3.12M in 2026, your YoY growth is (($3.12M - $2.4M) / $2.4M) x 100 = 30%.
CAGR for Multi-Year Trends
When you're looking at growth over multiple years, a simple percentage can mislead. Compound Annual Growth Rate smooths out the bumps.
CAGR = (Ending Value / Beginning Value)^(1/n) - 1
Where n is the number of years. If you grew from $1M to $2.5M over 4 years, your CAGR is ($2.5M / $1M)^(1/4) - 1 = 25.7%. That's a more honest representation than cherry-picking your best year.
Sales Growth vs. Profit Growth
Revenue is the top line. Profit is the bottom line. They don't always move in the same direction, and confusing the two is one of the most expensive mistakes a growth-stage company can make.
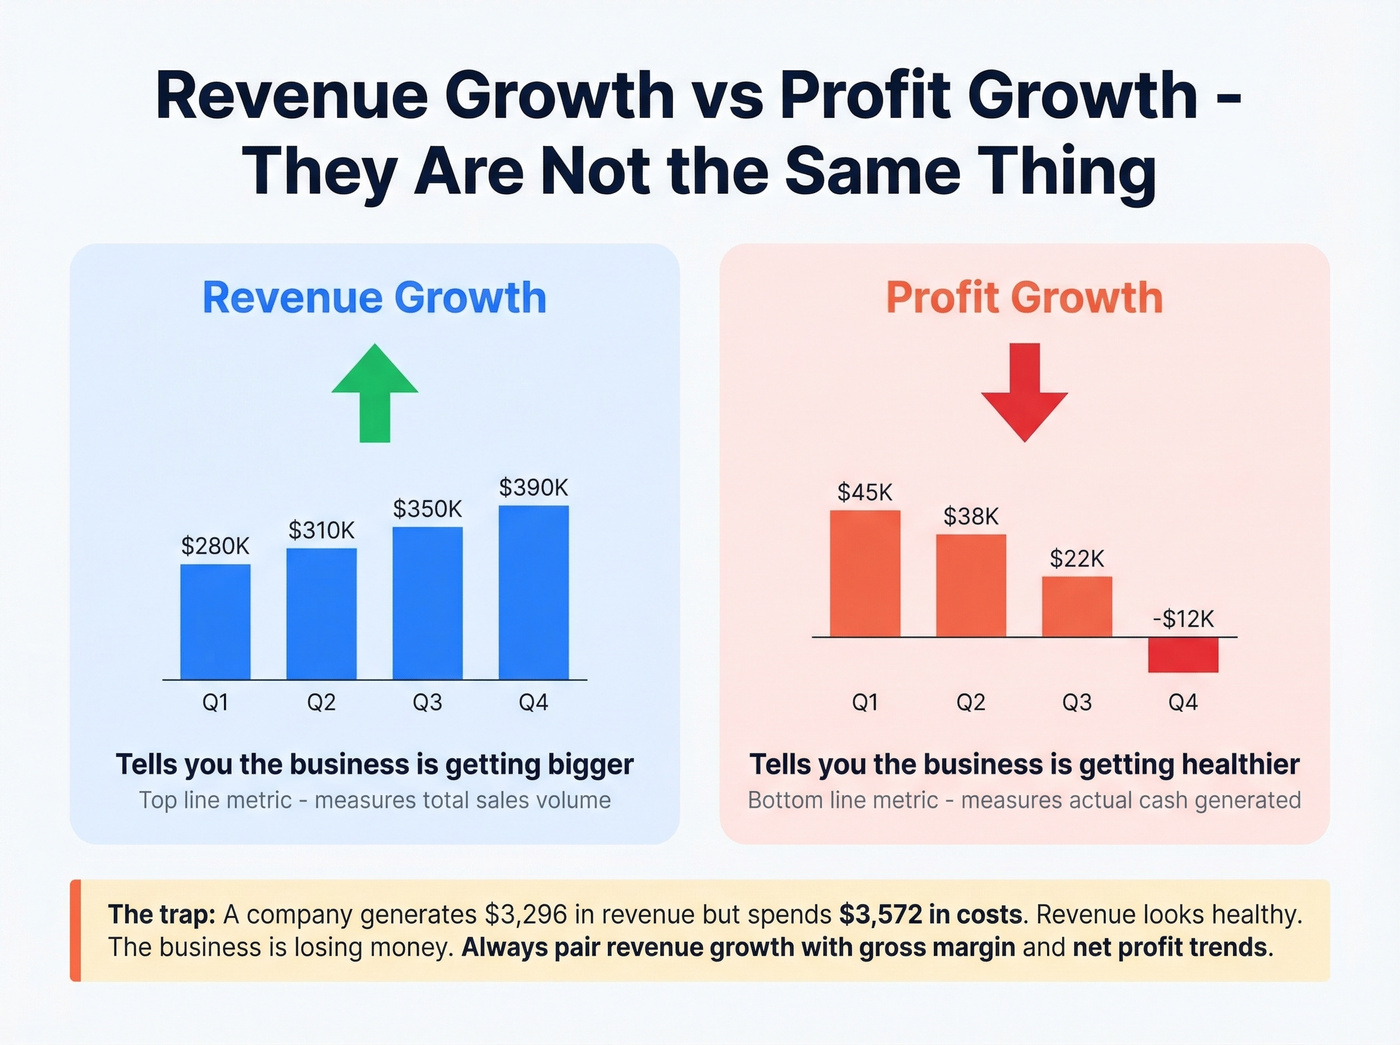
Consider this: a business generates $3,296 in revenue but incurs $3,572 in costs across COGS, marketing, shipping, and fees. Revenue looks healthy. The business is losing money. This happens more often than anyone admits - especially when teams discount aggressively to hit targets or pour ad spend into channels with negative unit economics.
The "discounting your way to growth" trap is real. If you cut prices 20% and volume goes up 15%, your top-line rate looks positive while your margin collapses. Always pair revenue growth with gross margin and net profit trends. Most investors watch EBITDA alongside revenue growth for exactly this reason - it strips out the noise and shows whether the core business generates cash.
Revenue growth tells you the business is getting bigger. Profit growth tells you it's getting healthier. You need both.
What's a Good Sales Growth Rate?
"Good" is meaningless without context. A 15% rate is phenomenal for a $200M enterprise software company and a red flag for a $500K startup.
SaaS Benchmarks
The most reliable SaaS benchmarks come from Benchmarkit's report covering recent performance:
| Metric | Benchmark |
|---|---|
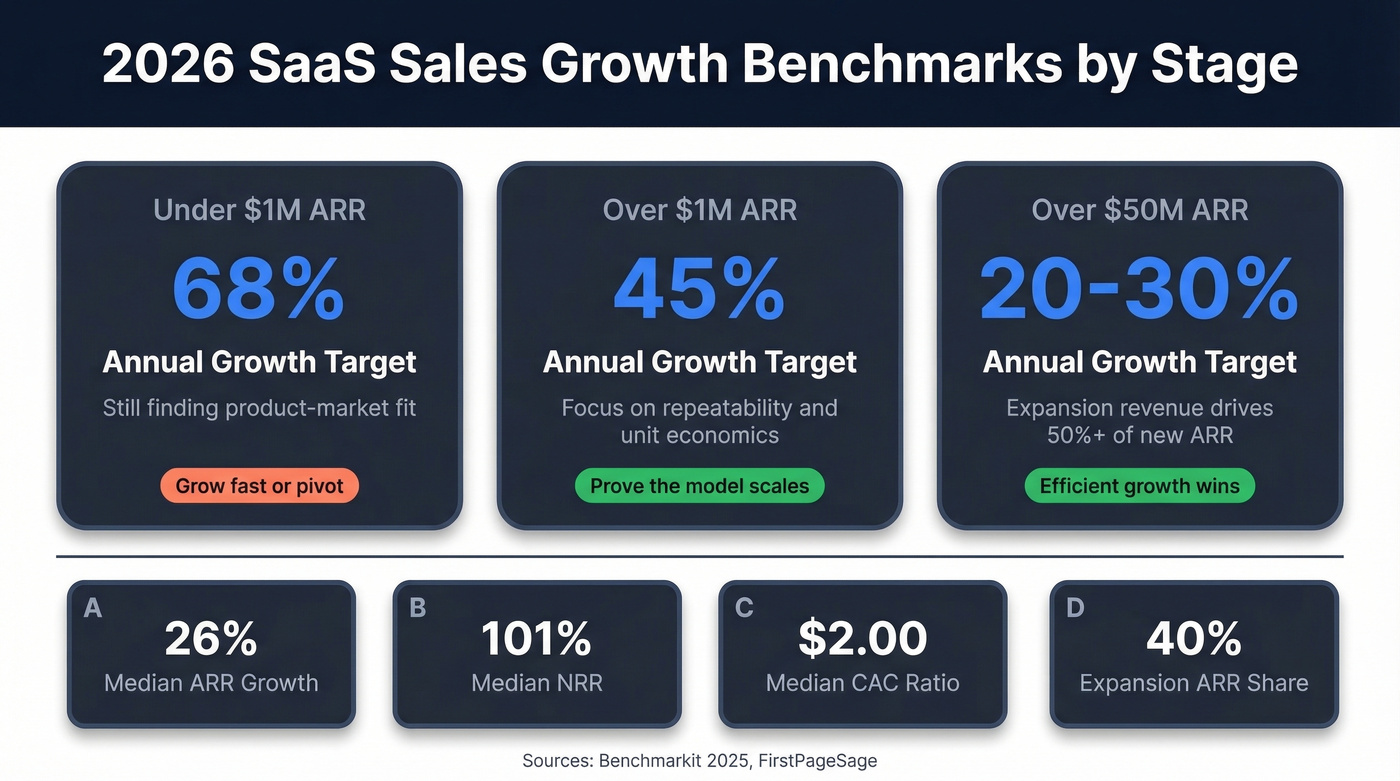
| ARR Growth Rate | 26% median; 50% top growth quartile |
| NRR | 101% median |
| Expansion ARR (% of Total New ARR) | 40% median; >50% for companies above $50M |
| S&M as % of Revenue | 47% (VC-backed) vs 33% (PE-backed) |
Top-quartile growth dropped from 60% in 2023 to 50% in 2024. The era of "grow at all costs" is over. Efficient growth - measured by CAC ratio and NRR - matters more than raw percentage. The median new customer CAC ratio sits at $2.00, and it climbed 14% recently. Acquiring new logos is getting more expensive every quarter.
Targets by Revenue Stage
FirstPageSage's benchmarks provide useful stage-based targets:
- Under $1M ARR: 68% annual growth. You're still finding product-market fit and should be growing fast or pivoting.
- Over $1M ARR: 45% annual growth. You've got traction; now it's about repeatability and unit economics.
- Over $50M ARR: 20-30% is strong. At this scale, expansion revenue typically drives more than half of total new ARR.
Non-SaaS Industry Ranges
Outside SaaS, the numbers look very different:
| Industry | Healthy Annual Growth |
|---|---|
| Retail | 3-7% |
| Manufacturing | 5-10% |
| Professional Services | 8-15% |
| Ecommerce (DTC) | 15-25% |
Pandora posted 13% sales growth to £3.53bn in 2024, driven largely by ecommerce hitting 27% of total revenue - exceptional for a mature retail brand.
You just saw that median CAC ratios climbed 14% - acquiring new logos is getting more expensive every quarter. Prospeo cuts that cost at the source: 300M+ profiles with 98% email accuracy and 125M+ verified mobiles at $0.01/lead. Teams using Prospeo book 26% more meetings than ZoomInfo users because reps spend time selling, not chasing bad data.
Fix your data foundation and watch your sales growth rate follow.
KPIs That Predict Revenue Trajectory
Sales growth rate alone is a lagging indicator. By the time it drops, the damage is already done. You need leading indicators that predict where revenue is heading and efficiency metrics that tell you whether growth is sustainable.
| KPI Cluster | Metrics | Why It Matters |
|---|---|---|
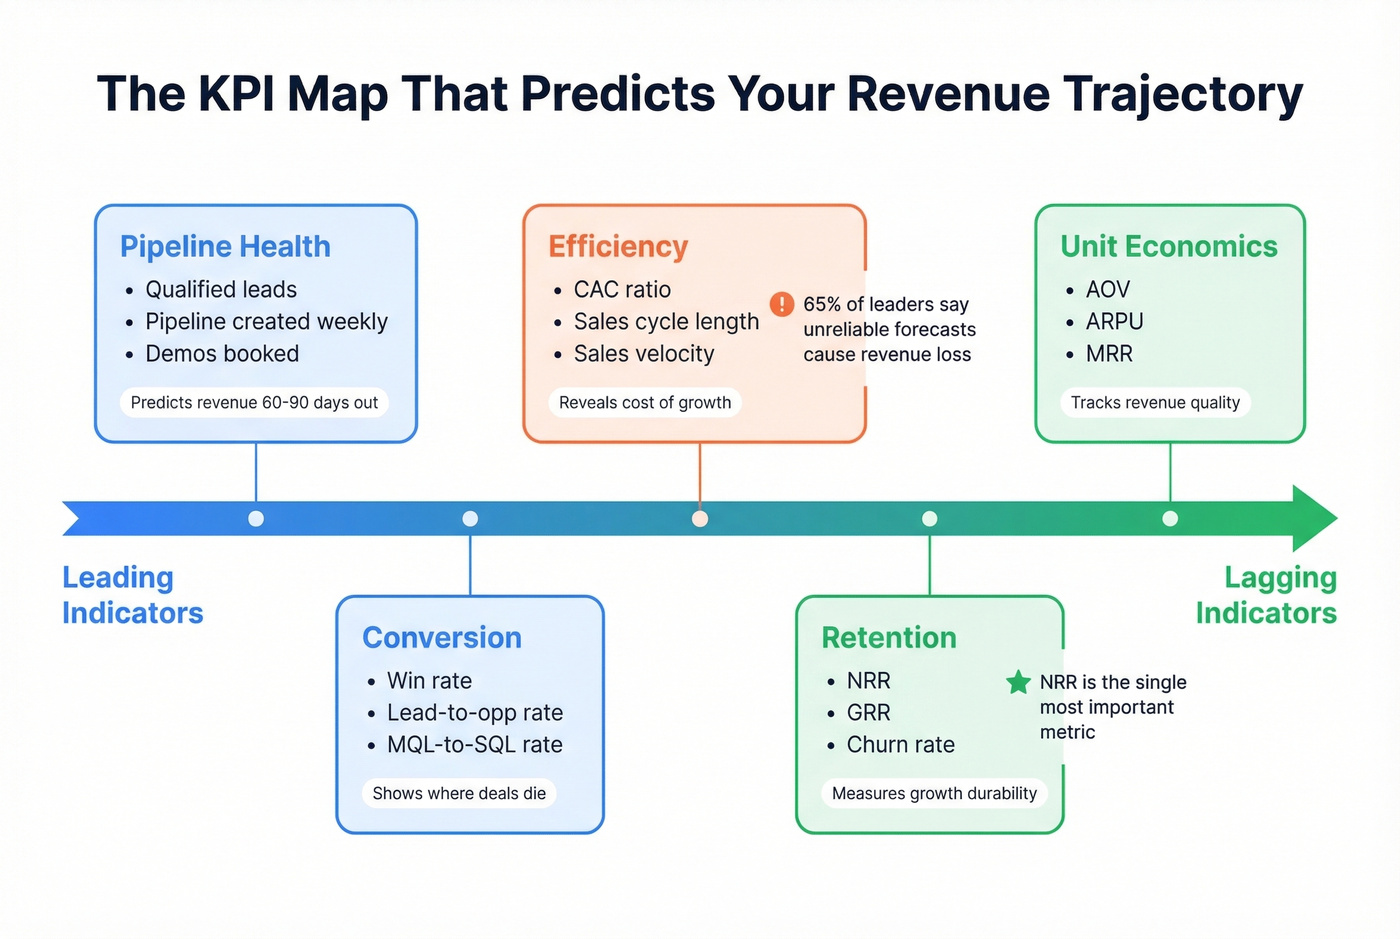
| Pipeline Health | Qualified leads, pipeline created, demos | Predicts future revenue |
| Conversion | Win rate, lead-to-opp, MQL-to-SQL | Shows funnel efficiency |
| Efficiency | CAC ratio, sales cycle length, sales velocity | Reveals cost of growth |
| Retention | NRR, GRR, churn rate | Measures growth durability |
| Unit Economics | AOV, ARPU, MRR | Tracks revenue quality |
Pipeline health is your earliest warning system. If qualified leads drop 20% this month, revenue will feel it in 60-90 days. Track pipeline created weekly, not just at quarter-end.
Conversion metrics expose where deals die. A team with a strong top-of-funnel but a 12% win rate doesn't have a pipeline problem - it has a qualification or demo problem. Diagnose the stage, fix the stage.
NRR is the single most important number on this list. 73% of executive sales leaders now prioritize net revenue retention as a top metric. Expansion ARR represents 40% of total new ARR at the median SaaS company, and over 50% for companies above $50M. If you aren't measuring NRR, you're ignoring almost half your growth engine.
And here's a stat that should alarm every CRO: 65% of revenue leaders say unreliable forecast data is a major source of revenue loss. If your forecasting is built on gut feel and stale CRM data, your numbers will eventually reflect it.
Strategies for Predictable Growth in 2026
These seven strategies are ordered by impact. The first three will move the needle fastest for most teams.
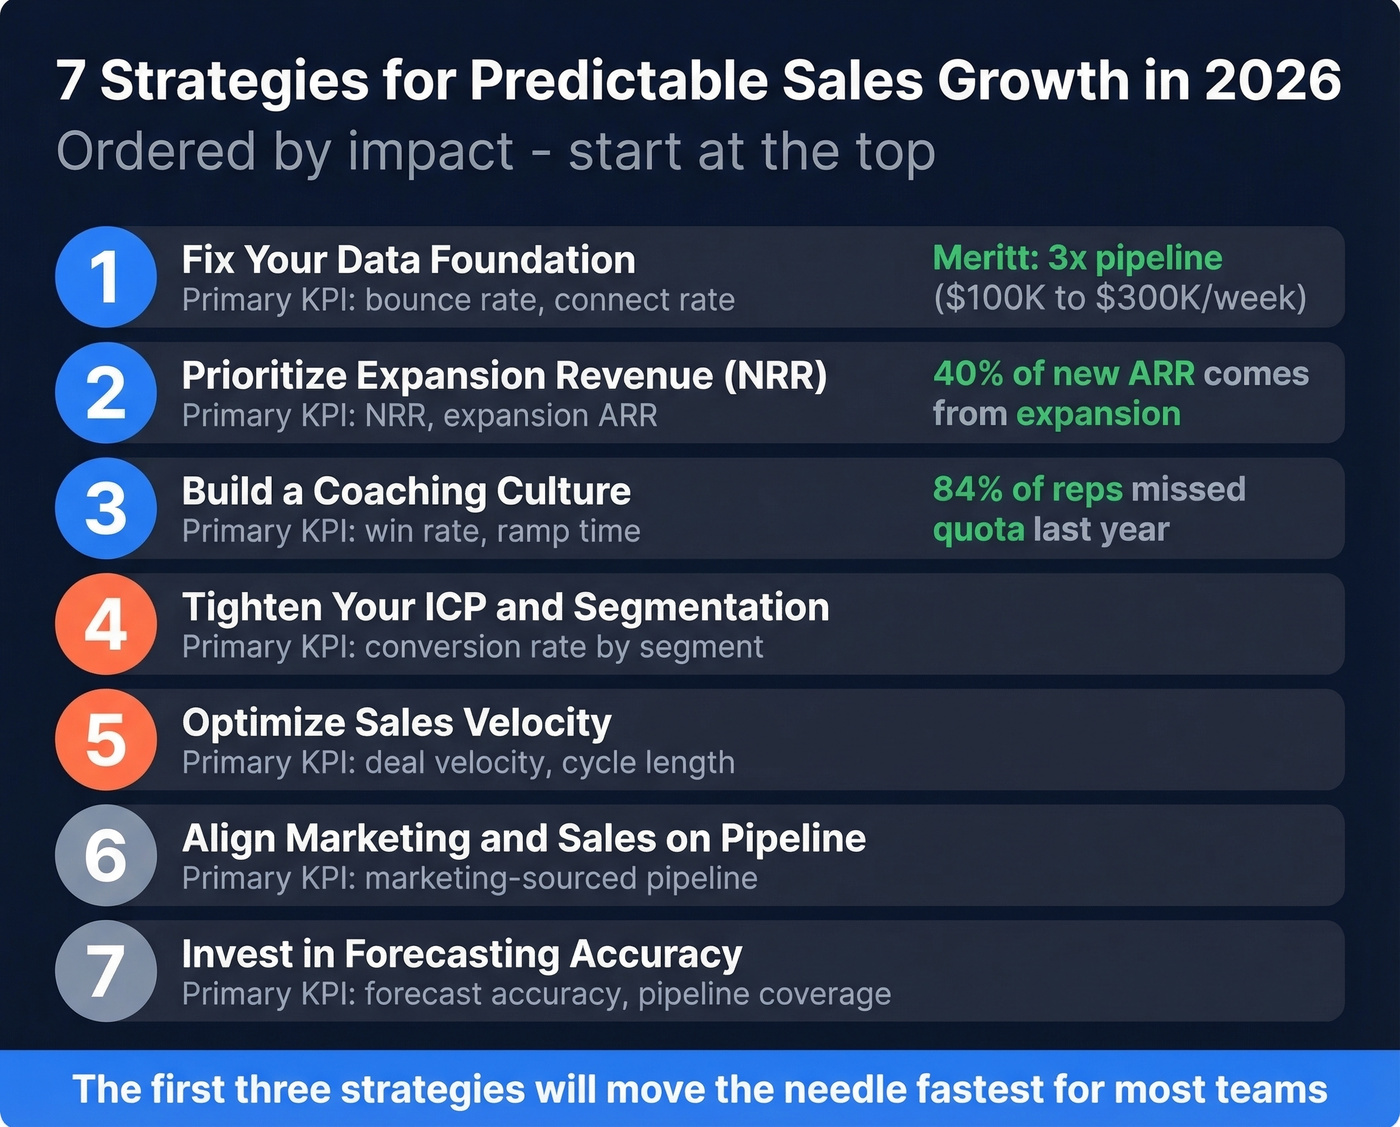
1. Fix Your Data Foundation
Bad contact data silently kills pipeline conversion. High bounce rates waste rep hours on dead-end outreach and damage your domain reputation in the process. When 84% of sales reps didn't meet quota last year, you can't afford to lose conversations to preventable data issues.
We've seen this pattern play out dozens of times: a team invests in better messaging, better sequences, better coaching - and the numbers barely move because 30% of their emails are bouncing. Prospeo's 98% email accuracy and 7-day data refresh cycle catch this problem at the source. Meritt tripled their weekly pipeline from $100K to $300K after switching - their bounce rate dropped from 35% to under 4%. That's not a marginal improvement. That's a different business.
Primary KPI: bounce rate, connect rate
The article makes it clear: sustainable sales growth requires leading indicators, not just lagging metrics. Prospeo's intent data tracks 15,000 topics via Bombora so you reach buyers already in-market - layered with 30+ filters for job changes, headcount growth, and technographics. One customer tripled pipeline from $100K to $300K/week while cutting bounce rates from 35% to under 4%.
Stop guessing who's ready to buy. Let intent signals drive your pipeline.
2. Prioritize Expansion Revenue (NRR)
Acquiring new customers costs more every year. Expanding existing ones doesn't.
Do this if: Your NRR is below 105%, your CAC ratio is above $2.00, or more than 70% of new ARR comes from new logos.
Skip this if: You're pre-$1M ARR and still building your initial customer base. Land first, expand later.
The playbook for expansion revenue has three parts. First, build intentional handoffs between sales and customer success so no account falls into a coverage gap. Second, document value stories at every renewal touchpoint - customers expand when they can articulate ROI to their own leadership. Third, restructure compensation to reward expansion, not just new logos. If your AEs earn 8% on new business and 0% on upsells, guess where they'll spend their time.
Primary KPI: NRR, expansion ARR as % of total
3. Build a Coaching-First Culture
Here's the thing: you don't scale revenue by becoming a better closer. You scale it by building closers. Metrics-obsessed management creates reps who game dashboards. Coaching-first cultures create reps who win deals.
In practice, this means replacing half your pipeline review meetings with deal coaching sessions. Focus on skill progression and qualification rigor, not just activity volume. Track coaching completion alongside quota attainment - the correlation will surprise you.
Primary KPI: quota attainment, win rate
4. Shorten Your Sales Cycle
28% of prospects back out because the sales process takes too long. Every unnecessary step - the extra demo, the internal review that adds a week, the proposal that sits in legal for 10 days - is a leak in your conversion funnel.
Quick checklist for cycle reduction:
- Map your current cycle stage by stage and identify where deals stall longest
- Build pre-approved proposal templates that skip legal review for deals under a set threshold
- Offer async demos for early-stage prospects who aren't ready for a live call
- Assign executive sponsors who can accelerate procurement on strategic deals
- Set SLAs for internal handoffs - no stage should add more than 3 business days
A 20% reduction in cycle time often produces more revenue than a 20% increase in pipeline. That's the highest-ROI fix most teams ignore.
Primary KPI: sales cycle length, stage-to-stage conversion
5. Diversify Your Channels
One Reddit thread captured a pattern we see constantly: a technical founder built a strong business on referrals, then watched inbound dry up overnight. Lead gen agencies quoted $20-30K - completely out of reach. Single-channel dependency is a growth ceiling.
Pandora's 13% growth was driven partly by pushing ecommerce to 27% of total revenue - a deliberate channel diversification play. For B2B teams, the equivalent is building parallel motions across outbound prospecting, content-driven inbound, partnerships, and community. No single channel should represent more than 40% of your pipeline.
Primary KPI: pipeline by source, channel conversion rate
6. Align Sales and Operations Capacity
A manufacturing sales engineer shared a painful story on Reddit: their $15M business pushed hard for growth, but on-time delivery dropped below 50%. Orders were taking twice the quoted lead time. Employees burned out. They were literally selling more than they could deliver.
Growth without capacity planning creates self-inflicted pipeline failure. Before setting aggressive targets, stress-test your operations: can quoting keep up? Can delivery fulfill? Can onboarding absorb the volume? If the answer is no, fix capacity first. Selling more into a broken fulfillment engine just accelerates customer churn.
Primary KPI: on-time delivery, customer onboarding time
7. Iterate Your Playbook Monthly
Most teams treat their playbook as a static document that gets updated annually - if ever. That's a problem. Markets shift quarterly, buyer behavior changes, and new competitors emerge. A playbook from January is stale by April.
Build a monthly review cadence: what objections are new? Which talk tracks are converting? Where are deals dying? Run scenario planning against three conditions - flat growth, contraction, and rapid expansion - so you aren't scrambling when the market shifts. Highspot's framework connects CRM hygiene to follow-up rates, coaching to quota attainment, and content to influenced revenue.
Primary KPI: win rate trend, forecast accuracy
Early Warning Signs - Don't Wait for the Quarterly Review
- Win rates stagnant or declining for 2+ months
- Sales cycle length creeping up without a clear cause
- Average deal size shrinking quarter over quarter
- Consistent forecast misses for 3+ periods
- New objections appearing that your talk tracks don't address
If you're seeing two or more of these simultaneously, your playbook needs surgery, not a tune-up.
How AI Changes Revenue Acceleration
AI in sales is simultaneously overpromised by vendors and underutilized by teams that implement it correctly.
Bain's 2025 Technology Report found early AI successes showing 30%+ improvement in win rates. Sellers currently spend roughly 25% of their time actually selling - AI can absorb the surrounding admin work and double that selling time. 81% of sales teams are already using AI in some capacity, with 41% running fully implemented workflows.
But only 25% of leaders who invested in AI tools over the past three years have seen expected ROI. Bain's core warning is worth memorizing: automating existing processes yields only "micro-productivity." Real gains require end-to-end process redesign, data cleanup, governance, and behavior change.
Let's be honest: most teams shouldn't buy AI sales tools in 2026. They should spend that budget on cleaning their CRM data, documenting their sales process, and training reps on qualification. AI amplifies what you already have. If your process is broken, AI will break it faster. If your data is dirty, AI will make worse decisions at scale. The teams seeing 30%+ win rate improvements started by fixing their fundamentals - clean data, clear qualification criteria, documented processes - and then layered AI on top. That sequence matters.
Common Mistakes That Stall Growth
Growing Without Capacity
That manufacturing example bears repeating: on-time delivery under 50%, orders taking 2x quoted lead time, employees burning out. The company was "growing" on paper while destroying customer relationships. Revenue targets must be stress-tested against operational reality.
Chasing Revenue, Ignoring Profit
Revenue up 20%, costs up 35%. That's not growth - it's a slow-motion collapse. Every growth initiative should have a margin impact estimate attached. If you can't model the unit economics, don't scale it.
Running a Static Playbook
Markets shift quarterly. Buyer behavior changes. New competitors emerge. Monthly iteration isn't optional - it's the minimum cadence for any team serious about sustained performance.
Ignoring Data Quality
Bad data is the silent growth killer. If reps are calling disconnected numbers and emailing invalid addresses, no strategy will save you. Verify before you send. High bounce rates damage your domain reputation and waste rep hours on contacts that'll never convert.
Trusting Vanity Metrics
Pipeline created, demos booked, emails sent - these feel productive but don't guarantee revenue. Track conversion rates at every stage. A team booking 200 demos with a 3% close rate has a conversion problem, not a pipeline problem.
How to Track Sales Growth Effectively
Tracking isn't about running the formula once a quarter. It's about building a system that surfaces problems before they become crises.
Start with a unified data foundation. Your CRM, marketing platform, and finance system need to feed a single source of truth. Teams with centralized dashboards are nearly 3x more likely to establish long-term tracking habits versus those tracking metrics in scattered spreadsheets. Given that 65% of revenue leaders cite unreliable forecast data as a major source of revenue loss, getting this foundation right isn't optional.
The cadence that works for our team and most of the RevOps leaders we've talked to:
- Weekly: Pipeline review - new opportunities, stage movement, at-risk deals
- Monthly: Growth rate calculation for both MoM and YoY, conversion rates by stage, leading indicator trends
- Quarterly: CAGR check, NRR and expansion revenue analysis, CAC ratio review, playbook iteration
Balance leading indicators like qualified leads, pipeline created, and demos scheduled with lagging indicators like revenue, win rate, and quota attainment. The leading indicators tell you where you're headed. The lagging indicators confirm whether you arrived.
FAQ
How do you calculate year-over-year sales growth?
Use the formula: ((Current Year Revenue - Previous Year Revenue) / Previous Year Revenue) x 100. If you closed $2M in 2025 and $2.6M in 2026, your YoY growth is 30%. For multi-year comparisons, use CAGR to smooth out annual fluctuations.
What's a good sales growth rate for a startup?
For SaaS startups under $1M ARR, 68% annual growth is the benchmark. Above $1M ARR, target 45%. Non-SaaS startups should aim for 30-50% in early stages, adjusting for industry - 15% in manufacturing is outstanding, while the same number in early-stage SaaS signals a problem.
Why is my growth rate declining despite more pipeline?
More pipeline with declining revenue usually means a conversion problem. Common culprits: longer sales cycles, lower win rates, shrinking deal sizes, or bad contact data causing reps to waste time on dead leads. Check your bounce rate first - if it's above 5%, pipeline is leaking before conversations even start.
Does AI actually improve sales performance?
Early data shows 30%+ win rate improvement in successful implementations, and AI can double the time reps spend selling. But 75% of AI investments underperform because teams automate broken processes. Clean your CRM data and document your sales process before layering AI on top.
How can bad data hurt my revenue targets?
Invalid emails and disconnected phone numbers waste 20-30% of rep selling time and damage sender reputation. Meritt cut their bounce rate from 35% to under 4% and tripled weekly pipeline to $300K after switching to verified contact data - that's the kind of impact clean data has on revenue trajectory.