Sales Management Metrics That Actually Drive Results
It's week 8 of the quarter. Your dashboard shows 4.2x pipeline coverage, win rates holding steady, and activity numbers that look healthy. Then you pull the forecast and realize half those "qualified" opportunities haven't had a meaningful conversation in three weeks. The dashboard isn't lying - your sales management metrics are just measuring the wrong things.
A joint study by Vantage Point Performance and the Sales Education Foundation identified 306 metrics that sales leaders consider "keys to effective sales management." Nearly 80% of those can only be influenced indirectly. Your team is drowning in data that looks actionable but isn't.
The Manageability Problem
This 306-metric finding isn't just trivia - it's the organizing principle for everything that follows. Vantage Point's core question was simple: can we actually manage this number?
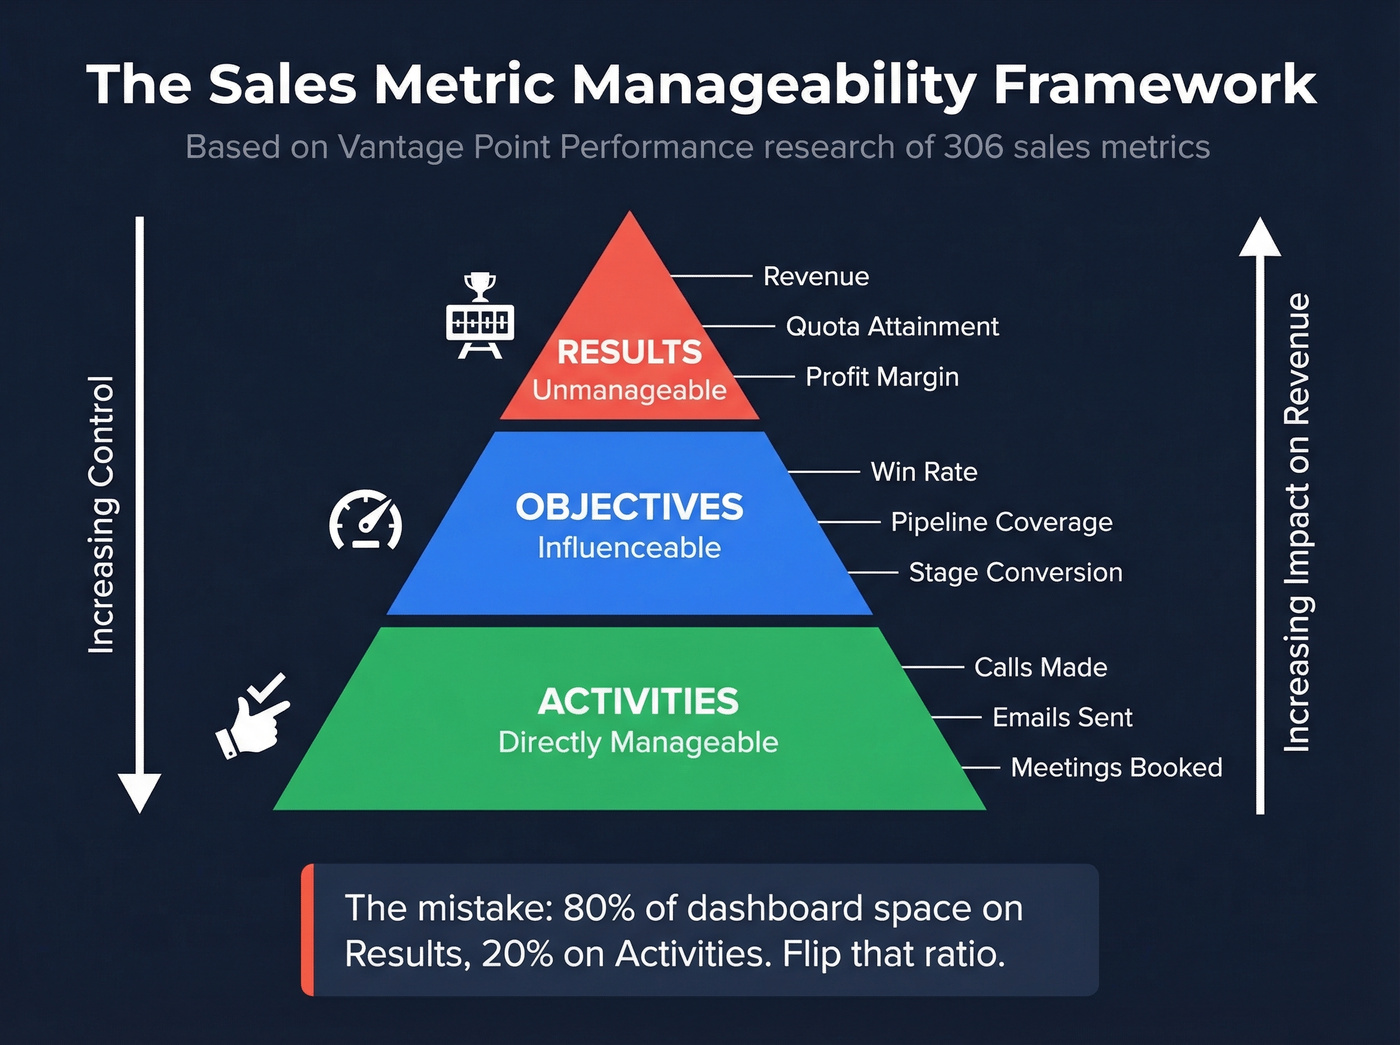
Their answer sorts every sales metric into three tiers. At the base, you've got Activities - calls made, emails sent, accounts assigned per rep. These are directly manageable. A manager can reassign accounts, set call targets, and coach reps on meeting prep. You control these.
In the middle sit Objectives - pipeline coverage, win rates, stage conversion. These are influenceable but not directly controllable. You can't mandate a higher win rate, but you can coach deal strategy, improve qualification, and tighten your ICP. The levers are indirect but real.
At the top are Results - revenue, quota attainment, profit margin. These are the scoreboard. They tell you how you did, not what to do next. Revenue per rep is fundamentally unmanageable; you can't walk over to someone's desk and turn a dial that increases their number.
The mistake most teams make is spending 80% of their dashboard real estate on the top tier - the metrics they can't directly control - and 20% on the activities and objectives where coaching actually changes outcomes. Flip that ratio.
What Top Teams Prioritize
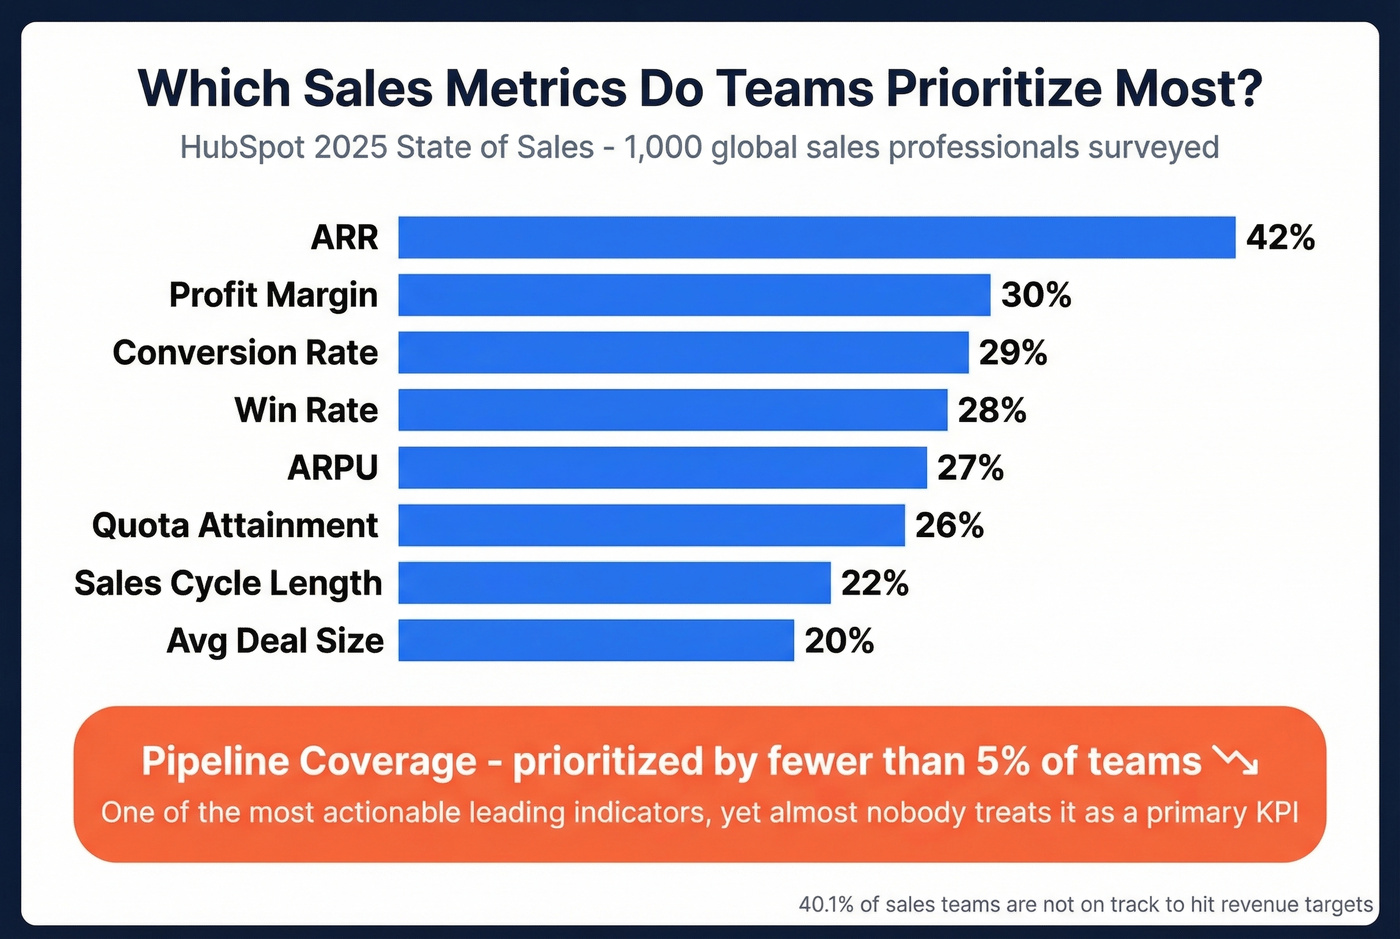
HubSpot's 2025 State of Sales report surveyed 1,000 global sales pros and asked which metrics teams consider most important. The rankings are revealing - not for what's at the top, but for what's near the bottom.
| Metric | % Who Prioritize It |
|---|---|
| ARR | 42% |
| Profit margin | 30% |
| Conversion rate | 29% |
| Win rate | 28% |
| ARPU | 27% |
| Quota attainment | 26% |
| Sales cycle length | 22% |
| Avg deal size | 20% |
ARR dominates because it's the metric boards and investors care about. But fewer than 5% of respondents prioritize pipeline coverage or lead scoring as top success metrics. That's a massive gap. Pipeline coverage is one of the most actionable leading indicators available, and almost nobody's treating it as a primary KPI.
40.1% of sales teams aren't on track to hit revenue targets. Many of those teams are staring at lagging metrics wondering what went wrong instead of watching leading indicators that could've flagged the problem weeks earlier.
The KPIs That Actually Matter
The table below maps to the manageability framework. Pin it somewhere your team can see it.
| Metric | Type | Formula | Benchmark | Cadence |
|---|---|---|---|---|
| Calls/emails | Activity - Manageable | Count | Varies by role | Daily |
| Meetings booked | Activity - Manageable | Count | 8-15/rep/week | Daily |
| Pipeline value | Pipeline - Influenceable | Sum of open opps | 3-5x target | Weekly |
| Pipeline velocity | Pipeline - Influenceable | (Opps x Win% x ADS) / Cycle | Varies | Weekly |
| Forecast accuracy | Pipeline - Influenceable | Forecast / Actual | 90%+ (only 7% of orgs) | Monthly |
| Win rate | Conversion - Influenceable | Won / Total opps | 15-40% by segment | Weekly |
| Stage conversion | Conversion - Influenceable | Stage N / Stage N-1 | 30-50% per stage | Weekly |
| ARR/MRR | Outcome - Unmanageable | Recurring revenue | Company-specific | Monthly |
| Quota attainment | Outcome - Unmanageable | Actual / Quota | 60-70% of reps | Monthly |
| CAC | Outcome - Unmanageable | S&M cost / New customers | ~12mo payback | Quarterly |
| Churn rate | Retention - Lagging | Lost / Total customers | ~5% annual (SaaS) | Quarterly |
| NRR | Retention - Lagging | (Start+Exp-Churn) / Start | >110% | Quarterly |
Activity Metrics (Leading)
Calls made, emails sent, meetings booked, proposals delivered. These are the only metrics a manager can directly control - you set the targets, you coach the execution, you see results the same day.
Here's the vanity metric trap, though: 96% of prospects research before engaging a rep, and 71% prefer independent research over talking to sales. Raw activity volume without conversion context is meaningless. Tracking "150 calls/day" tells you nothing if those calls aren't generating qualified meetings. Always pair activity metrics with their downstream conversion rate.
If your team tracks more than 10 metrics in weekly reviews, they're effectively coaching none of them. Pick seven. Master those. Add more only when you've exhausted the coaching value of what you have.
Pipeline Metrics (Leading)
Pipeline coverage is the single most important leading indicator most teams under-prioritize. The formula: qualified pipeline divided by revenue target for the period. For new logo deals, aim for 3-5x quarterly coverage. For expansion revenue, 2-3x is sufficient because close rates are higher. Below 3x on new business isn't a yellow flag - it's a forecasting emergency.
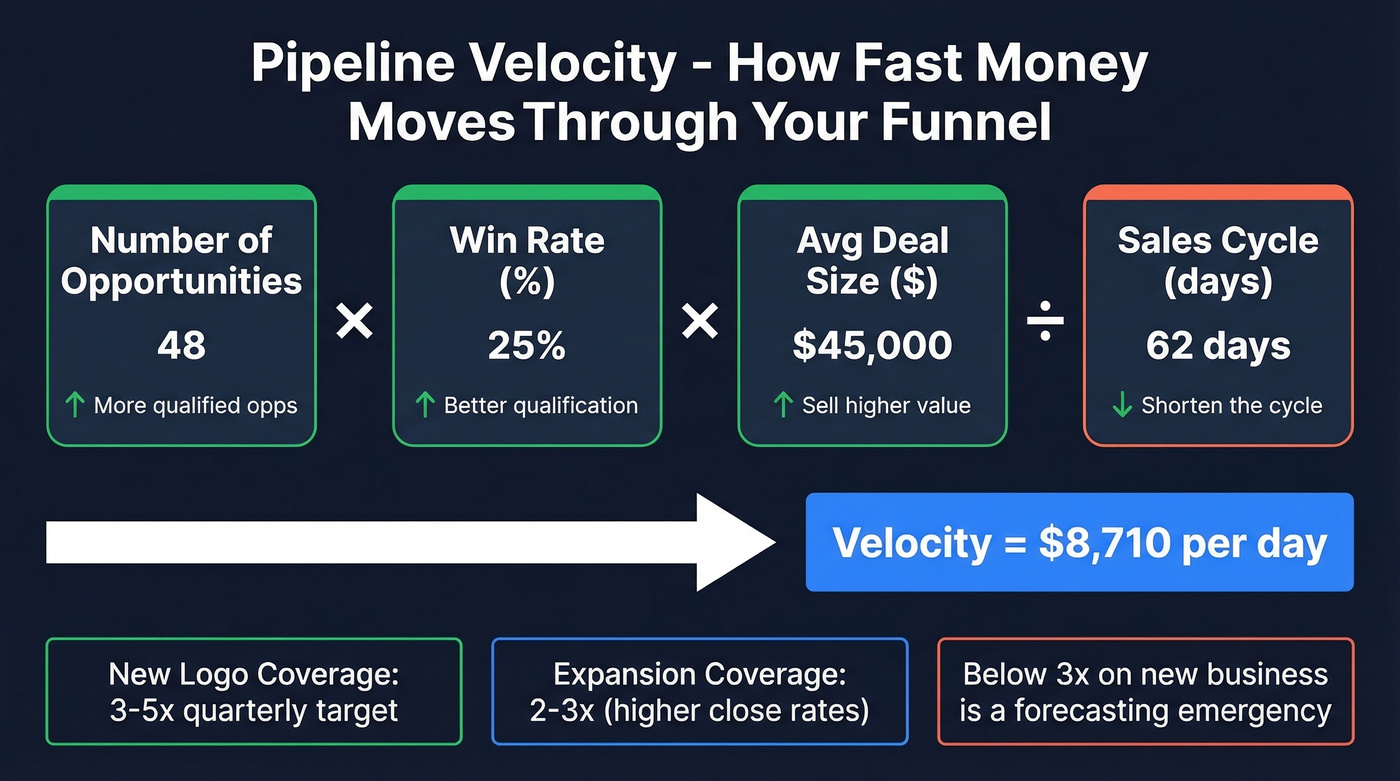
Pipeline velocity tells you how fast money moves through your funnel. With 81% of revenue leaders saying deals are more complex than ever, velocity becomes the metric that catches slowdowns before they become missed quarters. When velocity drops, something upstream broke.
Forecast accuracy is where most teams embarrass themselves. Only 7% of sales orgs achieve 90%+ forecast accuracy. Track deal slippage - opportunities that push from one quarter to the next - as a leading indicator of forecast drift. If your slippage rate exceeds 15%, your pipeline definitions need work before your forecasting model does.
Conversion Metrics (Bridge)
Win rate = deals won divided by total opportunities evaluated. Benchmarks vary wildly by segment: enterprise teams typically run 15-25%, mid-market 20-35%, and SMB 25-40%. Your mileage depends on deal complexity, competitive density, and how tightly you qualify.
Stage conversion rates are where coaching happens. If reps convert well from demo to proposal but collapse from proposal to close, that's a negotiation problem, not a pipeline problem. We've seen teams waste months optimizing top-of-funnel when the real leak was two stages deeper. Break it down: SQL to Opportunity, Opportunity to Proposal, Proposal to Closed Won. Each transition tells a different story.
Lead response time is the conversion metric most teams ignore. The data is unambiguous: responding fast versus responding late creates dramatically higher contact rates. If you're not tracking time-to-first-touch on inbound leads, start today.
Outcome Metrics (Lagging)
ARR is the #1 prioritized metric at 42% - and it should be. It's the scoreboard. But reviewing ARR daily is like checking the final score at halftime.
Quota attainment matters for comp plans and headcount decisions. In a healthy org, 60-70% of reps typically hit quota. Sales cycle length deserves attention here too - a creeping cycle is often the first sign of market friction or qualification drift, and it's easy to miss if you only review it quarterly. CAC and CLV belong in quarterly reviews, not weekly ones.
Retention Metrics (Lagging)
Churn rate and net revenue retention tell you whether your growth is real or just a leaky bucket filling faster than it drains. Target ~5% annual churn for SaaS; NRR above 110% means your existing customers are growing faster than you're losing them.
By the time you see churn in the numbers, the customer is already gone. The leading indicators are usage pattern drops, gaps in CS touchpoints, and declining NPS scores. Track those weekly in your CS dashboard, not the churn number itself.
Pipeline coverage below 3x is a forecasting emergency - but only if your pipeline is real. Bad contact data inflates pipeline with deals that never had a chance. Prospeo's 98% email accuracy and 7-day data refresh mean every opportunity in your CRM is built on verified contacts, not stale records.
Stop coaching pipeline metrics corrupted by bad data.
What to Stop Tracking
The problem isn't too few metrics. It's too many of the wrong ones.
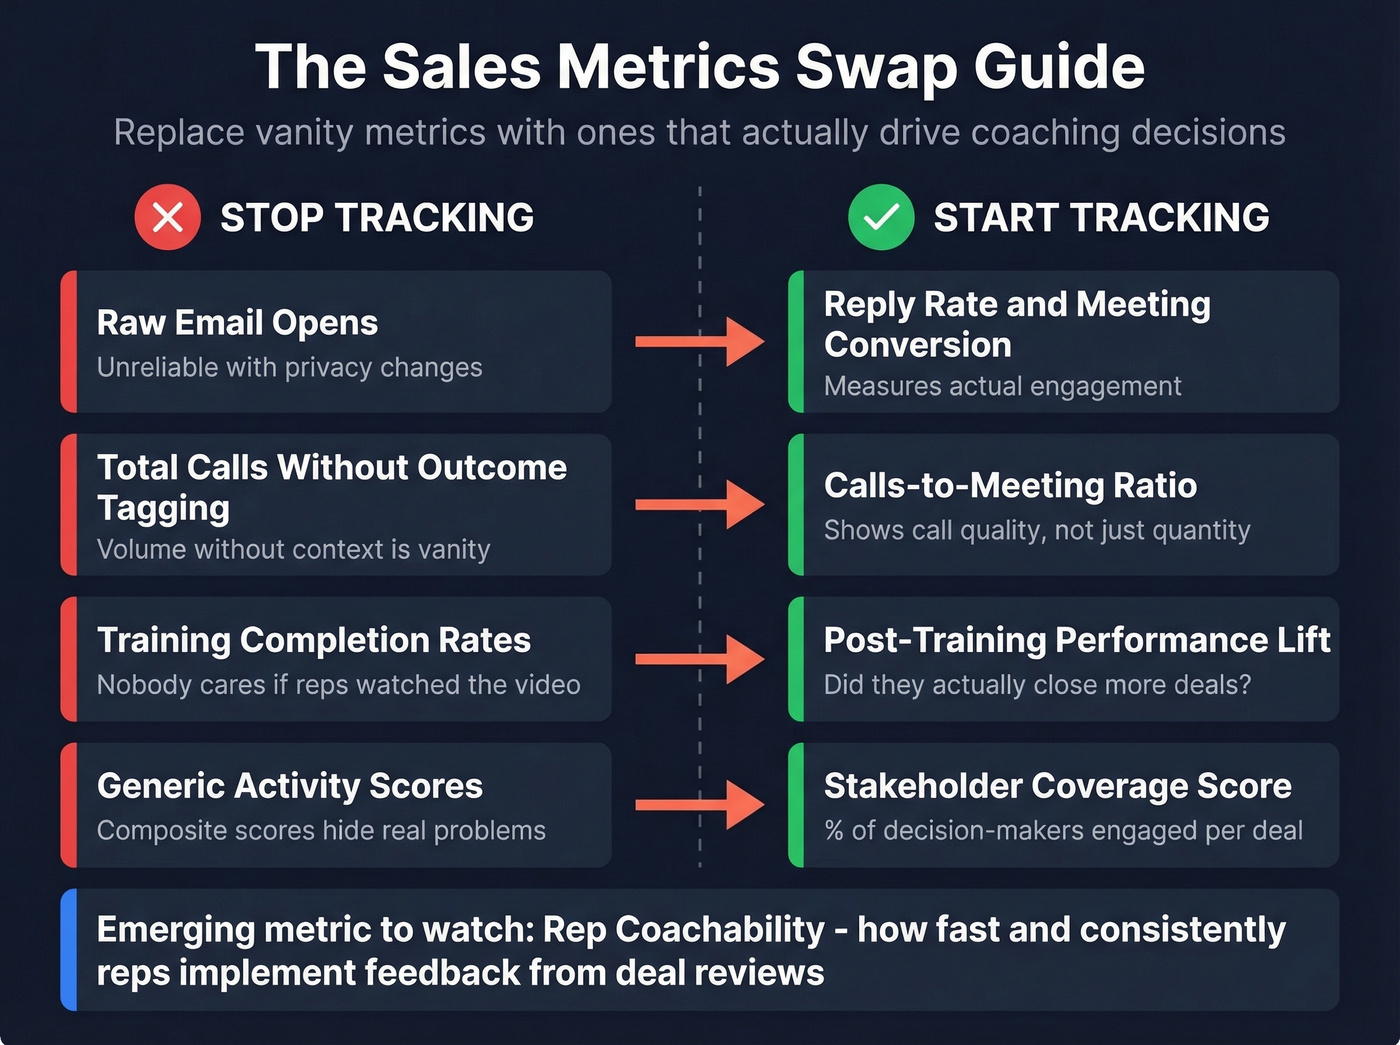
- Raw email opens - Replace with reply rate and meeting conversion. Opens are unreliable with privacy changes.
- Total calls without outcome tagging - Replace with calls-to-meeting ratio. Volume without context is vanity.
- Training completion rates - Replace with post-training performance lift. Nobody cares if reps watched the video; care if they closed more.
- Generic "activity scores" - Replace with stakeholder coverage score - the percentage of decision-makers engaged per deal - and decision-maker attendance rate in meetings.
One emerging metric worth watching: rep coachability, measured as the speed and consistency with which reps implement feedback from deal reviews. We've started tracking this informally on our own team, and it's a better predictor of ramp success than any activity number we've tried.
Every metric you remove from the dashboard is a conversation you don't have to have in a pipeline review. That's time back for coaching on the metrics that move revenue.
The Data Quality Tax
Let's go back to that week 8 scenario. Your dashboard says 4.2x pipeline coverage. But 30% of the contacts in those opportunities have bounced emails, disconnected phone numbers, or left the company months ago. Your real coverage is closer to 2.1x - and nobody knows it.
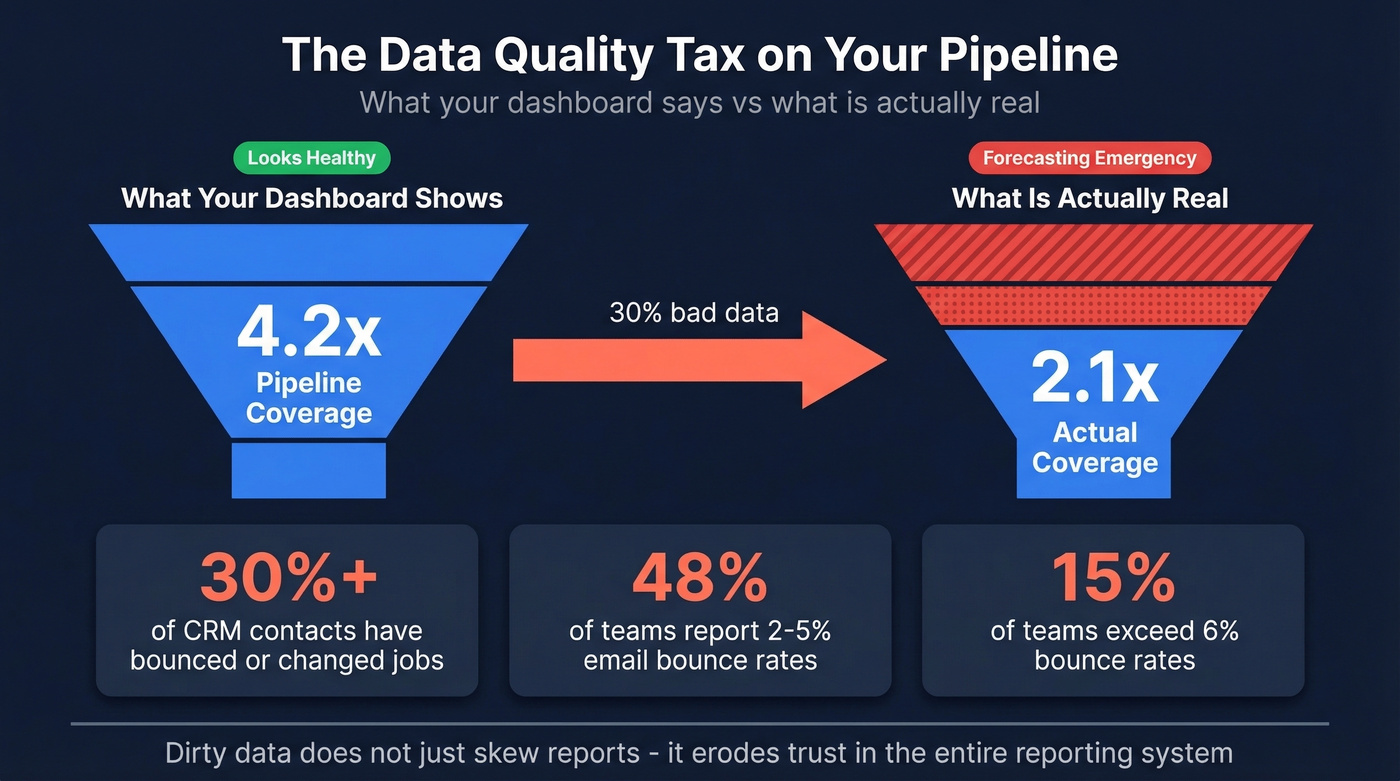
This is the data quality tax, and it silently corrupts every downstream metric. Win rates look low because reps can't reach decision-makers. Activity numbers look healthy because reps are "working" dead contacts. Forecast accuracy craters because half the pipeline is phantom.
Dirty data doesn't just skew reports - it erodes trust in the entire reporting system.

Here's a coaching story that illustrates the problem: your top rep's 35% win rate might look like pure skill until you realize they're cherry-picking the cleanest data in the CRM. Your bottom rep's 12% win rate might be a data quality problem, not a coaching problem. We've audited CRM databases where 30%+ of contacts had bounced or changed jobs, and the sales team had no idea.
48% of teams report 2-5% email bounce rates, and 15% exceed 6%. Those numbers compound fast across a pipeline. Prospeo addresses this at the source - 98% email accuracy on a 7-day refresh cycle means the contacts feeding your metrics are actually reachable. Snyk's team saw this firsthand: bounce rates dropped from 35-40% to under 5%, and AE-sourced pipeline jumped 180% once reps stopped wasting cycles on dead data.
Building Your Review Cadence
Knowing what to track is half the battle. Knowing when to look is the other half. Reps spend only 28% of their time on actual selling - don't make metric reviews eat into what's left.
| Cadence | Metrics | Who Owns It | Action |
|---|---|---|---|
| Daily | Rep activity: calls, emails, meetings | Reps self-correct; managers spot-coach | Same-day course correction |
| Weekly | Win rate trend, stage conversion, pipeline movement | Managers in 1:1s; reps prep deal updates | Deal-level coaching, qualification review |
| Monthly | Revenue, quota attainment, avg deal size, cycle length | Sales leadership; VPs review team rollups | Forecast adjustment, resource allocation |
| Quarterly | CAC, CLV, NRR, forecast accuracy, data source audit | RevOps + leadership jointly | Strategic planning, tool evaluation |
Reps should own daily activity self-correction - they shouldn't need a manager to tell them they're behind on meetings booked. Managers own the weekly coaching layer, focused on deal quality and conversion. VPs and RevOps own the monthly and quarterly strategic metrics. If everyone's looking at everything, nobody's accountable for anything.
That quarterly data audit matters more than most teams realize. Run an enrichment pass on your CRM contacts to catch decay before it corrupts next quarter's pipeline numbers. Prospeo's enrichment returns 50+ data points per contact at a 92% match rate, which turns a quarterly audit from a fire drill into a routine check.
Lead response time collapses when reps waste hours hunting for valid emails and direct dials. Prospeo gives your team 125M+ verified mobiles with a 30% pickup rate and 300M+ profiles - so activity metrics actually convert to meetings booked.
Turn your activity metrics into revenue metrics at $0.01 per lead.
FAQ
What's the difference between sales metrics and sales KPIs?
Sales metrics are any measurable data point about sales activity or outcomes - there are hundreds. KPIs are the strategic subset you've tied to specific goals. Every KPI is a metric, but most metrics aren't KPIs. Pick 5-8 KPIs for your dashboard; track the rest only when diagnosing a specific problem.
How many sales management metrics should a manager track weekly?
Seven to eight, max. Focus on leading and influenceable metrics - pipeline coverage, win rate trends, stage conversion rates - in weekly 1:1s. Save lagging outcome metrics like ARR, quota attainment, and CAC for monthly or quarterly cadences where they're actually actionable.
What's a good pipeline coverage ratio?
For new logo deals, aim for 3-5x quarterly coverage. For expansion revenue, 2-3x works because close rates are significantly higher. Below 3x on new business is a forecasting emergency. Coverage ratios also depend on data quality - if contacts in your pipeline have bounced or changed jobs, your real coverage is much lower than the dashboard suggests.
How do you improve forecast accuracy?
Start by tracking deal slippage - opportunities that push from one quarter to the next. Only 7% of sales orgs achieve 90%+ forecast accuracy, and the biggest culprit is phantom pipeline built on stale or unqualified deals. Enforce stage-exit criteria, require recent stakeholder engagement for late-stage deals, and audit contact data quarterly.