Sales Metrics vs KPIs: What to Track in 2026
Your VP of Sales asks, "What are your three KPIs?" and the room goes quiet. Somebody mumbles "revenue." Another says "calls." A third starts listing every column in the CRM. This scene plays out constantly - a Reddit poster once admitted they'd been in sales for years and genuinely didn't know what KPIs were when asked in an interview. The confusion between sales metrics and KPIs isn't a knowledge gap. It's a framing problem, and once you fix the frame, the answer takes 30 seconds.
The Short Version
Metrics are everything you measure. Calls, emails, pipeline value, deal size, cycle length - if it's a number in your CRM, it's a metric. KPIs are the 2-3 metrics you've deliberately chosen because they show whether you're winning or losing against a specific goal.
Every role needs different KPIs. An SDR's shouldn't look anything like a CRO's. Cap yours at 3 per role, track everything else as supporting metrics, and keep reading for the formulas and benchmarks.
What's the Real Difference?
Think of it as a three-tier hierarchy, which Livespace's research lays out well. At the bottom you've got measures - raw counts like number of deals won or total calls made. One level up, metrics interpret those measures into something meaningful, like win rate or average deal size. At the top, KPIs are the metrics you've consciously selected because they map to a strategic goal.
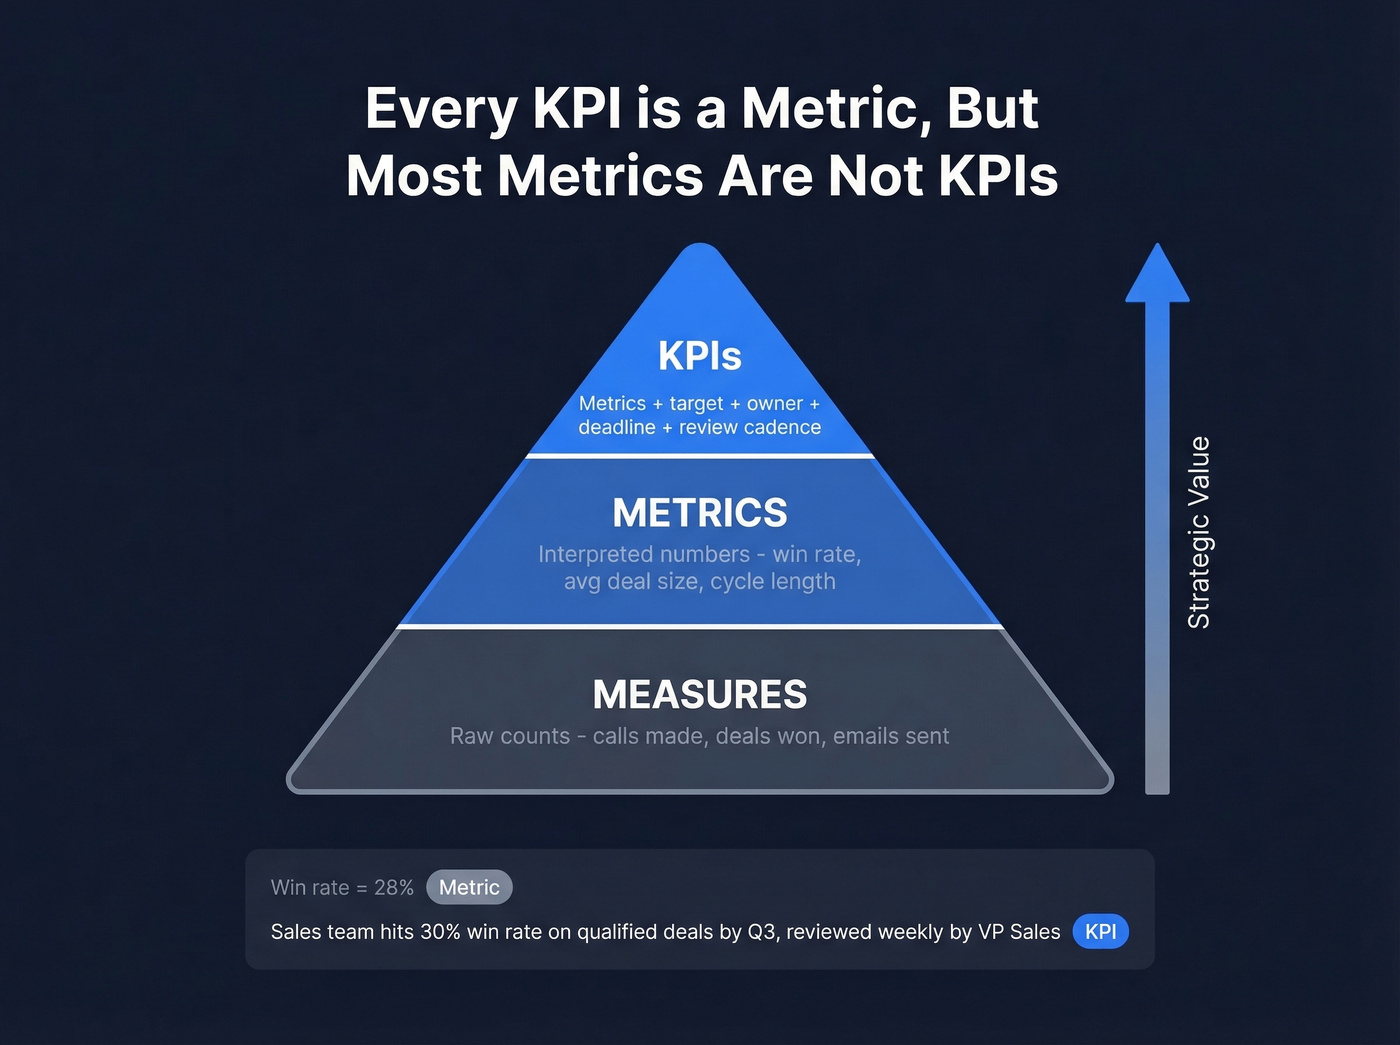
Every KPI is a metric, but most metrics aren't KPIs. That's the whole distinction.
Here's how to turn any metric into a KPI: take a metric, add a target number, an owner, a review cadence, and a deadline. "Win rate" is a metric. "Sales team achieves 30% win rate on qualified deals by Q3, reviewed weekly by VP Sales" is a KPI.
The other frame worth internalizing is leading vs lagging. Leading indicators look forward - they're coaching levers you can pull right now like calls made, meetings booked, and emails sent. Lagging indicators look backward at results: revenue, quota attainment, win rate. A good KPI stack includes both, because lagging tells you what happened and leading tells you what to do about it.
| Example | Measure / Metric / KPI | Leading or Lagging |
|---|---|---|
| Calls made today | Measure | Leading |
| Emails sent this week | Measure | Leading |
| Call-to-conversation rate | Metric | Leading |
| Email open rate | Metric | Leading |
| Win rate (with target + owner) | KPI | Lagging |
| Pipeline coverage ratio (with target + owner) | KPI | Leading |
| Revenue closed (with target + owner) | KPI | Lagging |
| Deal slippage rate (with target + owner) | KPI | Lagging |
The bottom four only become KPIs when you attach a target, an owner, and a review cadence. Until then, they're just metrics sitting in a dashboard nobody checks.
Sales KPIs That Actually Matter
Seven KPIs worth considering for your stack. Not all seven - pick the ones that map to your goals.
Win Rate
Formula: (Deals Won / Total Closed Deals) x 100
20-30% is the benchmark for most B2B teams. Two nuances most guides skip: calculate this on qualified deals only - mixing in unqualified leads dilutes the signal. And decide whether you're measuring by date added to pipeline or by closing date, because they tell different stories about where your process breaks down.
Use this if you need a single number to evaluate sales effectiveness. Skip it if your team is pre-product-market-fit and deal volume is too low to be statistically meaningful.
Pipeline Coverage
Your pipeline looks healthy at $2M against a $500K quota. Then three deals slip, one goes dark, and suddenly you're scrambling.
Formula: Total Pipeline Value / Sales Quota
Benchmark: 3-4x quota coverage. If you're running at 2x, you're one bad month from missing the number. Garbage pipeline data makes this metric useless, so verify your contacts before trusting the number.
Sales Velocity
Formula: (Opportunities x Win Rate x Avg Deal Size) / Sales Cycle Length
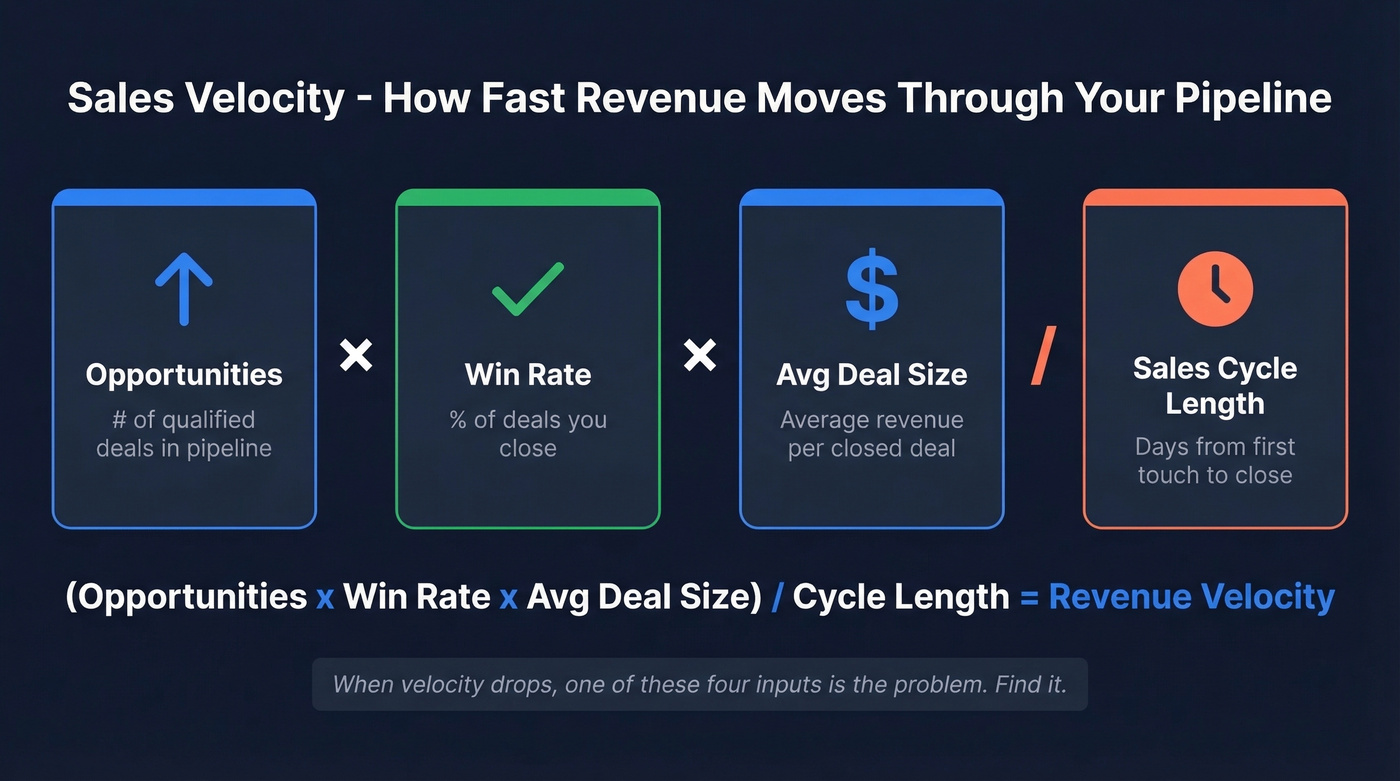
This is the compound KPI - it tells you how fast revenue moves through your pipeline. There's no single benchmark because it's unique to your business, but tracking it quarter-over-quarter reveals whether you're accelerating or stalling. When velocity drops, one of the four inputs is the culprit. Find it.
Sales Cycle Length
For most B2B sales teams, cycle length tends to run 3-6 months. Don't use this as a standalone KPI - it's more useful as an input to sales velocity. But if deals are stalling at a specific stage, cycle length by stage will show you exactly where.
Close Rate
Formula: Closed Won / Total Pipeline Opportunities x 100
Benchmark: 15-25%. This is win rate's cousin - where win rate focuses on qualified deals, close rate measures against your entire pipeline. Some teams prefer it because it's harder to game by disqualifying deals retroactively.
Deal Slippage
Above 20% is a red flag and usually means your forecast is unreliable.
Formula: (Deals past original close date / Total deals forecast) x 100
We've watched teams confidently present quarterly forecasts while a huge chunk of their pipeline had already slipped once. If you're a sales leader and you aren't tracking this, you're guessing.
Sales Efficiency Ratio
Formula: Total Sales Revenue / Total Sales Expenses
Benchmark: 3:1 or higher. Below 1:1, you're spending more to sell than you're earning. This is the KPI that matters when you're scaling and need to prove unit economics to the board. Here's the thing: if your average deal is under five figures, this number will tell you whether your sales motion is even viable before your pipeline metrics will.
Pipeline coverage means nothing when half your contacts bounce. Prospeo's 98% email accuracy and 7-day data refresh cycle keep your pipeline metrics honest - so win rate, velocity, and coverage actually reflect reality, not stale CRM data.
Stop tracking KPIs built on bad data. Start with verified contacts.
KPIs by Role
An SDR tracking win rate is measuring someone else's job. An AE tracking calls-per-day is measuring the wrong thing. Your performance indicators need to match the role's actual lever of control - and don't set them in a vacuum. Involve the reps who'll be measured by them.
| SDR/BDR | AE | Sales Leader | |
|---|---|---|---|
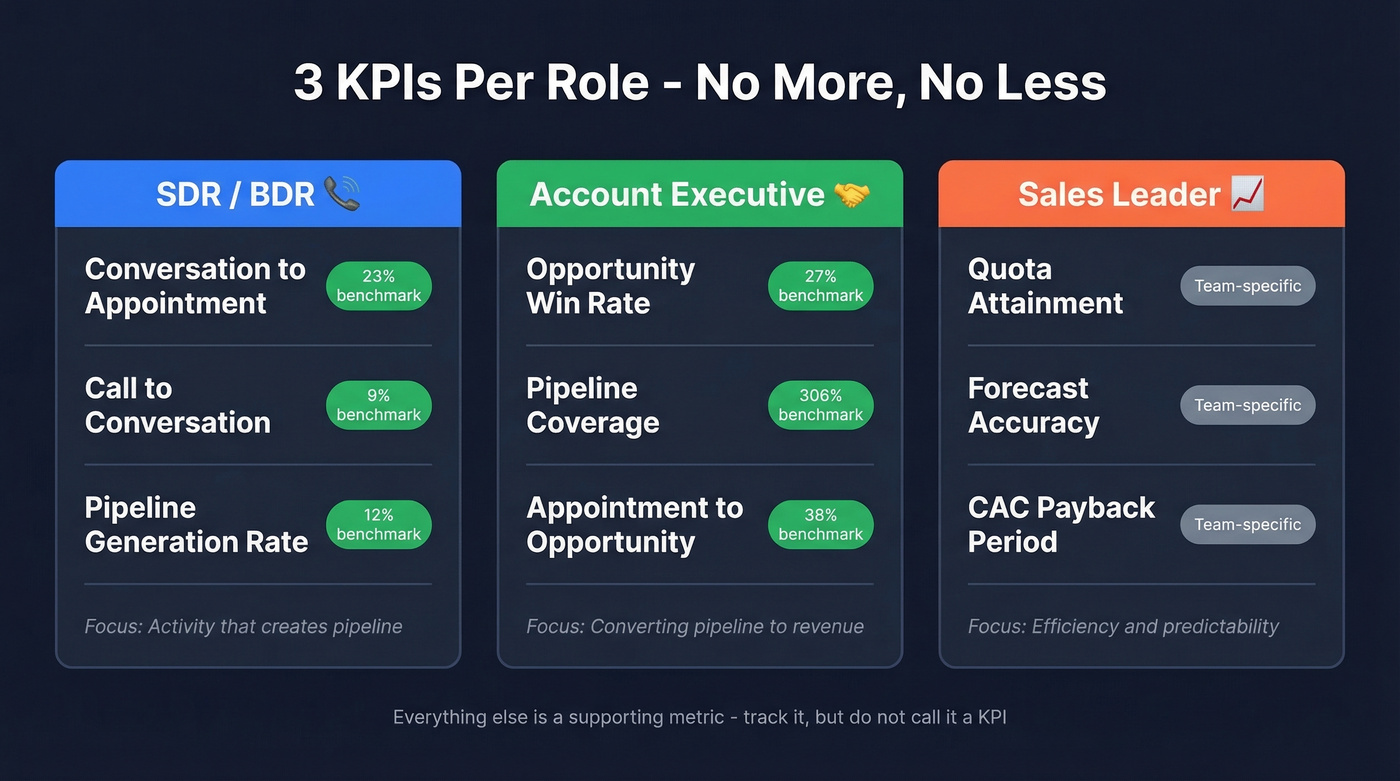
| KPI 1 | Conversation-to-appointment (23%) | Opportunity win rate (27%) | Quota attainment |
| KPI 2 | Call-to-conversation (9%) | Pipeline coverage (306%) | Forecast accuracy |
| KPI 3 | Pipeline generation rate (12%) | Appointment-to-opportunity (38%) | CAC payback period |
These benchmarks come from Ambition's role-based research - dated but still directionally useful as pre-2020 baselines. Your numbers will vary by segment, deal size, and motion. The structure holds: 3 KPIs per role, everything else is a supporting metric. For sales leaders, team turnover (target under 15%) is a strong supporting metric alongside CAC.
How to Pick Your KPIs
Outreach's framework nails this: work backward from revenue.
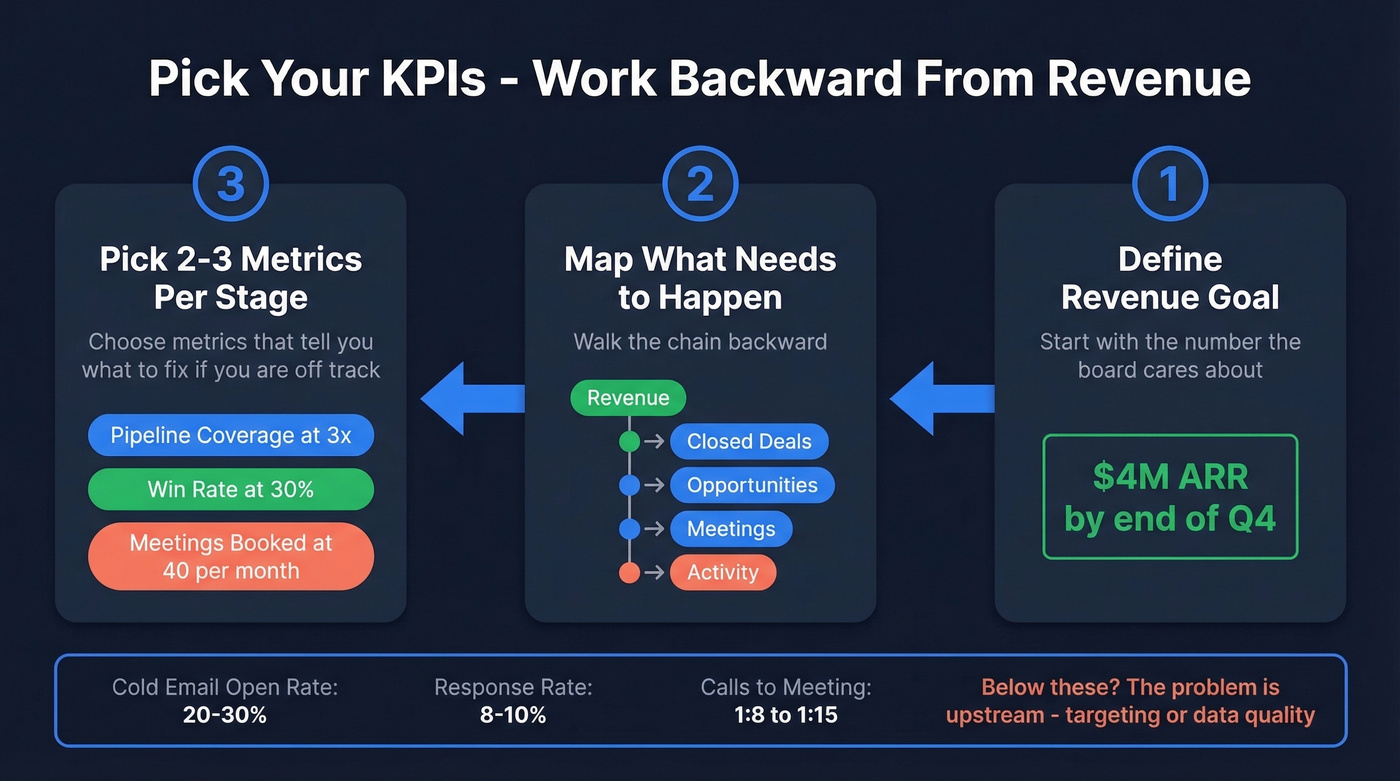
Step 1: Define your revenue goal. Start with the number the board cares about. Everything flows from here.
Step 2: Map what needs to happen. Revenue requires closed deals. Deals require opportunities. Opportunities require meetings. Meetings require activity. Walk the chain backward until you hit the inputs your team controls.
Step 3: Pick 2-3 metrics at each stage that tell you what to do next if you're off track. That's your KPI stack.
For outbound-heavy teams, here's what good looks like: cold email open rates run 20-30%, response rates average 8-10%, and calls-to-meeting ratios typically land between 1:8 and 1:15. If you're significantly below these, the problem is upstream of your KPIs - it's targeting or data quality.
Five KPI Mistakes That Kill Performance
1. Tracking 12+ "KPIs." That's a spreadsheet, not a strategy. If everything is a KPI, nothing is. We've seen dashboards with 20+ metrics all labeled "KPI" - nobody looks at them, nobody acts on them.
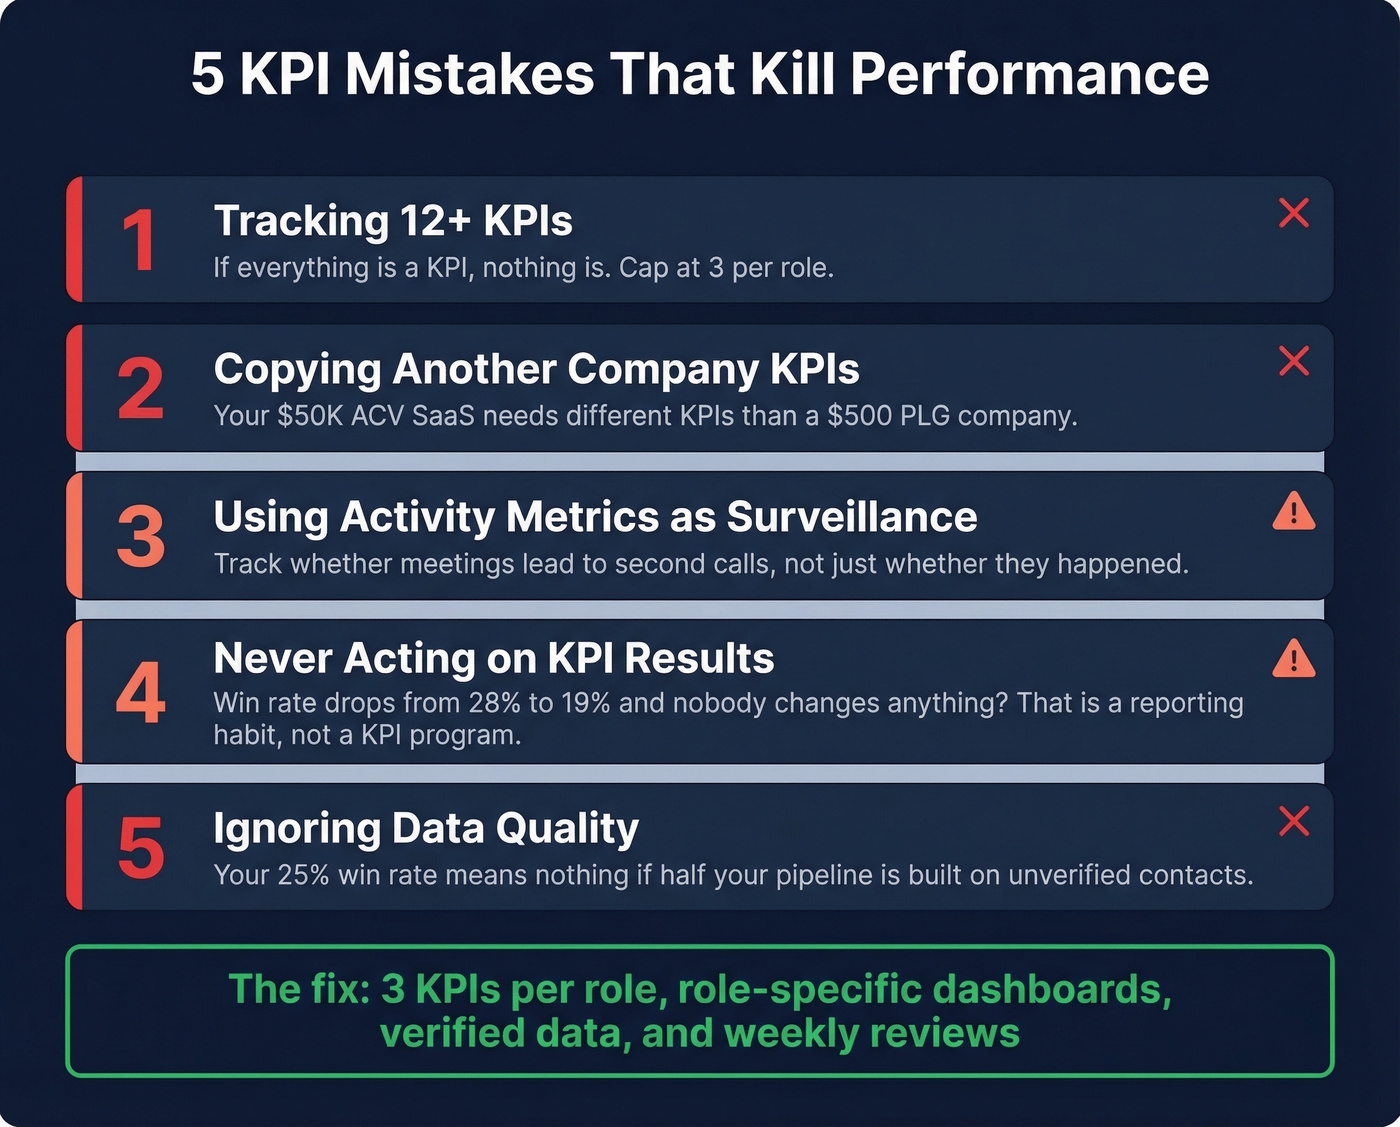
2. Copying another company's KPIs. Your Series B SaaS company selling $50K deals doesn't need the same KPIs as a PLG company with $500 ACVs. Context matters more than best practices.
3. Using activity metrics as surveillance. A Reddit thread on the "tyranny of metrics" in sales nailed this: when managers obsess over calls-per-day without quality context, reps game the system. Activity KPIs should be coaching levers, not compliance tools. Track whether meetings proceed to second calls, not just whether they happened.
4. Never acting on KPI results. If your win rate drops from 28% to 19% and nobody changes anything, you don't have a KPI program - you have a reporting habit.
5. Ignoring data quality. Your 25% win rate means nothing if half your pipeline is built on unverified contacts who never received your outreach. Every downstream outbound KPI - open rate, response rate, conversion - is corrupted when the denominator is wrong. Teams like Snyk cut bounce rates from 35-40% to under 5% after switching to verified data with Prospeo, and their AE-sourced pipeline jumped 180%. That's what happens when your KPIs finally reflect actual performance instead of database decay.
Building Your Sales Dashboard
Not everyone needs the same view. Everstage's research breaks this down cleanly:
| Dashboard | What to Show | KPI Cap |
|---|---|---|
| Rep | Calls, meetings, deals, tasks | 5-7 max |
| Team | Quota attainment, activity, pipeline coverage, conversions | 5-7 max |
| Executive | Revenue, forecast accuracy, win rates, CAC, churn | 5-7 max |
A rep doesn't need to see CAC. A CRO doesn't need to see individual call counts. Build role-specific dashboards with 5-7 KPIs max per view, and review them on a cadence - weekly for reps, monthly for leadership. The goal is to surface the data each person can actually act on, not to overwhelm them with everything the CRM can report.
Let's be honest: most teams build one monster dashboard, share it with everyone, and wonder why nobody uses it. Start with three views. You can always add more.
If you want a tighter view of what predicts revenue (and what’s just noise), use a pipeline health lens before you add more tiles.
Your sales efficiency ratio tanks when reps waste hours chasing dead emails and wrong numbers. Prospeo delivers 143M+ verified emails at $0.01 each and 125M+ verified mobiles with a 30% pickup rate - so every metric you track starts from real conversations.
Better inputs, better KPIs. Verified contacts from $0.01 each.
FAQ
What's the difference between a sales metric and a sales KPI?
A metric is anything you measure - calls made, emails sent, deals in pipeline. A KPI is a metric you've chosen because it tracks progress toward a specific goal, complete with a target, an owner, and a deadline. Every KPI is a metric, but most metrics aren't KPIs. The distinction is intent: KPIs drive action, metrics just report numbers.
How many sales KPIs should I track?
Cap at 3 per role. SDRs, AEs, and sales leaders each need different KPIs aligned to what they actually control. Track everything else as supporting metrics. Once you go past 5, you aren't prioritizing - you're just reporting.
Why are my outbound KPIs underperforming benchmarks?
Often it's data quality, not messaging. If your email bounce rate exceeds 5%, your response rate and conversion KPIs are built on a broken denominator. Fix the data first, then diagnose the messaging.
Should I use leading or lagging KPIs?
Both. Lagging KPIs like revenue and win rate tell you what happened; leading KPIs like pipeline coverage and meetings booked tell you what to do about it. A balanced stack of one lagging and two leading indicators per role gives you both accountability and coaching leverage.