Sales Performance Analytics: What to Measure, What's Good, and What to Build First
73% of sales organizations can't extract meaningful insights from their data fast enough to impact deal outcomes. Reps spend 60% of their time on non-selling tasks. The sales analytics market is ballooning from $15B to a projected $40B by 2033, and everyone's buying dashboards - but almost nobody's using them well.
Here's what actually changes outcomes: track 5-7 metrics mapped to roles, not a generic list of 30. Know your benchmarks - enterprise win rates average 20-25%, SMB 30-40%. And fix your data before you build dashboards, because analytics built on stale CRM records produce stale insights.
What Sales Performance Analytics Actually Is
It's the practice of collecting, measuring, and interpreting sales data to understand what's working, what isn't, and what to do next. In practice, that means the scorecards your managers review on Monday mornings, the pipeline dashboards your VP checks before the board meeting, and the lead prioritization models that tell SDRs which accounts to call first.
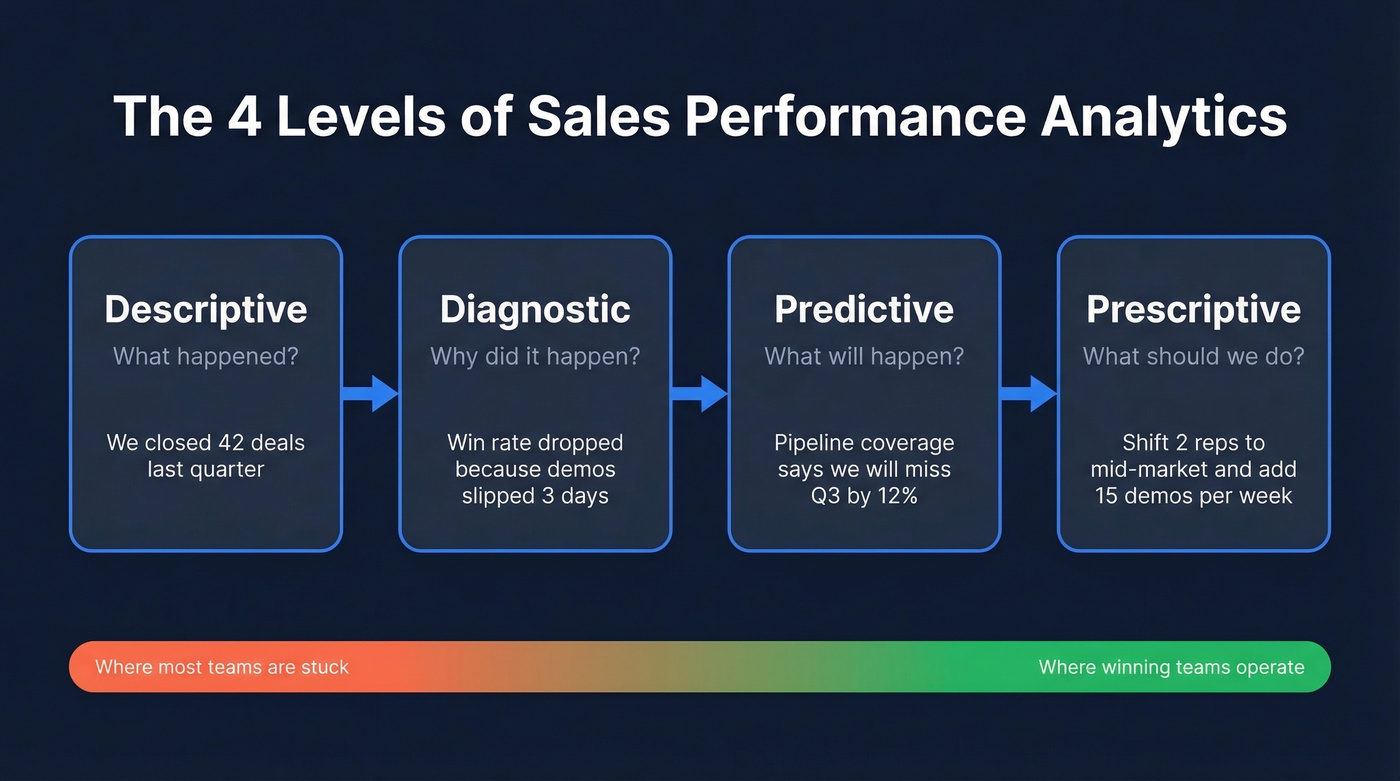
It covers four types - descriptive (what happened), diagnostic (why), predictive (what's likely), and prescriptive (what to do about it). Most teams live in descriptive mode. The ones that win are pushing into predictive. The consensus on r/analytics is that the descriptive-to-prescriptive jump is where most orgs stall, and we've seen the same pattern across dozens of sales teams we've worked with.
Metrics That Matter by Role
Every guide tells you to track more metrics. That's backwards. You need 5-7, and they need to map to the person who can actually move them.
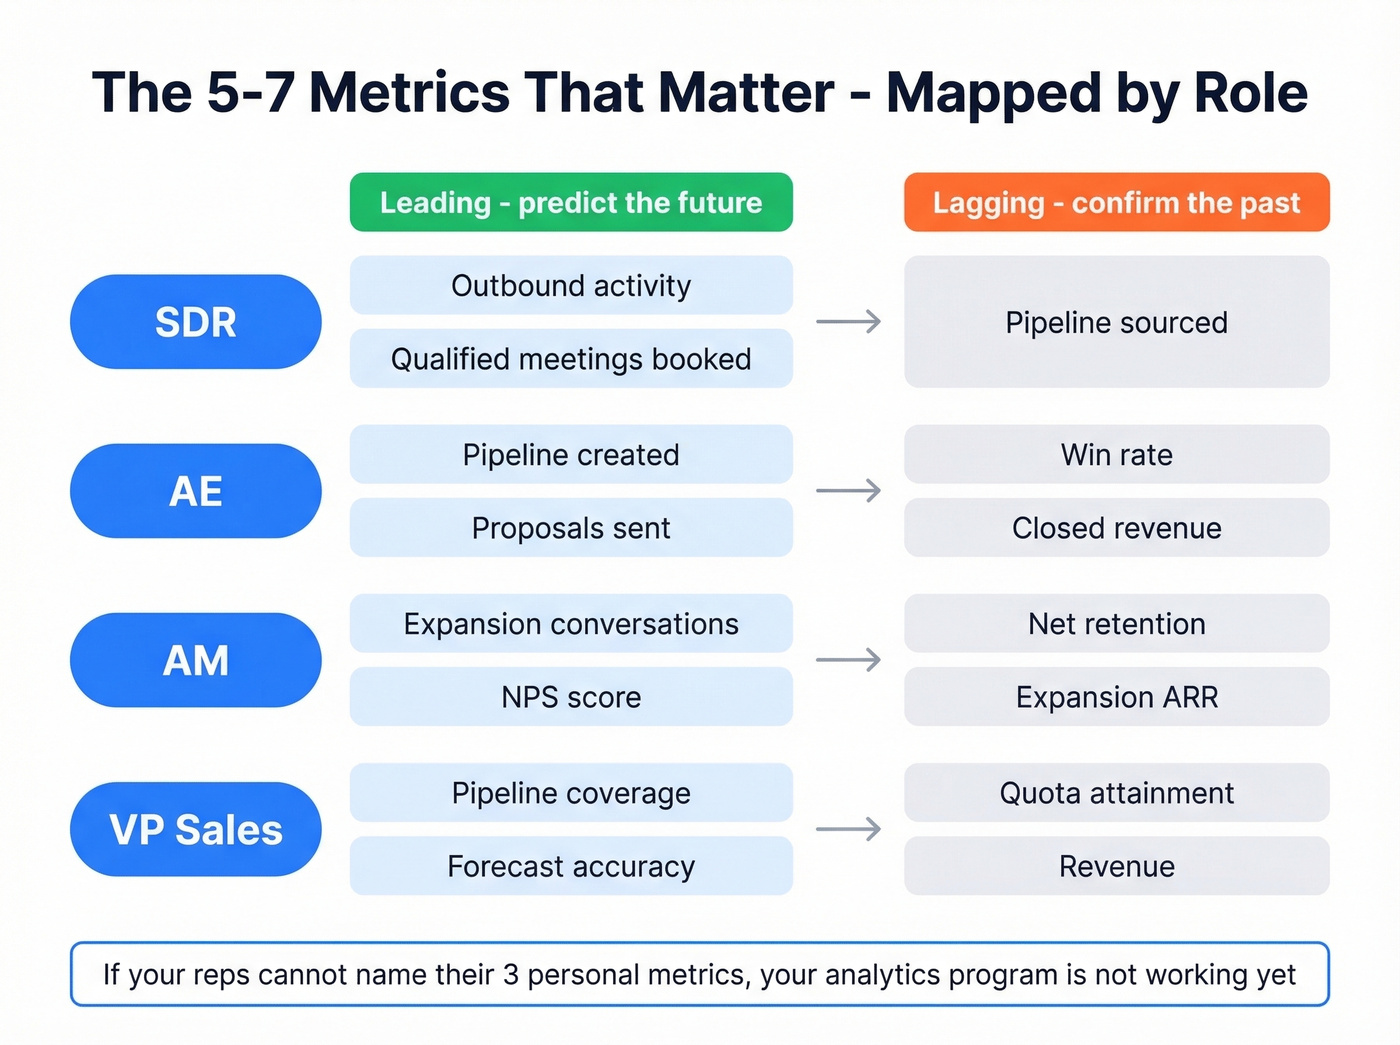
The critical distinction is leading vs. lagging indicators. Win rate is lagging - by the time it drops, deals are already lost. Outbound activity and qualified meetings are leading - they tell you what's coming before revenue shows it. Choosing the right metrics for each role is what separates useful dashboards from decorative ones, and it's the single most important decision in your analytics setup.
| Role | Leading Metrics | Lagging Metrics |
|---|---|---|
| SDR | Outbound activity, qualified meetings booked | Pipeline sourced |
| AE | Pipeline created, proposals sent | Win rate, closed revenue |
| AM | Expansion conversations, NPS | Net retention, expansion ARR |
| VP Sales | Pipeline coverage, forecast accuracy | Quota attainment, revenue |
Two formulas worth memorizing. Win rate: Won Opportunities / Total Closed Opportunities x 100%. Pipeline velocity: (Number of Opportunities x Average Deal Size x Win Rate) / Average Sales Cycle Length. These two numbers, tracked weekly, tell you more than any 30-metric dashboard.
If your reps can't name the three metrics they're personally accountable for, your analytics program isn't working yet. The role-based measurement framework from Highspot nails this - SDRs own activity and qualified meetings, AEs own pipeline creation and closed revenue, account managers own retention and expansion.
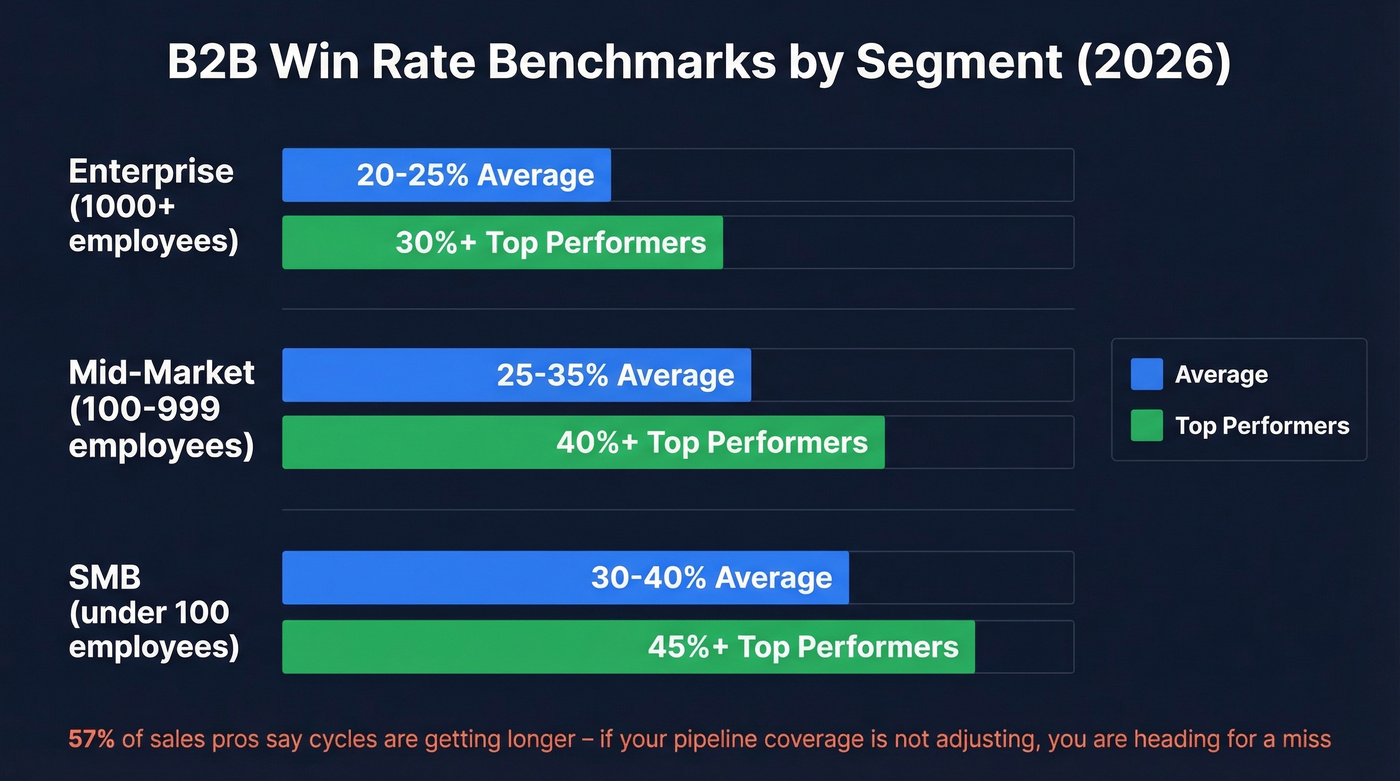
B2B Benchmarks: What "Good" Looks Like
Numbers without context are noise. Here's what "good" actually looks like across B2B segments.
Win Rates by Segment
| Segment | Average | Top Performers |
|---|---|---|
| Enterprise (1000+) | 20-25% | 30%+ |
| Mid-market (100-999) | 25-35% | 40%+ |
| SMB (<100) | 30-40% | 45%+ |
Pipeline Stage Conversions and Cycle Length
| Metric | SMB | Mid-Market | Enterprise |
|---|---|---|---|
| SQL to Opportunity | 35-45% | 25-35% | 20-30% |
| Opportunity to Closed Won | 30-40% | 25-35% | 20-25% |
| Avg Sales Cycle | 14-30 days | 30-90 days | 90-180+ days |
| Reps Hitting Quota | ~60% | ~55% | ~45% |
B2B Website Conversion Rates
| Industry | Avg Conversion |
|---|---|
| B2B SaaS | 1.1% |
| IT & Managed Services | 1.5% |
| Manufacturing | 2.2% |
| Staffing & Recruiting | 2.9% |
| Legal Services | 7.4% |
One stat that should worry every sales leader: 57% of sales professionals say the sales cycle is getting longer. If your cycle length is creeping up and your pipeline coverage isn't adjusting, you're heading for a miss. Your quarterly dashboard won't show it until it's too late.
Every benchmark in this guide assumes your pipeline data is accurate. If your CRM is full of stale contacts, your win rates, cycle lengths, and forecasts are all fiction. Prospeo refreshes 300M+ profiles every 7 days - not every 6 weeks - and delivers 98% email accuracy so the metrics you track actually reflect reality.
Clean data in, accurate analytics out. Start at $0.01 per email.
Four Reports Every Sales Org Needs
Multi-source acquisition funnel. Combine GA4 web data with CRM pipeline stages. Most teams have a marketing attribution report OR a sales pipeline report, never both connected. Bridging that gap is where the real insight lives - you'll finally see which channels produce pipeline, not just leads.
Rep performance view. Win rates, deal size, cycle length, and quota attainment by rep. Not a leaderboard - a coaching map that highlights where each individual needs support. We've found that framing it as a coaching tool instead of a ranking system is the difference between reps actually opening the dashboard and ignoring it.
Lost deal analysis. Segment by loss reason, deal stage, competitor, and market segment. It's common to find a huge share of losses clustering at the same stage against the same competitor. That's a positioning problem, not a rep problem.
Revenue forecasting and pipeline health. Weighted projections, stalled deal flags, and stage velocity tracking. CRM dashboards drive an average 29% increase in sales - but only when the forecasting view is role-specific and updated at least weekly.
Predictive Analytics: What Works and What Doesn't
Sellers who partner with AI sales tools are 3.7x more likely to meet quota. AI-powered forecasting runs 20-50% more accurate than manual methods.
But let's be honest - predictive analytics is powerful and overhyped at the same time. It works brilliantly for lead scoring, churn prediction, and pipeline propensity modeling, all use cases where the model is prioritizing, not deciding. It fails when teams expect models to compensate for weak data hygiene. Per Salesforce's State of Sales report, 84% of data and analytics leaders agree that AI outputs are only as good as data inputs.
Here's the thing: if your average deal size is under $10k and your team is under 15 reps, you probably don't need predictive AI yet. A clean CRM with five well-chosen metrics will outperform a $50k forecasting tool running on dirty data. Fix the foundation first.
Seven Mistakes That Kill Your Analytics
1. Dirty CRM data. The foundation problem. If your contact records are stale, your pipeline metrics are fiction. Automate verification with a data enrichment tool that refreshes records on a weekly cycle - not quarterly manual audits.
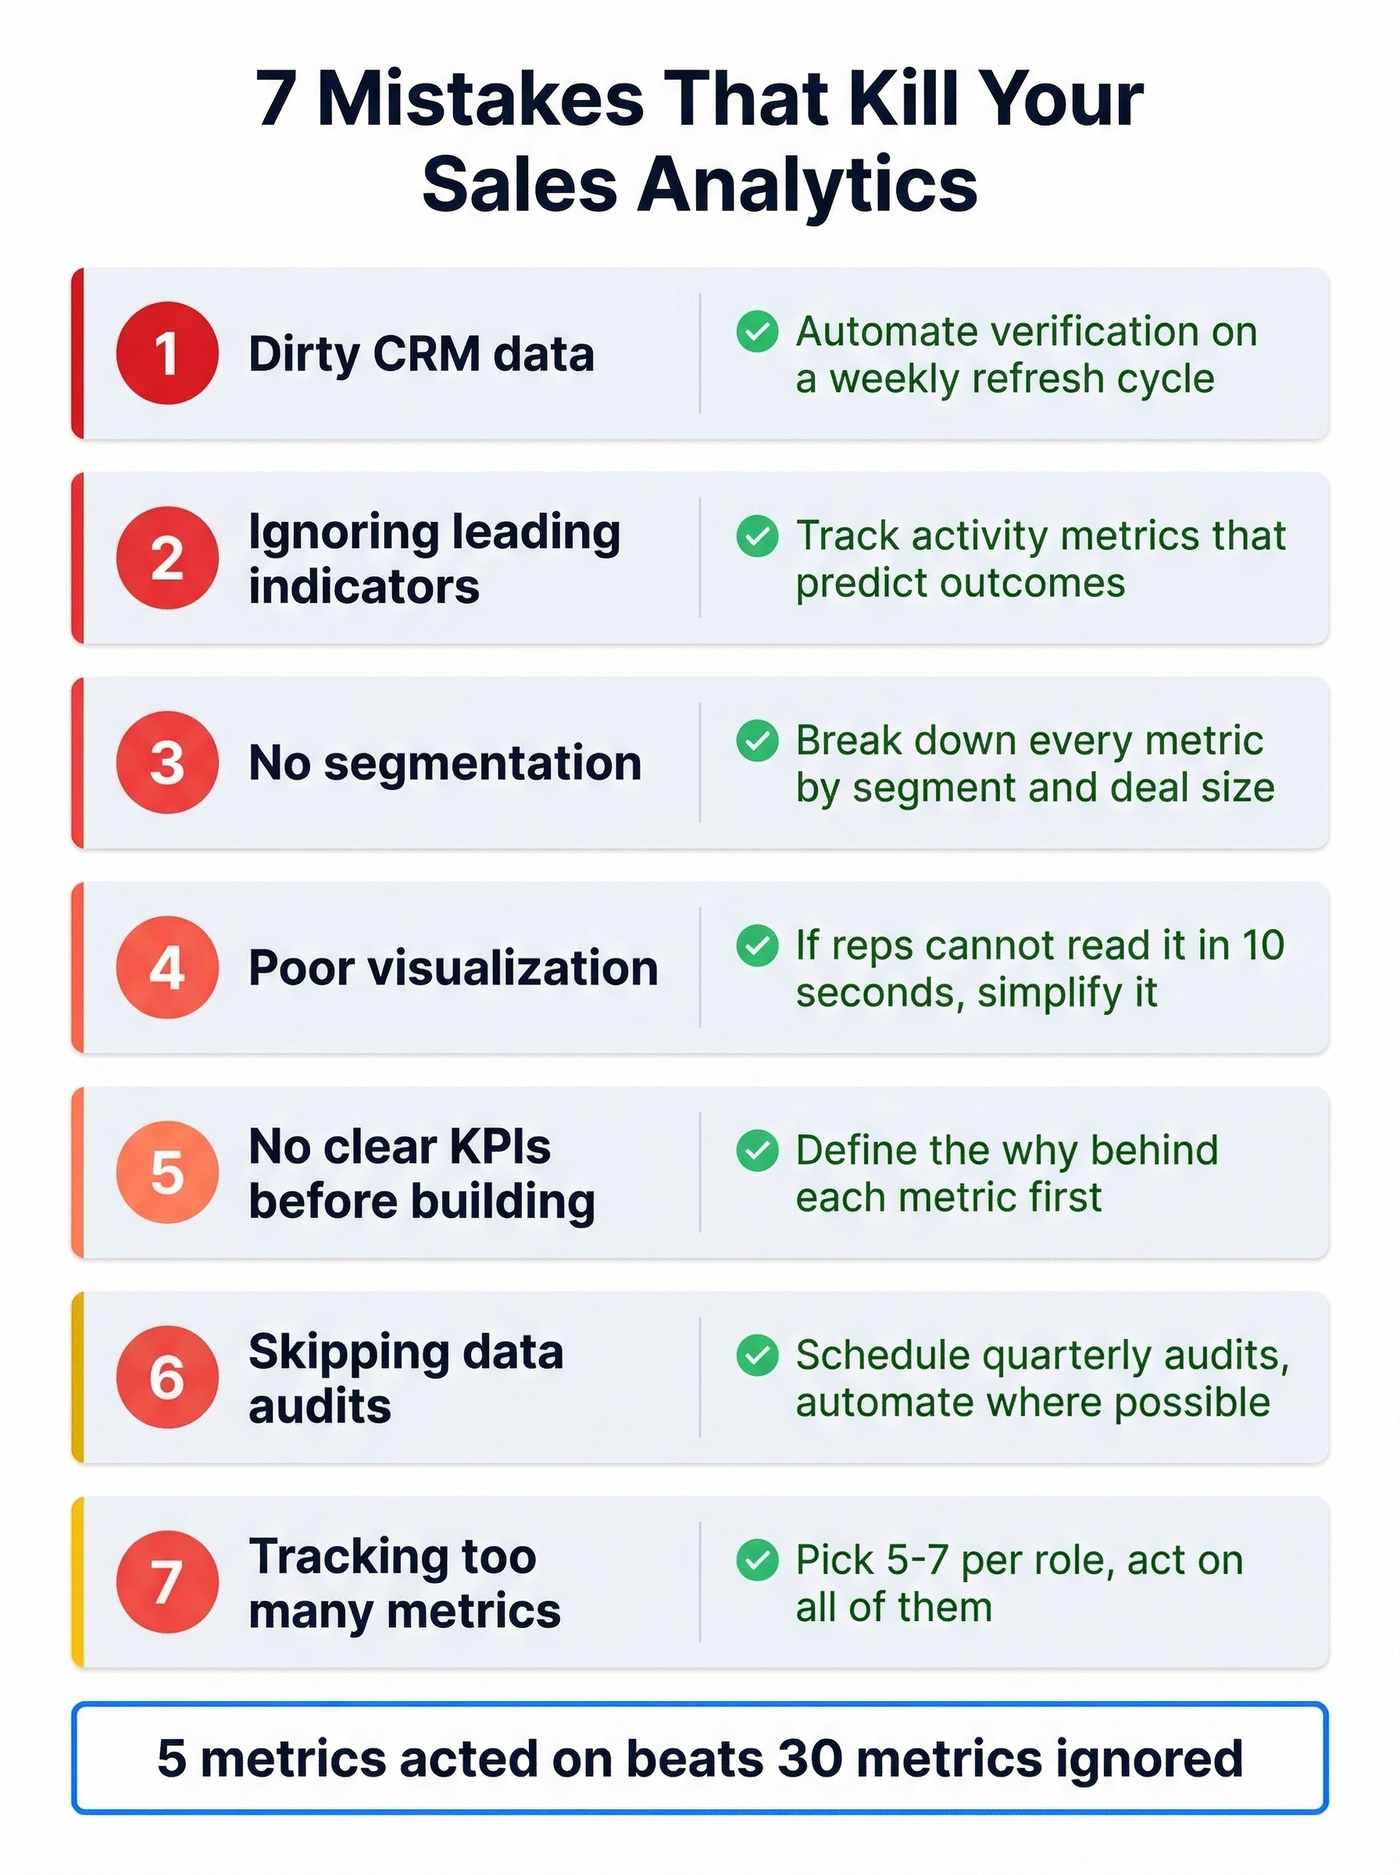
2. Ignoring leading indicators. By the time win rate drops, you're already behind. Track activity metrics that predict outcomes.
3. No segmentation. A 30% win rate means nothing if enterprise is at 15% and SMB is at 50%. Break it down or it's useless.
4. Poor visualization. Ever built a beautiful Tableau dashboard that nobody opened after week two? If reps can't understand it in 10 seconds, they won't use it.
5. No clear KPIs before building dashboards. Define your reporting KPIs and the "why" behind each one before you touch a BI tool. Skip this and you'll rebuild the whole thing in three months.
6. Skipping data audits. Data decays. People change jobs, companies merge, emails bounce. Without regular audits, your analytics drift further from reality every quarter. 77% of sellers struggle to complete tasks efficiently - stale data makes that worse.
7. Tracking too many metrics. The framing on r/salestechniques mirrors what we see in practice: many orgs operate on pure intuition until a simple, focused dashboard forces prioritization shifts. Five metrics acted on beats thirty metrics ignored.
Tools That Power the Stack
You need three layers working together before you add anything else. 91% of firms with 10+ employees already use a CRM - the question isn't whether you have one, it's whether the data inside it is trustworthy.
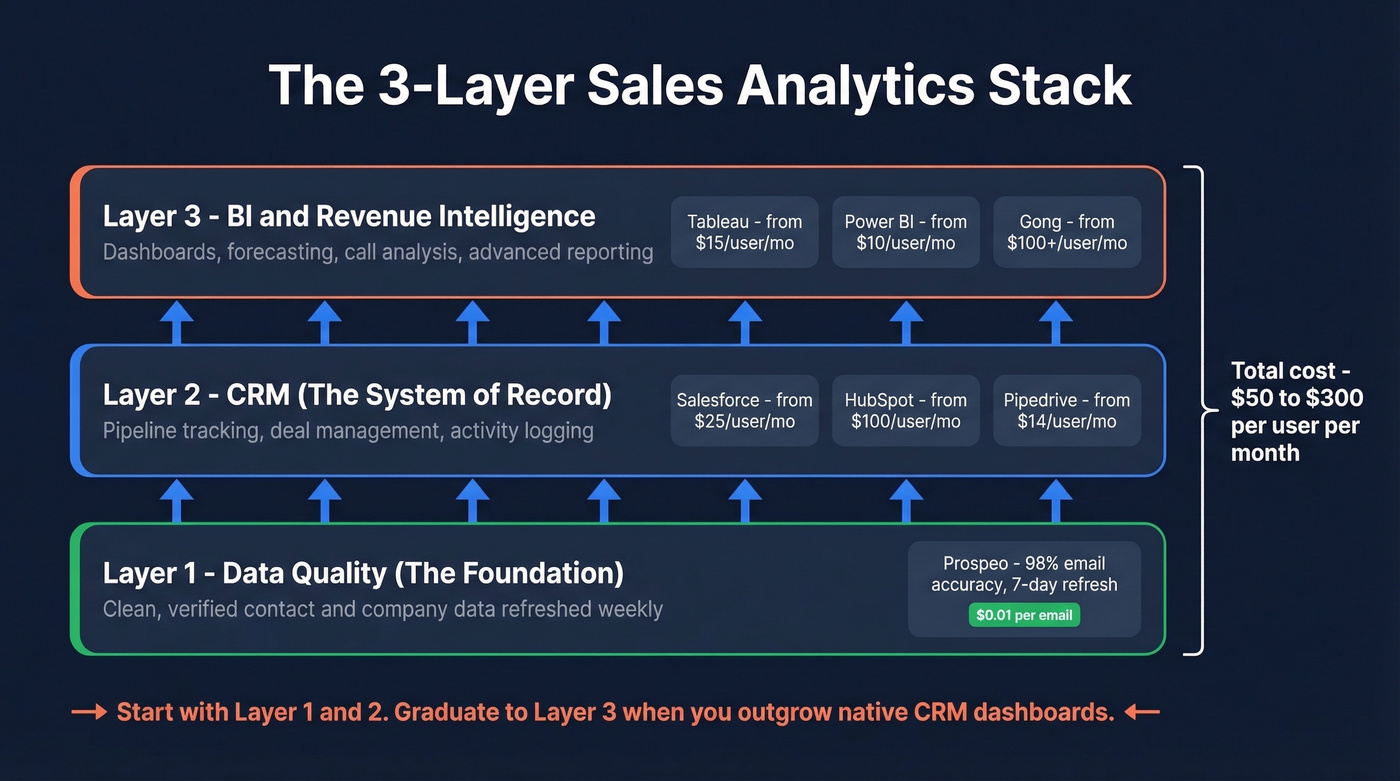
| Tool | Layer | Best For | Starting Price |
|---|---|---|---|
| Salesforce | CRM | Enterprise orgs | $25/user/mo |
| HubSpot Sales Hub | CRM | Marketing-heavy teams | $100/user/mo |
| Pipedrive | CRM | SMB sales teams | $14/user/mo |
| Tableau | BI | Complex data visualization | $15/user/mo |
| Power BI | BI | Microsoft-stack teams | $10/user/mo |
| Gong | Revenue Intel | Call-heavy sales floors | $100+/user/mo |
Most analytics stacks land around $50-$300/user/month once you combine a CRM, BI, and revenue intelligence layer. The layer most teams underspend on is data quality - and it's the one that determines whether everything else is trustworthy. Prospeo's 98% email accuracy and 7-day refresh cycle mean the numbers feeding your reports reflect reality, not last quarter's org chart.
For teams spending less than $20k/year on their data stack, skip Gong and Tableau for now. Start with a CRM, a clean data layer, and built-in CRM reporting. You can graduate to dedicated BI once you've outgrown native dashboards.
If you’re evaluating CRMs, it helps to compare examples of a CRM before you commit.
If forecasting is a priority, start with sales forecasting solutions that match your deal cycle.
You just read that 84% of analytics leaders say AI outputs are only as good as data inputs. Prospeo's 5-step verification, catch-all handling, and spam-trap removal mean your CRM enrichment returns 50+ verified data points per contact - with a 92% match rate. Stop building dashboards on dirty data.
Fix the foundation before you buy another dashboard tool.
FAQ
What's the difference between sales analytics and sales reporting?
Reporting shows what happened - closed deals, revenue totals, activity counts. Analytics explains why those numbers moved and predicts what's next, diagnosing bottlenecks and prescribing where to focus. Reporting is the rearview mirror; analytics is the windshield.
How many metrics should a sales team track?
Five to seven, mapped to specific roles. SDRs track activity and qualified meetings; AEs track pipeline and win rate. Tracking 20+ metrics leads to dashboard fatigue where teams act on none of them.
How do you keep CRM data clean for reliable analytics?
Automate data hygiene with a verification layer instead of relying on manual audits. Weekly refresh cycles and automated email verification keep dashboards current without someone spending Friday afternoons scrubbing spreadsheets.
What tools do you need for a sales analytics stack?
Three layers: a CRM as your system of record, a BI tool for custom dashboards, and a data quality platform to keep the other two honest. Most teams overbuy on BI and underspend on data quality - which is backwards.
How often should you review sales performance data?
Reps should check personal dashboards daily. Managers should review team metrics weekly. Executives should assess pipeline health and forecast accuracy bi-weekly or monthly. The cadence matters less than consistency - irregular reviews let problems compound undetected.