Sales Performance Measurement: Metrics That Actually Change Outcomes
Your VP just asked why pipeline is up 40% but revenue is flat. You pull up the dashboard - 30 metrics, all green - and none of them explain the gap. This is the core problem with sales performance measurement today: visibility without action creates awareness without agency. Teams have more data than ever, yet global employee engagement sits at just 21%, costing the world economy $438B in lost productivity.
You've probably read five articles listing 10-30 "essential" metrics. You now have 150 metrics and no idea which ones matter. Tracking 30 metrics is the same as tracking zero. The problem isn't that sales teams measure too little - it's that they measure too much, act on none of it, and blame the CRM.
What You Need (Quick Version)
Track these five metrics and you'll diagnose 80% of your pipeline problems:
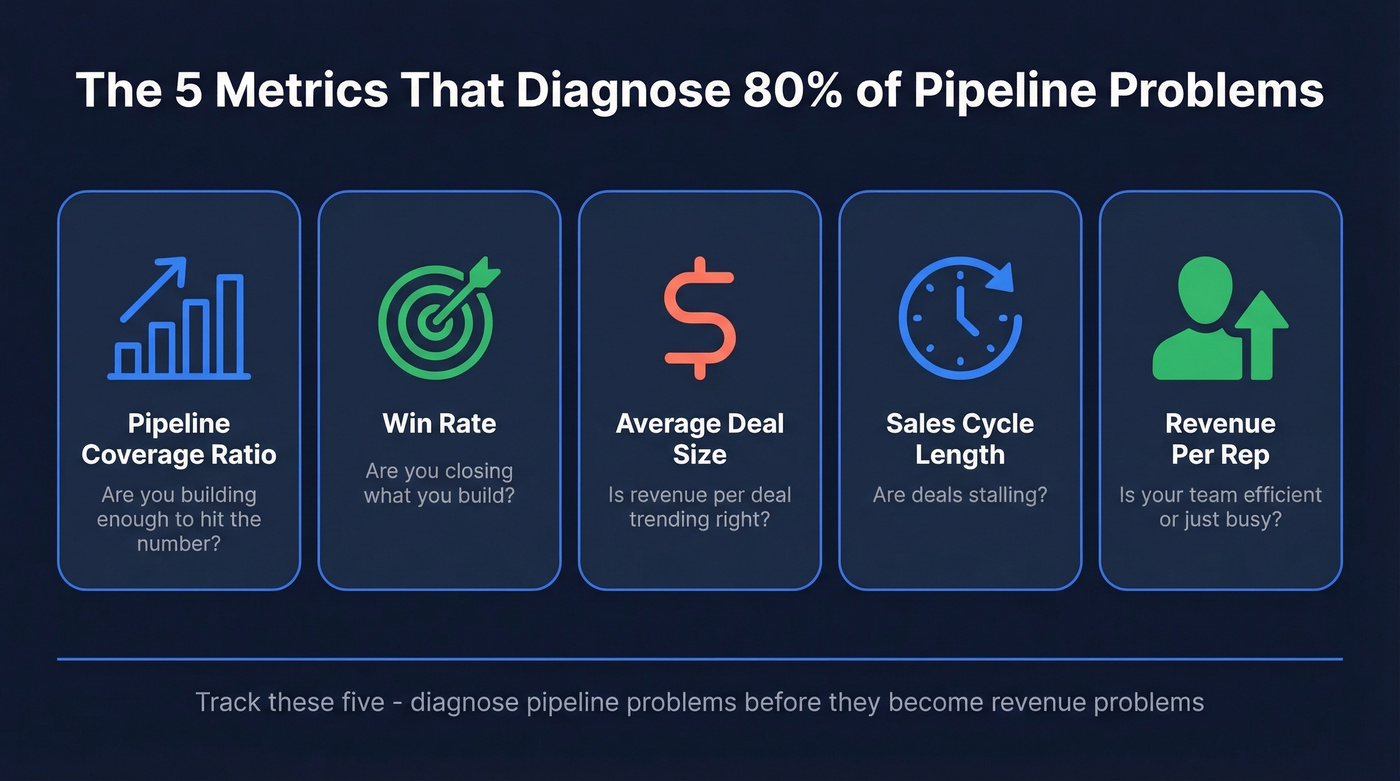
- Pipeline coverage ratio - are you building enough to hit the number?
- Win rate - are you closing what you build?
- Average deal size - is revenue per deal trending right?
- Sales cycle length - are deals stalling?
- Revenue per rep - is your team efficient or just busy?
These are the sales performance metrics examples that surface in every high-performing org we've studied. Everything below explains why these five matter, how to calculate them, and what to do when they go sideways.
Metrics vs. KPIs vs. Targets
These terms get used interchangeably. They shouldn't.
| Term | Definition | Example |
|---|---|---|
| Metric | Any measurable data point | Emails sent per day |
| KPI | A metric tied to a strategic goal | Win rate (tied to revenue) |
| Target | The benchmark a KPI must hit | Win rate ≥ 25% |
KPIs are the 5-7 metrics that actually drive decisions. Everything else is context. If you can't explain why a metric changes behavior, it's not a KPI - it's noise.
Leading vs. Lagging Indicators
| Leading (Predictive) | Lagging (Outcome) |
|---|---|
| Meetings booked | Revenue closed |
| Pipeline created | Quota attainment |
| Proposals sent | Average deal size |
| Time in stage | Annual contract value |
Lagging indicators are terrible for coaching. By the time you see a missed quota, it's too late to fix the behavior that caused it. Leading indicators create weekly coaching windows - you can intervene on pipeline creation in week two, not month three.
Teams that track both leading and lagging indicators see roughly a 15% improvement in sales productivity. Map leading indicators to weekly coaching sessions. Save lagging indicators for quarterly board reporting.
Sales Metrics Examples That Matter
Pipeline Health
Pipeline velocity measures how fast revenue moves through your funnel:
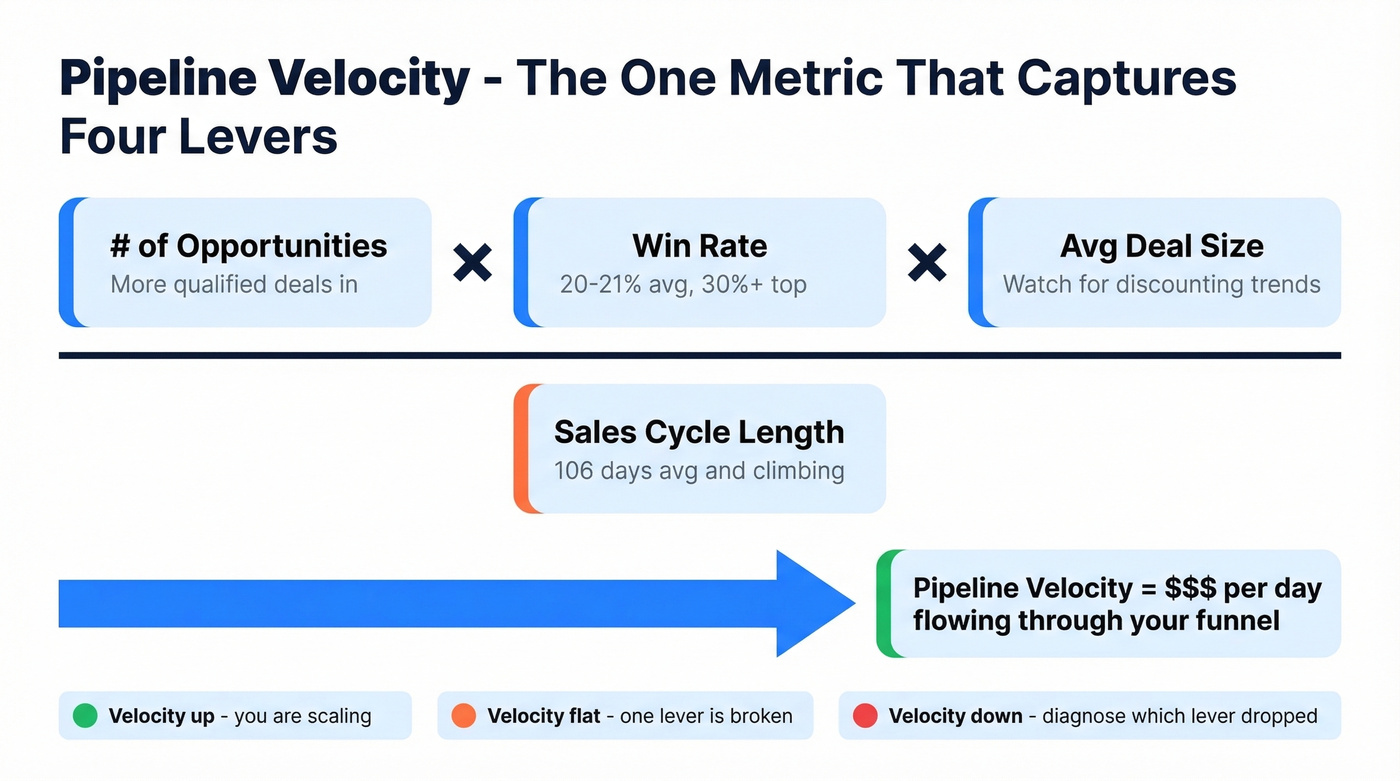
(Number of opportunities x Win rate x Avg deal size) / Sales cycle length
This single metric captures four variables at once. When velocity drops, you know immediately which lever to pull.
Pipeline coverage ratio compares total pipeline value to your quota target. The rule of thumb is 3-4x coverage. Below 3x and you're hoping. Above 5x often signals a qualification problem - a pipeline bloated with deals that won't close. We've seen coverage below 3x almost never recover without intervention.
Time in stage tracks how long deals sit at each pipeline stage. It's the earliest warning sign of a stalled deal and the metric most teams ignore. When a deal exceeds your median stage duration by 2x, treat it as high-risk and re-qualify it fast.
Efficiency
Win rate is the percentage of opportunities that close. The average B2B win rate is 20-21%, while top performers hit 30%+. Deals closed within 50 days show a 47% win rate; deals dragging past 50 days drop to roughly 20%. Speed isn't just efficiency - it's effectiveness.
When win rate drops, check two things: deal qualification at the top of the funnel and whether reps are multi-threading into buying committees, which now average 6-10 stakeholders.
Sales cycle length averaged 106 days in recent data, up from 98 the prior year - and 57% of sales professionals say it's still getting longer. If yours is climbing, look at time in stage by deal segment. The bottleneck is usually in one specific stage, not everywhere.
Revenue per rep is the metric practitioners actually care about. On r/sales and r/salestechniques, leaders consistently ask for metrics that connect individual output to capacity planning and forecasting. Revenue per rep is the simplest way to measure sales performance at the individual level. When it declines while activity stays flat, you've got an efficiency problem, not an effort problem.
Revenue Outcomes
Quota attainment distribution matters more than average attainment. Up to 70% of reps missed quota in 2024, and only 28% met quota in 2023. If your distribution is bimodal - a few crushers and everyone else below 80% - you've got a coaching problem, not a hiring problem.
Average deal size trending down usually signals discounting or a shift in your ICP mix. Audit your discount approval process and ICP targeting when it drops. Trending up without a corresponding cycle length increase? That's the best sign in sales.
CAC and CLV round out the picture. When CAC payback exceeds 18 months, reduce acquisition spend on low-LTV segments. No amount of pipeline coverage saves you otherwise.
Win rate and pipeline velocity both depend on reaching real buyers. When 35% of your emails bounce, every metric in your dashboard lies. Prospeo delivers 98% email accuracy and 125M+ verified mobiles so your reps connect with decision-makers, not dead inboxes.
Stop measuring a pipeline built on bad contact data.
2026 Sales Team Performance Benchmarks
| Metric | Benchmark |
|---|---|
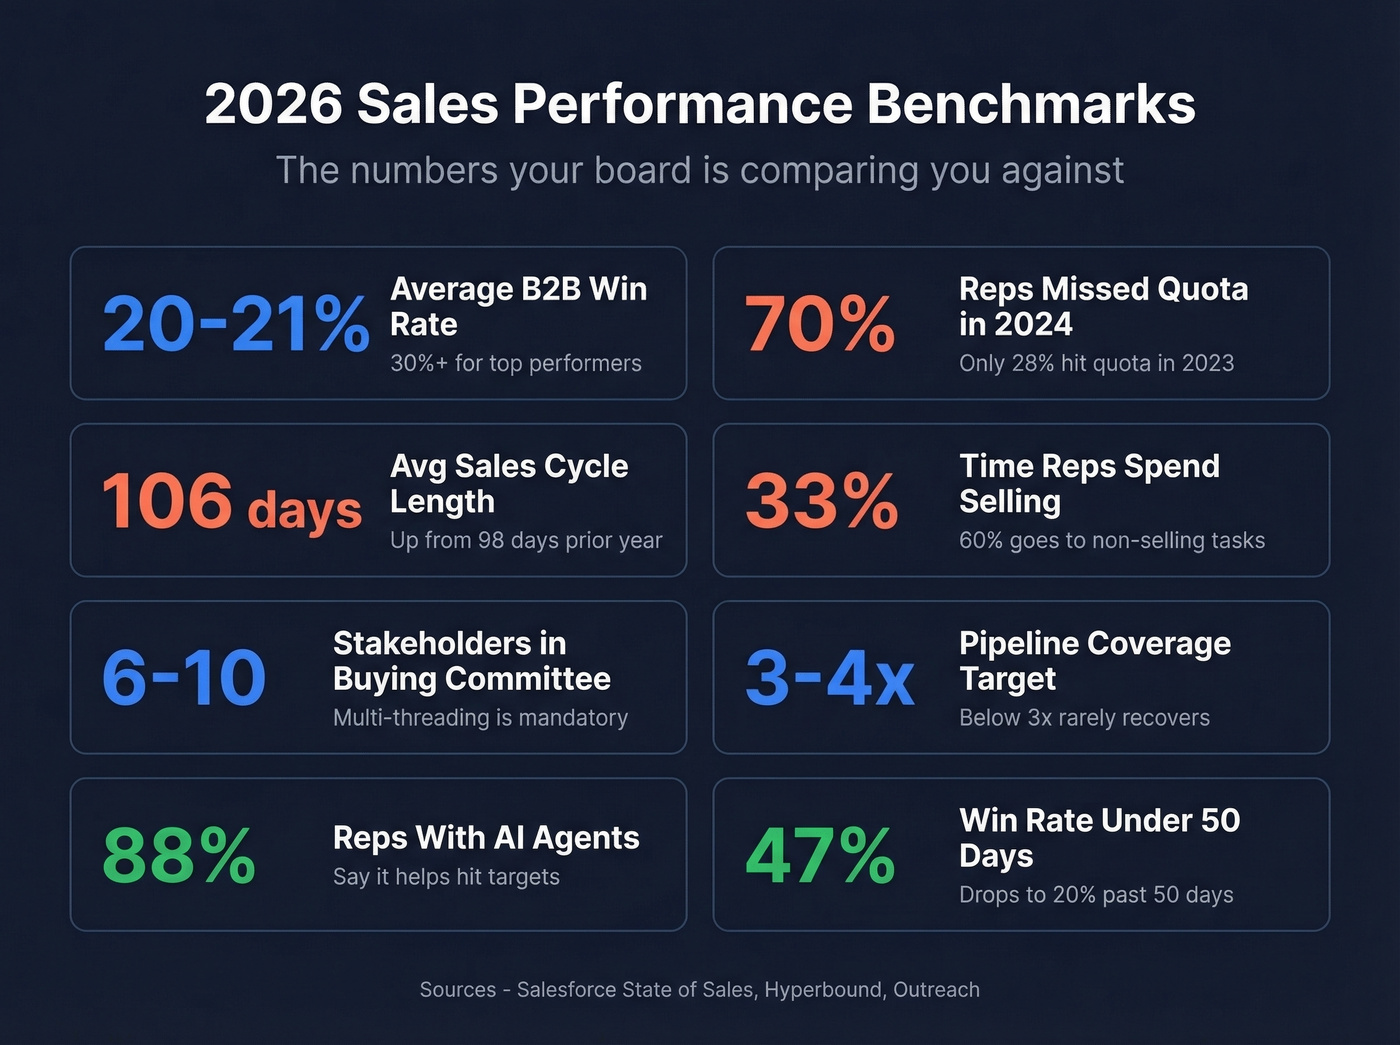
| Win rate | 20-21% avg, 30%+ top performers |
| Quota attainment | ~70% missed quota (2024); only 28% hit quota (2023) |
| Sales cycle length | 106 days avg (up from 98) |
| Time actively selling | 33% of rep time |
| Non-selling tasks | 60% of rep time |
| Buying committee | 6-10 stakeholders |
| Pipeline coverage | 3-4x target |
| AI agent adoption | 88% of reps with agents say it increases odds of hitting targets |
Screenshot this table. Share it with your team. These are the numbers boards and investors benchmark against.
Metrics That Do More Harm Than Good
A Morton Kyle poll found that 47% of sales leaders consider CRM activity counts the most dangerous metric to obsess over, followed by pipeline size at 37%. Both are trivially gameable - logged calls that never happened, emails sent but never read, pipeline stuffed with deals that'll never close.
Here's the thing: 75% of your pipeline is rubbish. Measuring its size without qualifying its health is like measuring a patient's weight and calling it a diagnosis.
Let's be honest - if your team tracks more than 7 KPIs, they effectively track none. In our experience, the teams with the longest dashboards have the weakest coaching cultures. Fewer metrics, more conversations.
Drop these: raw activity counts, unweighted pipeline size, individual rankings without context.
Replace with: revenue-weighted stage progression, validated next steps per deal, time in stage by deal segment, conversion rate by stage.
Stacey Barr's research reinforces this: measuring people's performance in isolation increases gaming and stress, while measuring actions and milestones drives effort toward doing rather than toward making a difference. Measure outcomes, not motion.
Metrics by Company Stage
What matters depends on where you are. Measuring sales team performance looks different at every stage of growth.
| Stage | Focus Metrics | Benchmarks |
|---|---|---|
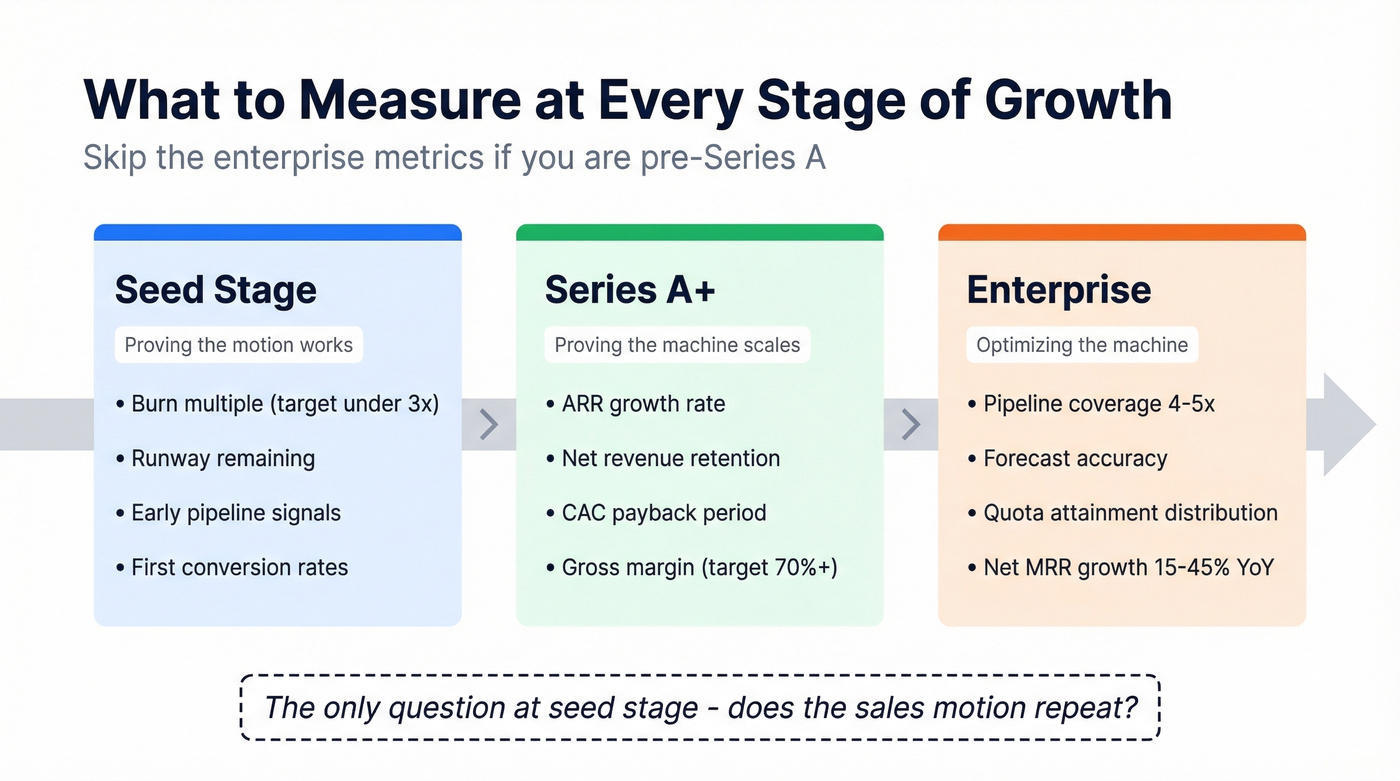
| Pre-seed / Seed | Burn multiple, runway, early pipeline | Burn multiple <3x |
| Series A+ | ARR growth, NRR, CAC payback | Gross margin ~70%+ |
| Enterprise | Pipeline coverage 4-5x, forecast accuracy, quota distribution | Net MRR growth 15-45% YoY |
At seed stage, you're proving the motion works - track burn multiple and early conversion signals. By Series A, investors want ARR growth rate, net revenue retention, and CAC payback because those tell them whether the machine scales. At enterprise scale, the game shifts to sales forecasting and quota attainment distribution across a larger team.
Skip the enterprise metrics if you're pre-Series A. They'll distract you from the only question that matters at that stage: does the sales motion repeat?
Turning Metrics Into Action
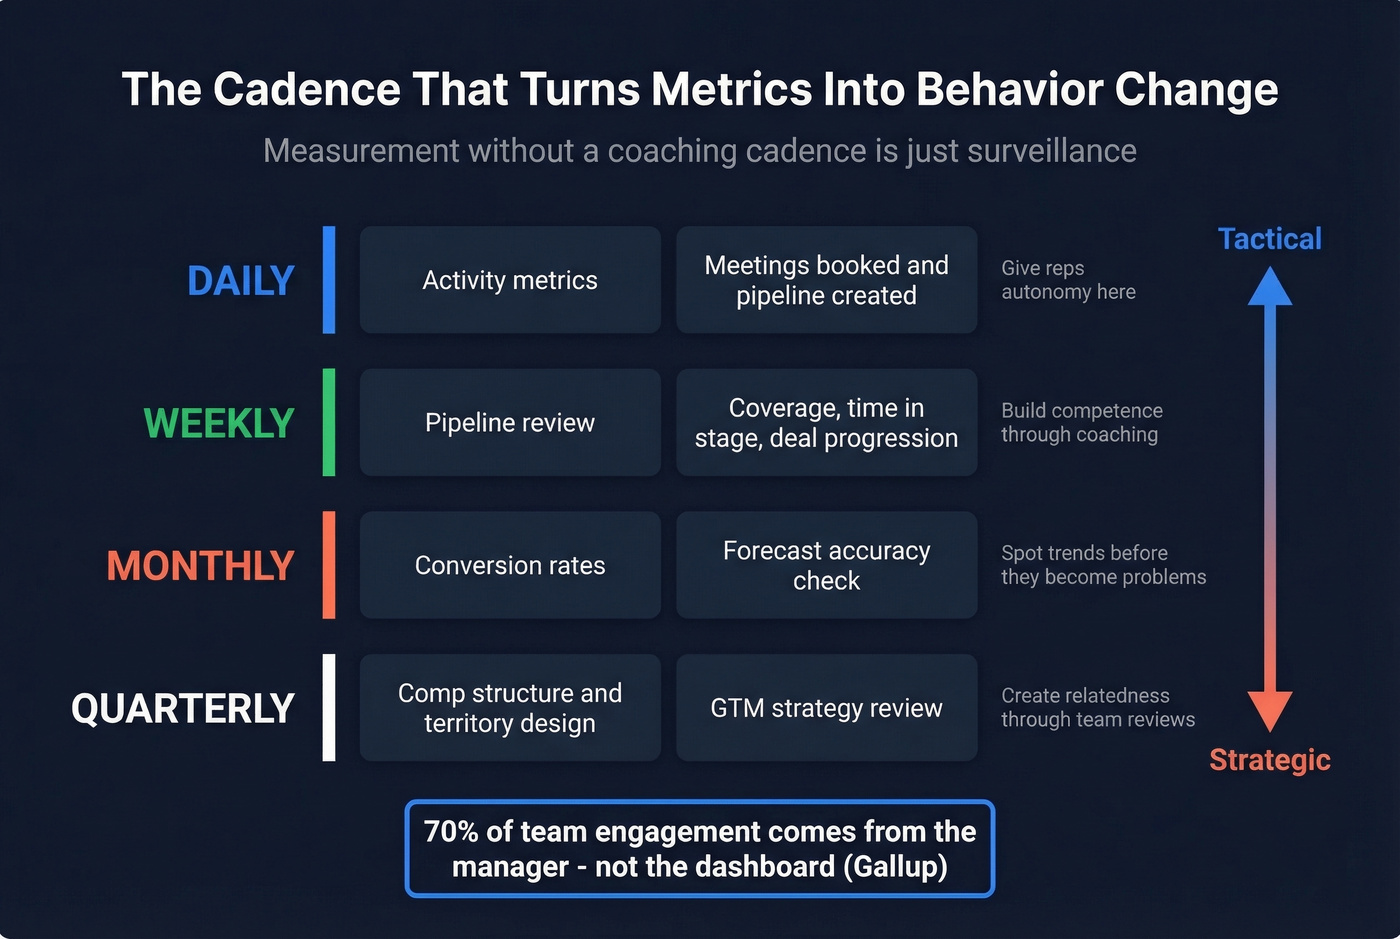
Gallup's data is clear: 70% of team engagement is attributable to the manager. Metrics don't change behavior - managers using metrics change behavior. The difference between tracking performance and actually improving it comes down to how consistently leaders act on what the numbers reveal.
I saw a sales org on Reddit that ran purely on intuition for years - no region analysis, no product performance tracking. Someone built a simple KPI dashboard showing conversion rates by region and product. It changed the entire team's daily workflow overnight. That's the gap between measurement and management.
The cadence that works:
- Daily: Activity and leading indicators like meetings booked and pipeline created
- Weekly: Pipeline review covering coverage, time in stage, and deal progression
- Monthly: Conversion rates and forecast accuracy
- Quarterly: Comp structure, territory design, GTM strategy
This maps to Self-Determination Theory: give reps autonomy over daily metrics, build competence through weekly coaching, create relatedness through team-level quarterly reviews. AI is accelerating this loop - 88% of reps using AI agents say the technology increases their odds of hitting targets, largely because agents surface the right metric at the right moment instead of burying it in a dashboard.
Measurement without a coaching cadence is just surveillance.
Data Quality: The Prerequisite Nobody Talks About
None of these metrics mean anything if your underlying data is wrong. In many CRMs, 20-35% of contact records are stale - and every downstream metric built on that data is fiction. Emails "sent" that bounced. "Contacts reached" who left the company six months ago.
73% of B2B buyers actively avoid sellers who send irrelevant outreach, and stale data is the fastest path to irrelevance. Prospeo addresses this at the foundation level - 98% email accuracy, a 7-day data refresh cycle versus the 6-week industry average, and an 83% enrichment match rate so your CRM reflects reality instead of last quarter's org chart. If you're evaluating vendors, start with a clear view of data enrichment services and how they validate records. Meritt saw their bounce rate drop from 35% to under 4% after switching, and their pipeline tripled from $100K to $300K per week. That's the prerequisite that makes every other metric in this article trustworthy.
If you want to quantify the impact, track your email bounce rate alongside pipeline velocity and win rate.
Revenue per rep tanks when reps spend 60% of their time on non-selling tasks like hunting for valid emails. Prospeo's Chrome extension and CRM enrichment return 50+ data points per contact at 92% match rate - so your team sells instead of searches.
Give your reps the data that actually moves the metrics.
FAQ
What's the difference between sales metrics and sales KPIs?
Metrics are any measurable data point - emails sent, calls logged, deals created. KPIs are the 5-7 metrics directly tied to strategic goals that change decisions. Track metrics broadly for context, but manage your team by KPIs. If a metric doesn't trigger an action, it's not a KPI.
How many sales KPIs should a team track?
Five to seven. Research and practitioner consensus agree that more KPIs dilute focus and accountability. Pick the ones that diagnose your specific bottleneck - pipeline creation, conversion, or deal velocity - not the ones that look good on a dashboard.
What's a good win rate in B2B sales?
The average B2B win rate is 20-21%, while top-performing teams hit 30%+. Timing matters enormously: deals closed within 50 days show a 47% win rate, while deals past 50 days drop to roughly 20%. Shortening your cycle is one of the fastest levers to improve close rates.
How does bad data affect sales performance measurement?
If 20-35% of your contact records are stale, every downstream metric - conversion rates, pipeline velocity, revenue per rep - is inflated or misleading. Keeping CRM data current with verified contacts and a short refresh cycle ensures your metrics reflect reality. Without reliable data, any attempt to measure performance is built on guesswork.
How often should sales metrics be reviewed?
Daily for activity and leading indicators like meetings booked. Weekly for pipeline health and deal progression. Monthly for conversion rates and forecast accuracy. Quarterly for comp, territory, and GTM strategy. Match the review cadence to each metric's time horizon.