Sales Pipeline Reports: The Operational Playbook for Reports That Actually Work
Two new deals sat untouched until Thursday. Three people spent hours redoing the same proposal because nobody noticed it was already finished. The pipeline looked overflowing one minute, empty the next. That's not a hypothetical - a SaaS founder posted this exact scenario on Reddit, and it's the chaos that sales pipeline reports are supposed to prevent. The problem isn't that teams lack data. It's that their reports don't drive action.
What You Need (Quick Version)
You need 5-7 pipeline reports (not fifteen), hard benchmarks to compare against, a repeatable review meeting structure, and hygiene automation to keep the data trustworthy. This guide gives you all four - with formulas, worked examples, and the specific numbers your reports should hit.
What Is a Pipeline Report?
A sales pipeline report is a snapshot of every active deal in your funnel - where each one sits by stage, its dollar value, expected close date, and probability of winning. It answers one question: what does our revenue-generating machine look like right now?
Don't confuse it with a sales forecast. A pipeline report shows current state: deals in progress, their stages, their values. A forecast takes that data and projects a revenue outcome for a future period, layering in win probabilities and historical patterns. The report is the input. The forecast is the output.
Nearly 70% of businesses struggle to build reliable pipeline reports. Most teams either track too many metrics without acting on any of them, or they rely on a CRM dashboard that nobody updates. The goal isn't more data - it's the right data, reviewed consistently, with clear action triggers.
Pipeline Metrics That Matter (With Formulas)
You don't need 15 reports. You need 5-7 you actually review weekly. Here are the metrics that belong in those reports, with formulas and worked examples so you can build them today.
Pipeline Value & Weighted Pipeline
Pipeline value is the sum of all open deal amounts. But raw pipeline value is misleading because it treats a Stage 1 discovery call the same as a Stage 5 contract negotiation.
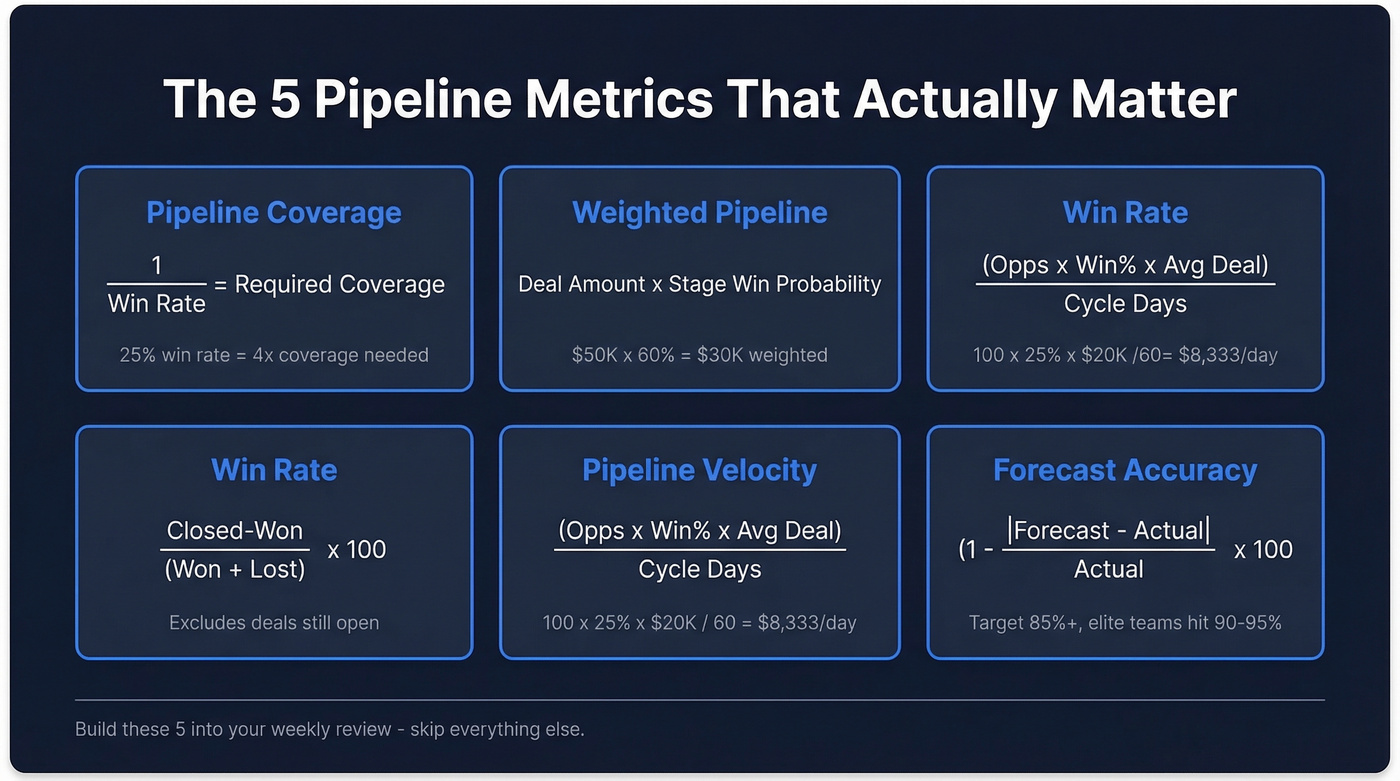
Weighted pipeline value fixes this:
Say you've got a $50,000 deal in proposal stage at 60% probability and a $30,000 deal in discovery at 20%. Weighted pipeline = ($50,000 x 0.60) + ($30,000 x 0.20) = $36,000. That's a much more honest number to plan around than the raw $80,000.
Coverage Ratio
Pipeline coverage ratio = Total Pipeline Value / Revenue Target. Everyone says "aim for 3x." Here's the thing: that advice ignores your win rate entirely.
If your win rate is 20%, you need 5x coverage. If it's 40%, you need 2.5x. Some teams with long enterprise cycles and low win rates run 10x coverage, and that's perfectly appropriate. The formula is simple:
A team closing 25% of deals needs 4x coverage to hit target. Anything less and you're hoping, not planning.
Win Rate & Close Rate
These get used interchangeably, but they measure different things. Win rate = Closed-Won / (Closed-Won + Closed-Lost). It excludes deals still in progress. Close rate = Closed-Won / Total Opportunities Created. It includes everything, even deals still open.
Close Rate = (Closed-Won Deals / Opportunities Created) x 100
Win rate tells you how good you are at closing competitive deals. Close rate tells you how efficient your entire funnel is. Track both.
Pipeline Velocity
This is the single most useful pipeline metric. It tells you how much revenue moves through your pipeline per day.
Pipeline Velocity = (Opportunities x Win Rate x Avg Deal Size) / Sales Cycle Length (days)
Worked example: 100 opportunities x 25% win rate x $20,000 average deal / 60-day cycle = $8,333/day. If that number drops week over week, something's broken - fewer deals entering, win rates declining, or cycles stretching.
Forecast Accuracy (MAPE)
If your forecasts are consistently off by 30%, your pipeline process needs work. Measure it with MAPE:
Forecast Accuracy (%) = (1 - |Forecast - Actual| / Actual) x 100
High-performing orgs target 85% accuracy. Best-in-class teams hit 90-95%. Below 75%? Your stage definitions or CRM hygiene need attention before you trust any forecast.
Pipeline Benchmarks
Metrics without benchmarks are just numbers. Here's what you should be aiming for.
Stage-by-Stage Conversion Benchmarks
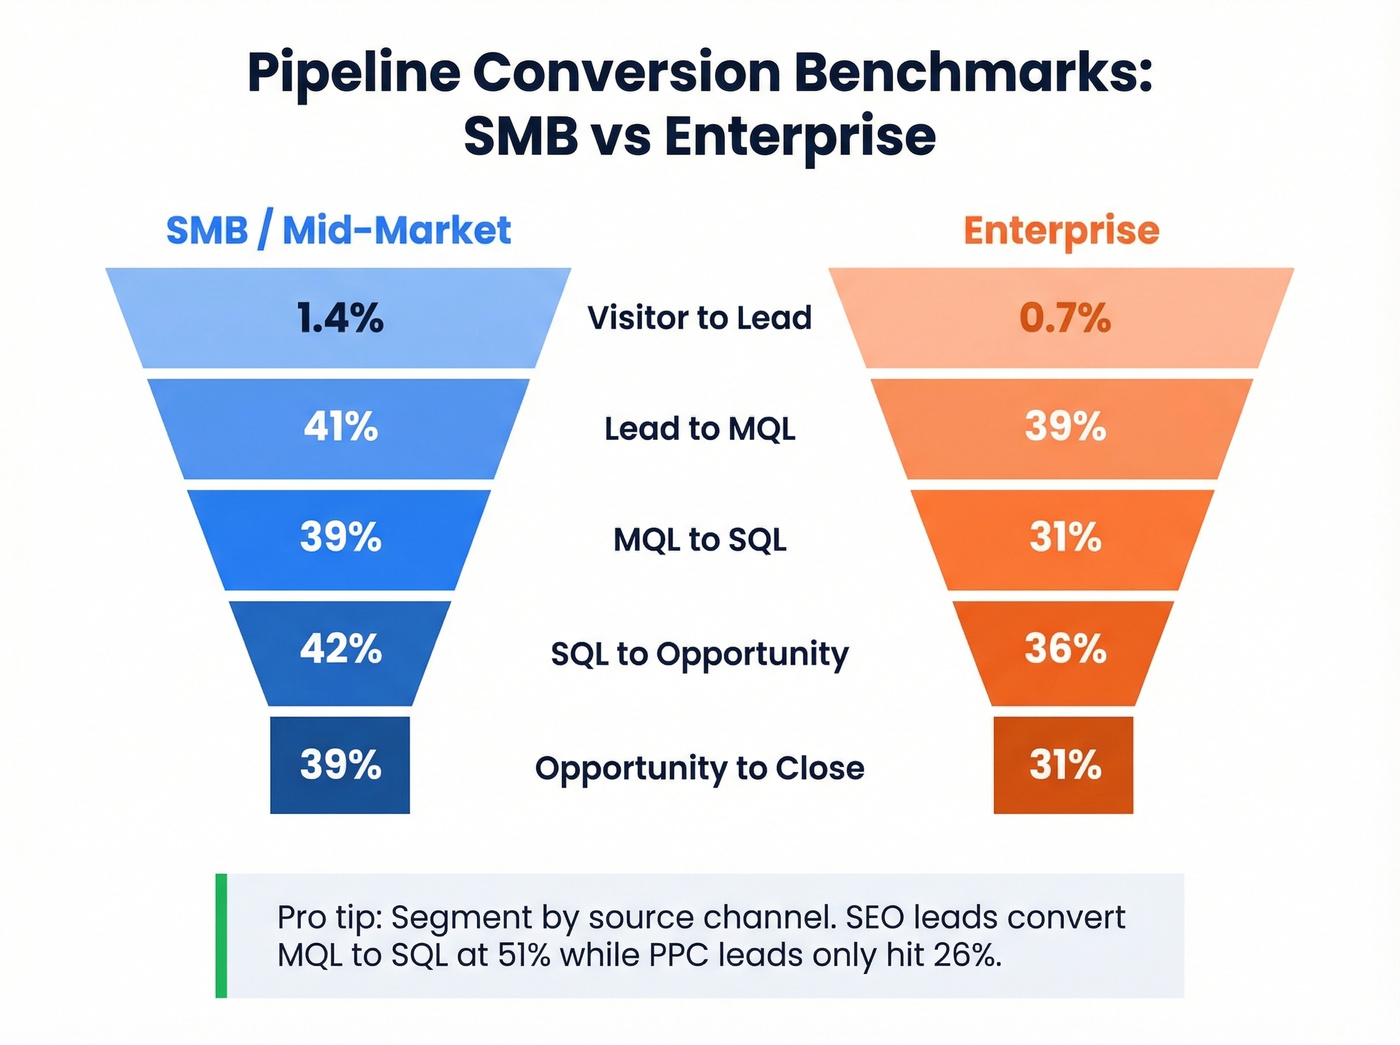
| Stage Transition | SMB / Mid-Market | Enterprise |
|---|---|---|
| Visitor to Lead | 1.4% | 0.7% |
| Lead to MQL | 41% | 39% |
| MQL to SQL | 39% | 31% |
| SQL to Opportunity | 42% | 36% |
| Opportunity to Close | 39% | 31% |
Source: Digital Bloom pipeline performance benchmarks, 2026 compilation of 40+ studies.
One detail most benchmarking articles skip: your channel mix changes these numbers dramatically. SEO-sourced leads convert from Visitor to Lead at roughly 2.1% with a 51% MQL-to-SQL rate. PPC leads? 0.7% Visitor to Lead and only 26% MQL to SQL. If your pipeline report doesn't segment by source channel, you're averaging away the signal.
Key Performance Benchmarks
| Metric | Benchmark Range | Notes |
|---|---|---|
| Win rate | 20-30% (avg 21%) | Below 15% = qualification issue |
| Median sales cycle | 84 days (optimal 46-75) | Enterprise skews longer |
| Pipeline velocity | $743-$2,456/day | Varies heavily by deal size |
| Forecast accuracy | 85% good, 90-95% elite | Below 75% = data problem |
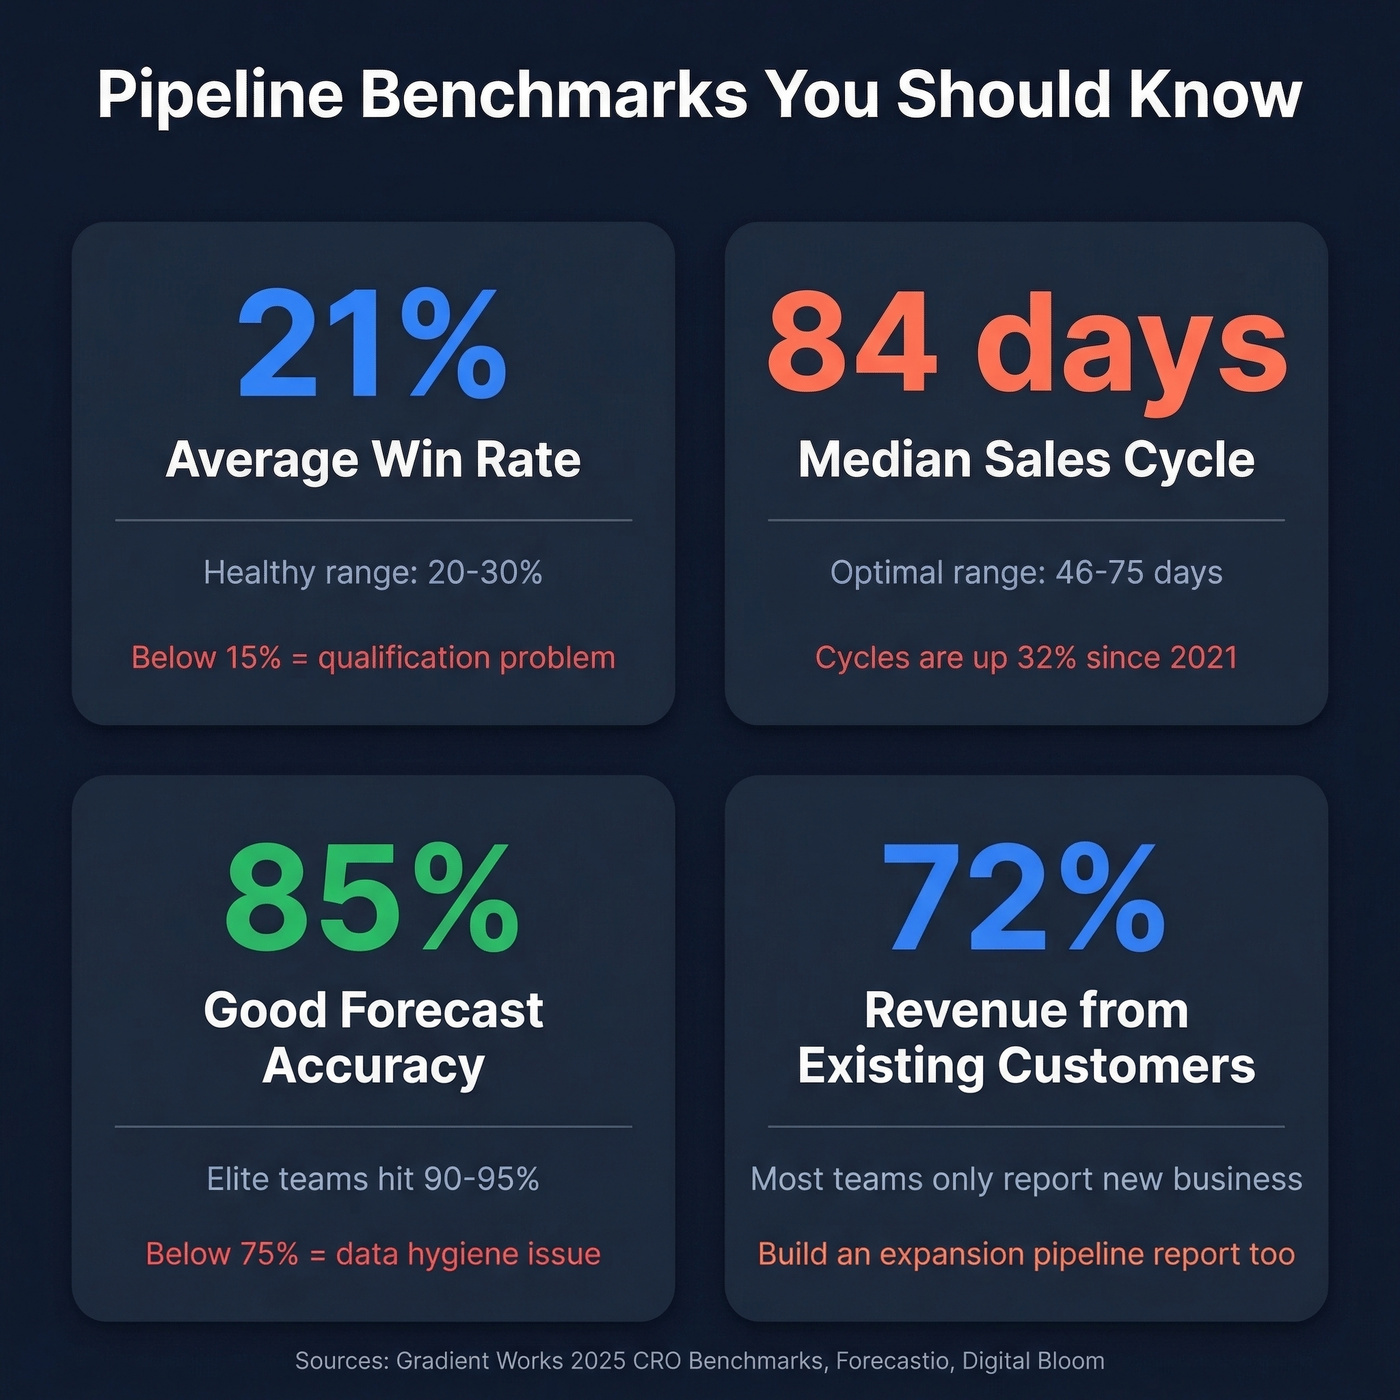
The trend that should worry you: sales cycles have lengthened by 32% since 2021. Enterprise cycles are up 36%, and even startups have seen a 24% increase. If your velocity metric is declining, you're not alone - but you need to know it's happening, and pipeline reporting is how you catch it.
One more stat worth sitting with: sales reps spend roughly two hours per day actually selling. The rest goes to admin, CRM updates, and internal meetings. Your reports should protect that selling time, not consume more of it.
72% of company revenue now comes from existing customers, yet most pipeline reports only track new business. If you're not building an expansion pipeline report alongside your new-deal pipeline, you're ignoring the majority of your revenue engine.
Core Reports Every Sales Leader Needs
Most pipeline reports are vanity dashboards. If yours doesn't tell you which three to five deals need intervention this week, it's decoration.
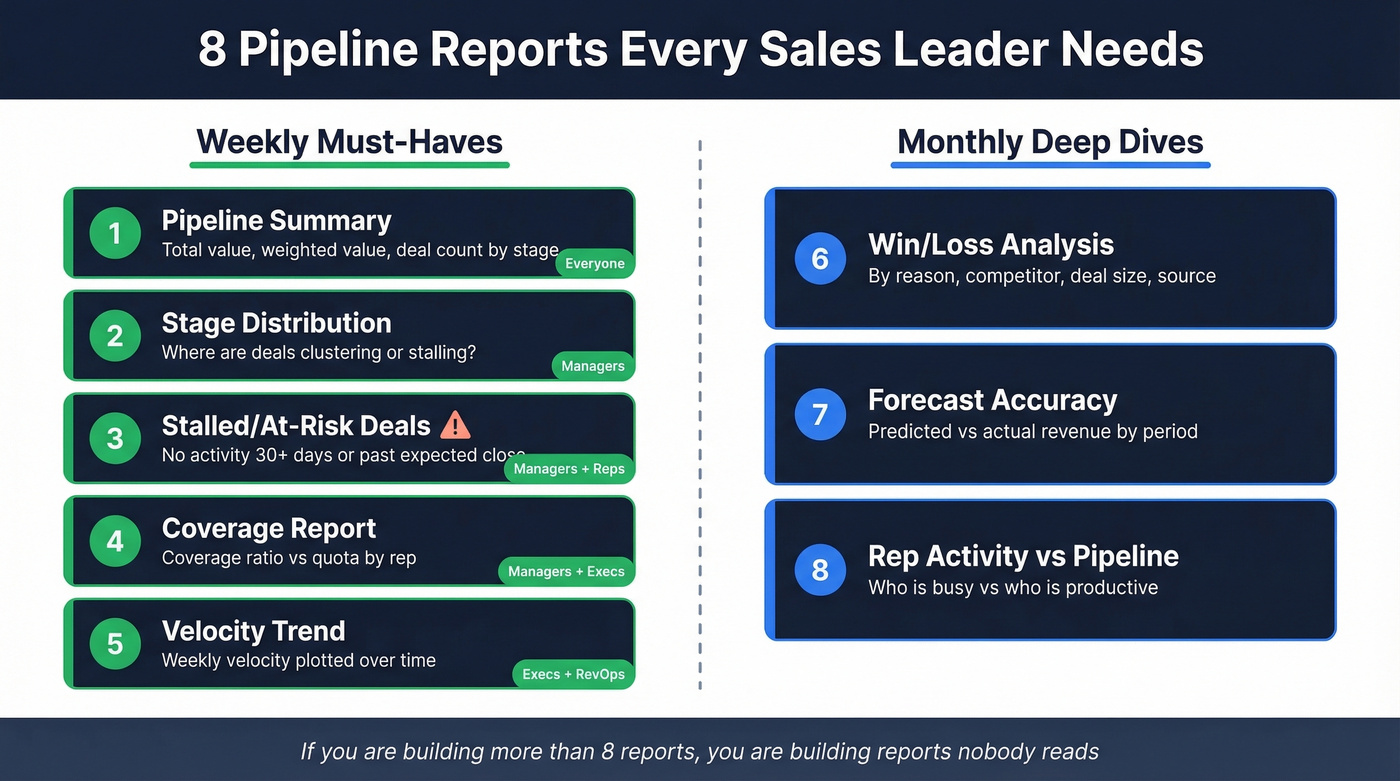
Pipeline summary - Total value, weighted value, deal count by stage. Audience: everyone. Answers: "How healthy is our pipeline right now?"
Stage distribution - Visual breakdown of deals by stage. Audience: managers. Answers: "Where are deals clustering or stalling?"
Stalled/at-risk deals - Deals with no activity for 30+ days, or past their expected close date. Audience: managers and reps. This is the report that saves quarters.
Coverage report - Coverage ratio vs. quota, broken out by rep. Audience: managers and execs. Answers: "Do we have enough pipeline to hit target?"
Velocity trend - Weekly or monthly pipeline velocity plotted over time. Audience: execs and RevOps. Answers: "Is our revenue engine speeding up or slowing down?"
Win/loss analysis - Closed deals segmented by reason, competitor, deal size, and source. Run monthly or quarterly.
Forecast accuracy tracking - Predicted vs. actual revenue by period. Run monthly.
Rep activity vs. pipeline contribution - Activity volume mapped against pipeline generated. Run monthly. Answers: "Who's busy vs. who's productive?"
The first five are non-negotiable for weekly reviews. If you're building more than eight reports, you're building reports nobody reads.
For teams under five reps who aren't ready for a full CRM, a well-structured Google Sheets template works. Close and Smartsheet both publish solid free templates with the right column structure. They break down at scale, but they beat a CRM nobody maintains.
Pipeline velocity drops when reps chase bad contact data. Prospeo delivers 98% verified emails and 125M+ direct dials - so every deal in your pipeline has a real person behind it. Stop inflating your report with dead leads.
Feed your pipeline real contacts, not bounced emails.
How to Run Pipeline Reviews That Don't Waste Time
Let's be honest: most pipeline review meetings are status-update theater. Reps recite deal updates they could've typed into the CRM. Managers nod. Everyone leaves with no clear actions. Salesforce's own guidance says it plainly - cancel your teamwide pipeline reviews. They're a hostage situation where 10 people sit through 9 updates that don't concern them.
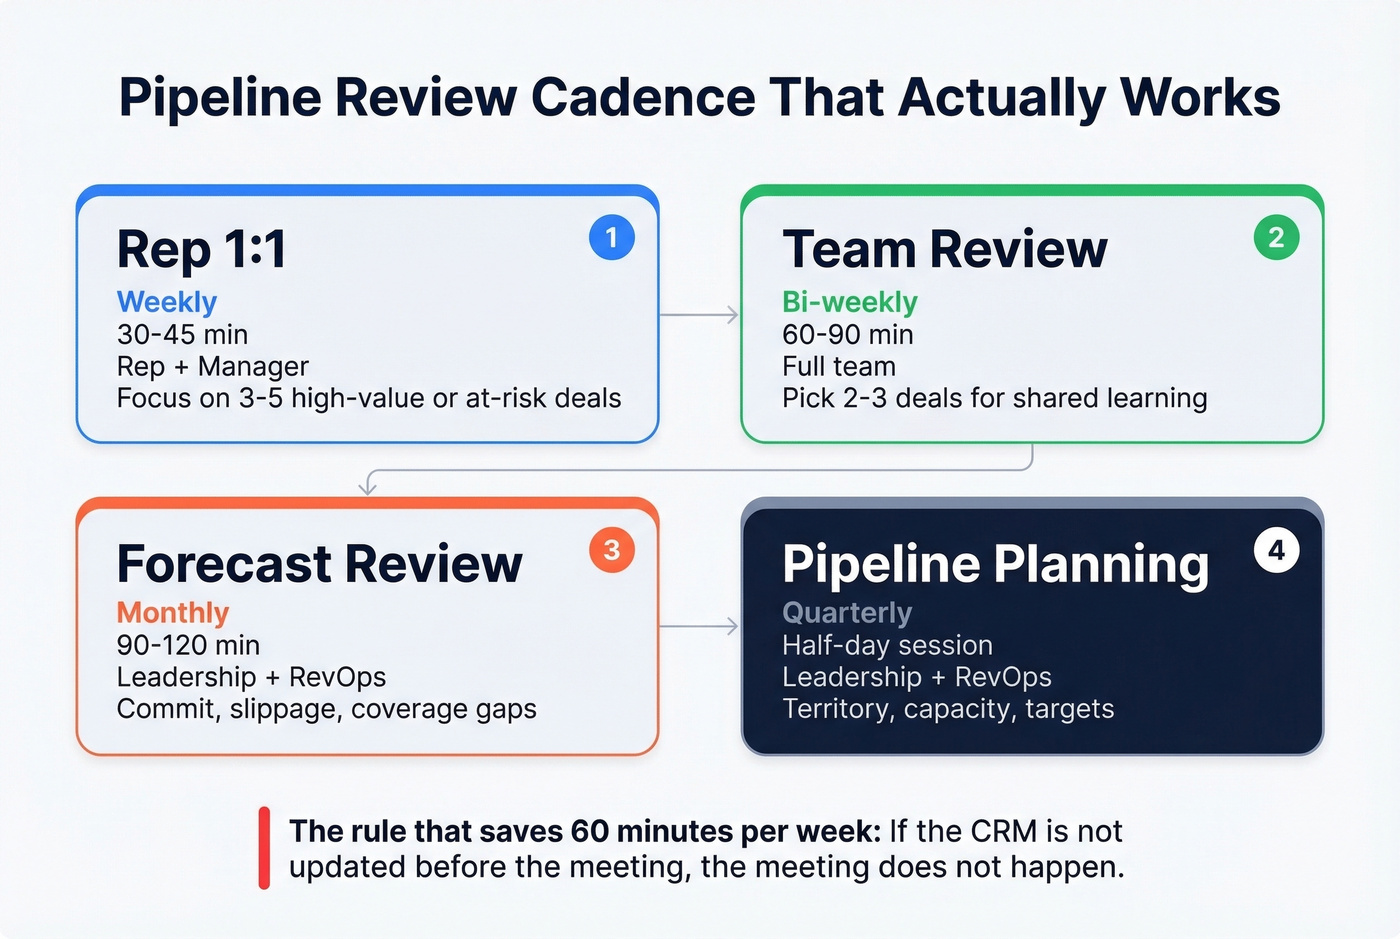
Review Cadence
| Review Type | Frequency | Duration | Attendees | Focus |
|---|---|---|---|---|
| Rep 1:1 | Weekly | 30-45 min | Rep + manager | 3-5 high-value/at-risk deals |
| Team review | Bi-weekly | 60-90 min | Full team | 2-3 deals for shared learning |
| Forecast review | Monthly | 90-120 min | Leadership + RevOps | Commit, slippage, coverage |
| Pipeline planning | Quarterly | Half-day | Leadership + RevOps | Territory, capacity, targets |
Deal Inspection Framework
Every deal reviewed in a 1:1 should follow this structure:
Context - What's the deal, who's involved, what stage is it in? Qualification validation - Run it through MEDDIC or BANT. Has anything changed? Progression evidence - What buyer action happened since last review? Not seller action - buyer action. That distinction matters. Risk assessment - What could kill this deal? Action plan - One to two specific next steps with owners and deadlines.
Pre-work is non-negotiable. Reps update CRM before the meeting. Managers review dashboards and flag warning signs - no activity, stage duration anomalies, missing contacts. If the CRM isn't updated, the meeting doesn't happen. That's the only way to enforce data discipline. We've seen managers cut review meetings from 90 minutes to 30 by enforcing this single rule.
A common complaint on r/sales is that pipeline reviews feel like micromanagement rather than coaching. The fix is simple: stop reviewing every deal. Focus each 1:1 on the three to five deals where manager input actually changes the outcome. Everything else gets handled through dashboards and automation.
Stage Exit Criteria
Pipeline bloat is the silent killer of forecast accuracy. Deals sit in stages for weeks because there's no objective definition of what "done" looks like. The fix is buyer-validated exit criteria - not seller activity checklists.
| Stage | Entry Criteria | Exit Criteria | DQ Signals |
|---|---|---|---|
| Prospecting | ICP match confirmed | Prospect agreed to meeting | No response after 8+ touches |
| Discovery | Meeting scheduled | Buyer acknowledged problem + impact | No pain identified |
| Qualification | Pain confirmed | Budget pathway + timeline identified | No budget, no timeline |
| Evaluation | Active evaluation | Buyer completed demo/POC + gave feedback | Ghosting, "RFP filler" signals |
| Proposal | Requirements agreed | Buyer reviewed proposal + gave feedback | No decision-maker access |
| Negotiation | Proposal accepted | Terms agreed, legal/procurement engaged | Stalled 30+ days |
| Closed-Won | Contract signed | Revenue booked | - |
The critical distinction: "rep completed discovery call" isn't an exit criterion. "Customer acknowledged the problem and confirmed the economic consequences" is. One measures seller activity. The other measures buyer commitment. Every stage gate should be anchored to something the buyer did.
When deals don't meet exit criteria, they should be disqualified or moved back - not left to rot. Pipeline bloat from dead deals is the number one reason forecasts miss.
Data Hygiene & Automation Rules
Manual pipeline cleanup doesn't scale. Strong data management is the foundation of trustworthy reporting - without it, every metric you track is built on sand. Here are five automation rules that keep your data honest without relying on reps to remember.
Auto-push stale close dates. Any open opportunity with a close date in the past gets automatically pushed 30 days forward. Increment a "Push Counter" field each time. Three pushes triggers a manager review.
Lock opportunity creation to lead conversion. Remove the ability to create opportunities directly from the Opportunity tab. Force creation through lead conversion or contact records. This prevents orphaned deals with broken attribution.
Auto-close stale early-stage deals. Pre-qualified opportunities with no activity in 30+ days get auto-closed as "Stale - No Activity." Deals with no activity for 30+ days are 80% less likely to close anyway.
Auto-close stale later-stage deals with a warning. For qualified+ opportunities, send a warning email to the rep and manager seven days before auto-close. Include a manager override checkbox. If nobody intervenes, the deal closes.
Admin hygiene dashboards. Build reports for opportunities owned by inactive users, past-due open deals, push counter leaderboard, and oldest qualified opportunities. Review monthly.
In our experience, teams that automate stale deal cleanup see forecast accuracy improve within one quarter. But pipeline hygiene starts before the CRM. If the emails in your pipeline bounce and the phone numbers are wrong, you're counting deals against contacts you can't reach. That's phantom pipeline. Prospeo catches this upstream - 98% email accuracy with a 7-day data refresh means contacts entering your pipeline are verified and current. Meritt saw their bounce rate drop from 35% to under 4% after switching, and their pipeline tripled from $100K to $300K per week.

Pipeline Reporting Tools Compared
Your CRM probably has native reporting. Whether it's good enough depends on your complexity and budget.
| Tool | Best For | Starting Price | Key Feature |
|---|---|---|---|
| HubSpot Sales Hub | Mid-market native reporting | ~$90/user/month | Built-in forecasting (Pro+) |
| Salesforce Sales Cloud | Enterprise customization | ~$25/user/month | Highly customizable reporting |
| Pipedrive | Small team simplicity | ~$14/user/month | Visual drag-and-drop pipeline |
| monday CRM | Visual dashboards | ~$12/seat/month | Widget-based reporting |
| Close | SMB velocity sales | ~$29/user/month | Built-in calling + pipeline |
| Zoho CRM | Budget-conscious teams | ~$14/user/month | Full suite at low cost |
| Apollo.io | Prospecting + pipeline | Free / paid from ~$49/user/month | Database + CRM hybrid |
| Freshsales | Startups | Free / paid from ~$9/user/month | AI-powered deal insights |
Other options worth evaluating: Copper (~$23/user/month) for Google Workspace teams, Salesflare (~$29/user/month) for automated data entry.
For pipeline intelligence - a layer that flags deal risk like stalled deals, close date slips, and amount drops - look at Gong, Clari (typically $100K-$150K/year for enterprise), or UnifiedPipeline ($499/mo) for mid-market teams.
Skip the expensive intelligence tools if you're under 20 reps. The ROI doesn't justify it until you have enough deal volume to surface patterns. A well-configured CRM with the automation rules above will get you 80% of the way there.
The best reporting tool is the one your reps actually update. A $14/mo Pipedrive instance with disciplined data entry will outperform a $25K Salesforce implementation that nobody maintains.
Turning Pipeline Data Into Action
Reports that sit in a dashboard tab accomplish nothing. The entire point of building sales pipeline reports is to turn data into specific interventions that change deal outcomes this week - not insights you'll "get to eventually."
Here's the framework we use: every report has a trigger threshold and a corresponding playbook move. If coverage drops below your required ratio, that triggers a prospecting sprint. Velocity declining two weeks in a row? That triggers a deal-by-deal review of cycle length drivers. Stale deals exceeding 20% of total pipeline? Cleanup blitz. Without these predefined triggers, you're just reading numbers and hoping someone does something about them.
The teams that get the most from pipeline reporting aren't the ones with the fanciest dashboards. They're the ones who've decided in advance what each number means and what they'll do when it moves.
FAQ
What's the difference between a pipeline report and a sales forecast?
A pipeline report is a current snapshot of deals by stage and value - it shows what's in your funnel right now. A sales forecast takes that data and predicts revenue for a future period by applying win probabilities and historical patterns. The report is the input; the forecast is the output.
How often should I review my pipeline?
Hold weekly one-on-ones between rep and manager, 30 minutes max, focused on three to five at-risk deals. Run monthly forecast reviews for leadership. Skip teamwide pipeline reviews - they waste everyone's time.
What's a good pipeline coverage ratio?
It depends entirely on your win rate. A 20% win rate requires 5x coverage; a 40% win rate needs only 2.5x. Calculate yours with Required Coverage = 1 / Win Rate. The blanket "always aim for 3x" advice ignores your actual close rate.
How do I fix stale deals clogging my pipeline?
Auto-close early-stage opportunities with no activity in 30+ days - they're 80% less likely to close anyway. For later-stage deals, send a warning email to the rep and manager, include a manager override window, and auto-close if nobody acts within seven days.
How does contact data quality affect pipeline accuracy?
Bad emails and wrong phone numbers inflate your pipeline with unreachable leads - deals that look real but can't progress. Verifying contact data before it enters your CRM prevents phantom pipeline from skewing every metric you track.
72% of revenue comes from existing customers, but most pipeline reports run on stale data. Prospeo refreshes every 7 days - not 6 weeks - so your coverage ratio reflects reality, not last quarter's org chart.
Reports built on weekly-refreshed data actually mean something.