Sales Variance Formula: Every Formula + Examples (2026)
You missed your quarterly revenue target by $50,000. The CFO wants to know why. "We sold fewer units" isn't an answer - it's a symptom. The real question is whether you lost on price, volume, mix, or all three. That's what the sales variance formula tells you, and most finance teams get the decomposition wrong.
What You Need (Quick Version)
The core formula is simple:
Actual Sales - Budgeted Sales = Total Sales Variance
But total variance alone is useless for decision-making. You need to decompose it. Three formulas cover most real-world needs:
- Price variance - did you sell at a different price than planned?
- Volume variance - did you sell more or fewer units than planned?
- Mix variance - did the product mix shift toward higher- or lower-priced items?
A common hierarchy looks like: Total -> Price + Volume -> Mix + Quantity -> Market Size + Market Share.
One nuance upfront: Mix + Quantity always reconciles to Volume when you use the standard "actual volume at budgeted mix" method. Market Size + Market Share reconciles to Quantity under the market-based model. But Price + Volume may or may not reconcile cleanly to Total depending on the base you use - that's where the interaction term comes in. We cover it below.
What Is Sales Variance?
Sales variance measures the gap between what you planned to sell and what you actually sold:
Sales Variance = Actual Sales - Budgeted Sales
A positive result is favorable - you beat the plan. Negative is unfavorable. Straightforward enough.
The hard part is figuring out why. Did pricing change? Did volume drop? Did your product mix shift? HighRadius estimates that 60% of finance teams still run variance analysis manually, which means many teams stop at the total number and guess at the causes. Real variance analysis decomposes the total into components you can actually act on.
The Variance Decomposition Tree
Every formula in the sales variance family fits into a hierarchy. Understanding the tree prevents you from double-counting or missing a component.
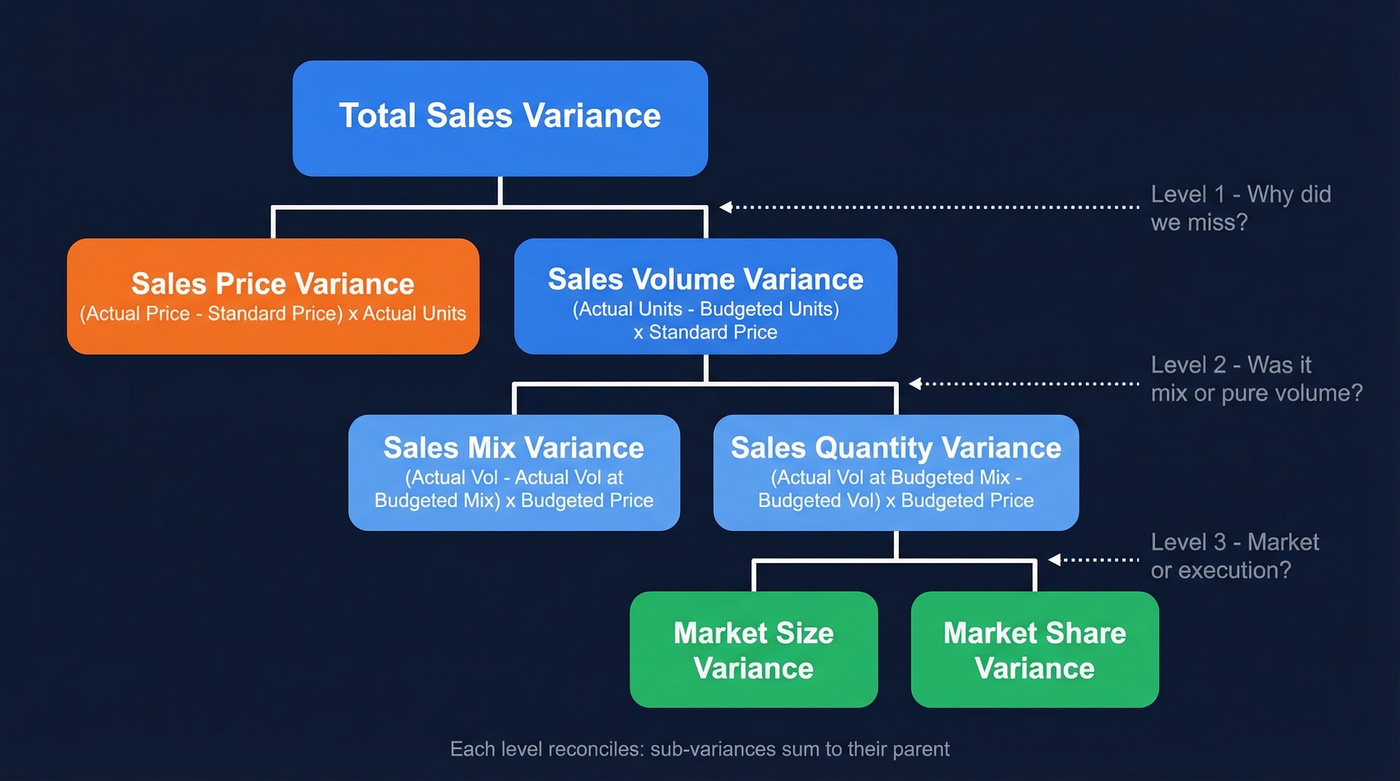
Total Sales Variance
├── Sales Price Variance
└── Sales Volume Variance
    ├── Sales Mix Variance
    └── Sales Quantity Variance
        ├── Market Size Variance
        └── Market Share Variance
Mix + Quantity = Volume. Market Size + Market Share = Quantity. If your sub-variances don't sum to their parent, you've either made a math error or you're mixing decomposition methods.
Every Formula With Worked Examples
Sales Price Variance
Formula: (Actual Price - Standard Price) x Actual Units Sold
This isolates the revenue impact of selling at a different price than budgeted, holding volume at actual levels.
Worked example: You budgeted 15,000 units at $4.80 each. You actually sold 13,500 units at $5.50.
Price variance = ($5.50 - $4.80) x 13,500 = +$9,450 (favorable)
You charged more per unit than planned. The favorable price variance confirms the pricing lever worked - but as we'll see next, it may have cost you volume.
Sales Volume Variance
Formula: (Actual Units - Budgeted Units) x Standard Price
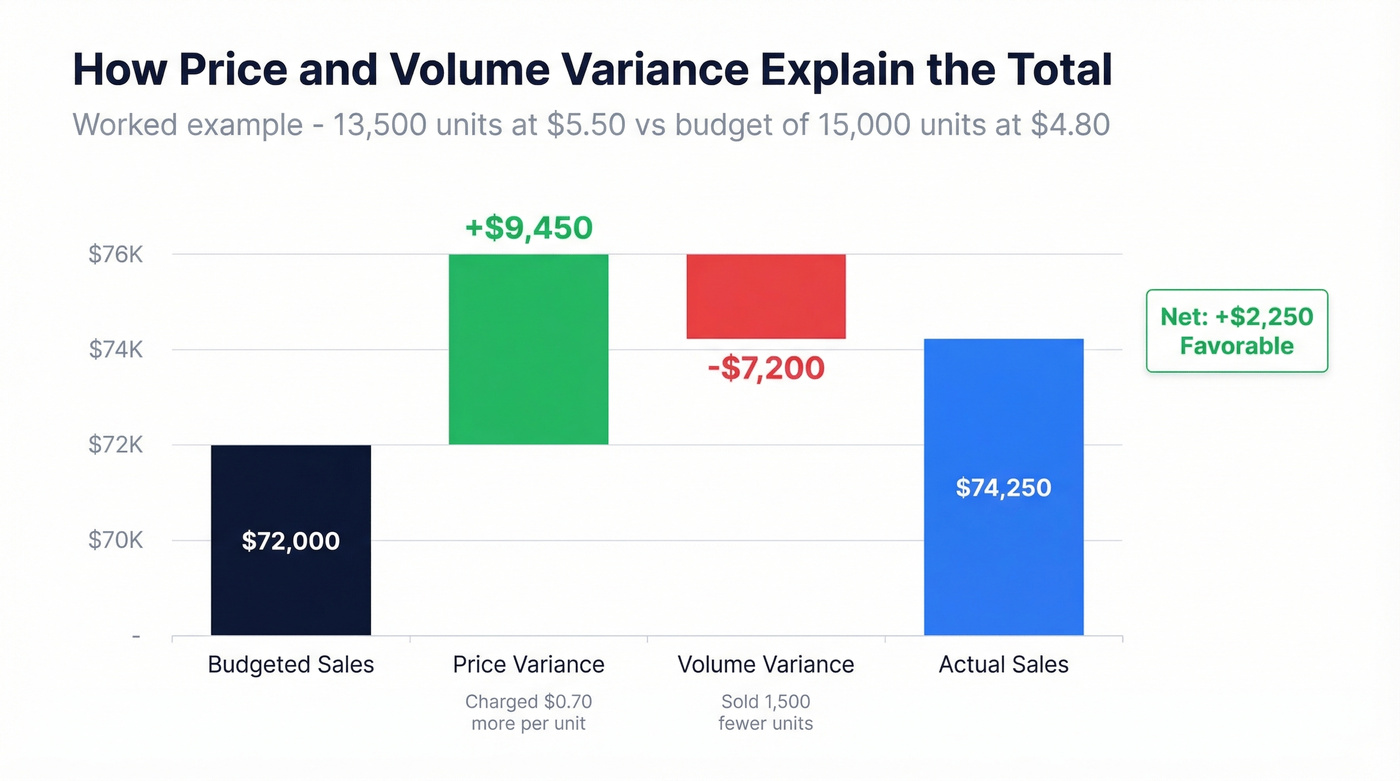
This captures the revenue impact of selling a different quantity than planned, using the budgeted price as the multiplier.
Continuing our example: (13,500 - 15,000) x $4.80 = -$7,200 (unfavorable)
You sold 1,500 fewer units than planned. At the budgeted price, that's $7,200 in lost revenue. Combined with the price variance: $9,450 + (-$7,200) = $2,250 favorable total. The price increase more than offset the volume decline - but you'd never see that nuance from the total alone.
Here's a critical distinction that gets overlooked in practice: the multiplier depends on your costing method. Use standard profit per unit for absorption costing, which aligns with GAAP and external reporting. Use standard contribution per unit for marginal costing, which reflects decision-relevant costs for internal analysis. Mixing these in the same report produces misleading results.
Sales Mix Variance
Did the composition of what you sold help or hurt revenue? That's the question mix variance answers - and it matters whenever you sell multiple products at different price points.
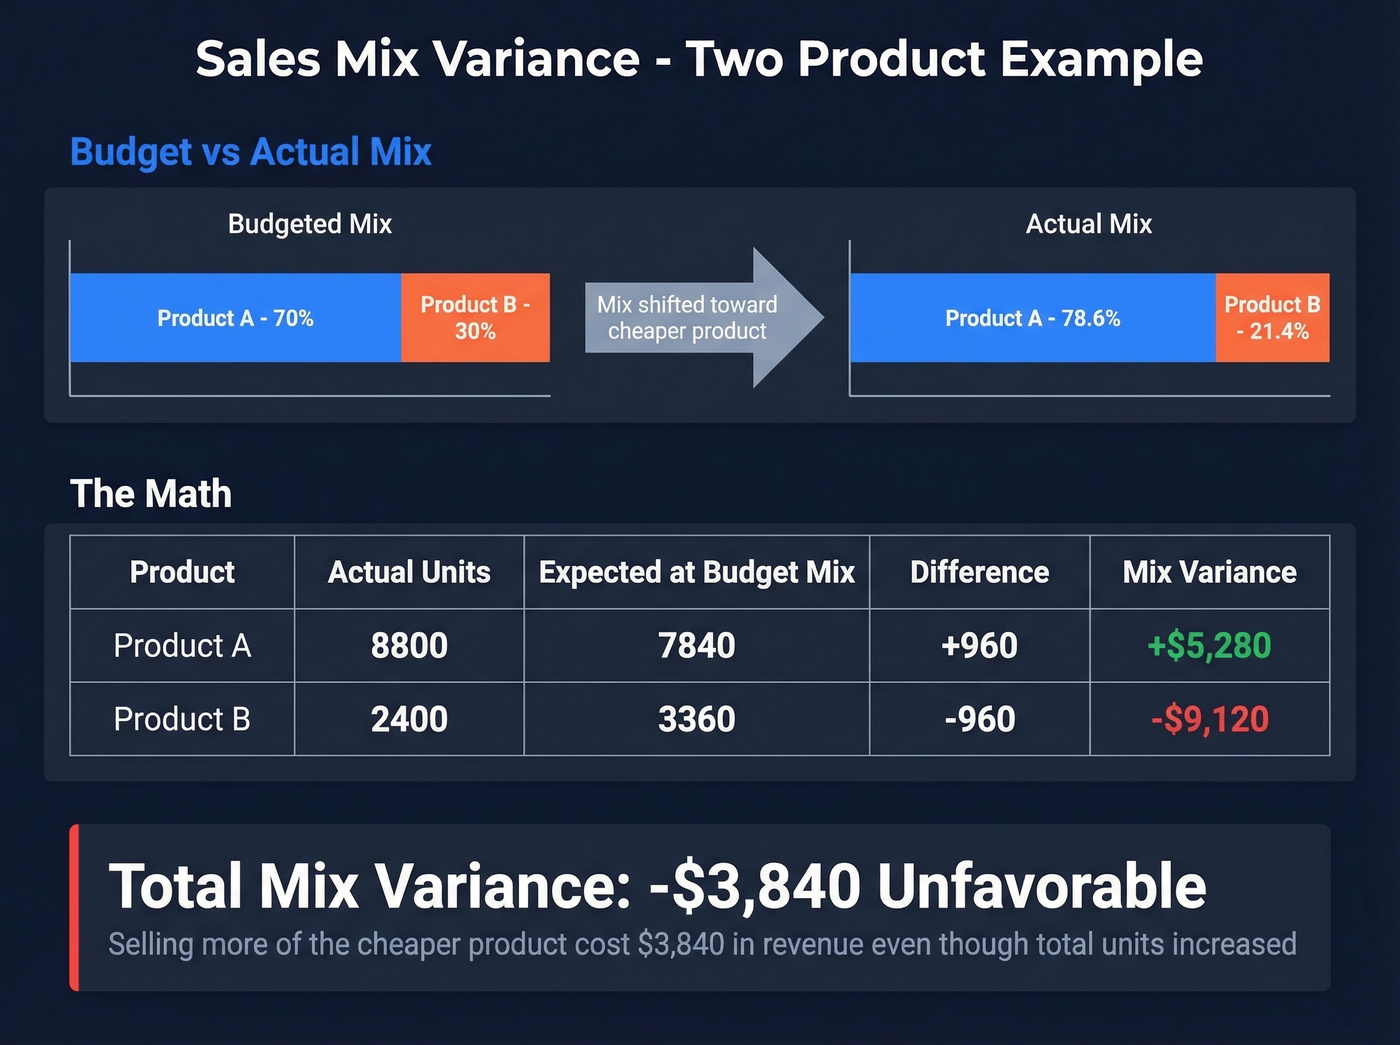
Formula: (Actual Volume - Actual Volume at Budgeted Mix) x Budgeted Price
Let's work through a two-product example.
Budget: Product A: 7,000 units @ $5.50. Product B: 3,000 units @ $9.50. Total: 10,000 units.
Actual: Product A: 8,800 units @ $5.20. Product B: 2,400 units @ $10.10. Total: 11,200 units.
Step 1 - Budgeted mix percentages:
- Product A: 7,000 / 10,000 = 70%
- Product B: 3,000 / 10,000 = 30%
Step 2 - Actual volume at budgeted mix:
- Product A: 11,200 x 70% = 7,840
- Product B: 11,200 x 30% = 3,360
Step 3 - Mix variance per product:
- Product A: (8,800 - 7,840) x $5.50 = +$5,280
- Product B: (2,400 - 3,360) x $9.50 = -$9,120
Total mix variance: -$3,840 (unfavorable)
You sold more total units, but the mix shifted toward the cheaper Product A and away from premium Product B. That shift cost $3,840 in revenue despite higher overall volume. Some frameworks calculate "pure volume" by holding mix constant - that's exactly what the quantity variance formula does below.
Sales Quantity Variance
The reconciliation proof is the real payoff here. It's the part most teams never check, and it's your single best error-detection tool.
Formula: (Actual Volume at Budgeted Mix - Budgeted Volume) x Budgeted Price
Continuing the two-product example:
- Product A: (7,840 - 7,000) x $5.50 = +$4,620
- Product B: (3,360 - 3,000) x $9.50 = +$3,420
Total quantity variance: +$8,040 (favorable)
Now the proof:
Mix (-$3,840) + Quantity (+$8,040) = Volume (+$4,200)
If your numbers don't reconcile like this, go back and check your budgeted mix percentages. This proof is your sanity check.
Market Size and Share Variance
These formulas decompose quantity variance one level further, separating market conditions from your team's execution. They're powerful when you have reliable industry data - and misleading when you don't.
Market Share Variance: (Actual Share % - Budgeted Share %) x Total Market Units x Margin per Unit
Market Size Variance: (Actual Market Units - Budgeted Market Units) x Budgeted Share % x Margin per Unit
Quick example: You budgeted 10% share of a 500,000-unit market at $2.00 margin per unit. Actual results: 11% share of a 480,000-unit market.
- Market Share Variance: (11% - 10%) x 480,000 x $2.00 = +$9,600 (favorable)
- Market Size Variance: (480,000 - 500,000) x 10% x $2.00 = -$4,000 (unfavorable)
- Combined: +$9,600 + (-$4,000) = +$5,600 = Sales Quantity Variance (in margin dollars under this market-based model)
Your team gained share - good execution. But the market shrank, partially offsetting those gains. That distinction drives completely different strategic responses.
The limitations are real, though. As AccountingTools notes, market share variance can incentivize unprofitable discounting to chase share. It also requires reliable market data, and in many B2B segments, TAM estimates are guesses at best. Use these when you have trustworthy industry data. Skip them when market sizing is speculative.
Unfavorable volume variance usually means your pipeline dried up - not that your product failed. Prospeo gives sales teams 300M+ verified profiles with 30+ filters so you never miss quota because you ran out of qualified prospects.
Close the volume gap with data that actually connects you to buyers.
Why Your Variances Don't Add Up
If you've ever run price and volume calculations and found they don't sum to total variance, you're not making an error. You're hitting the interaction term.
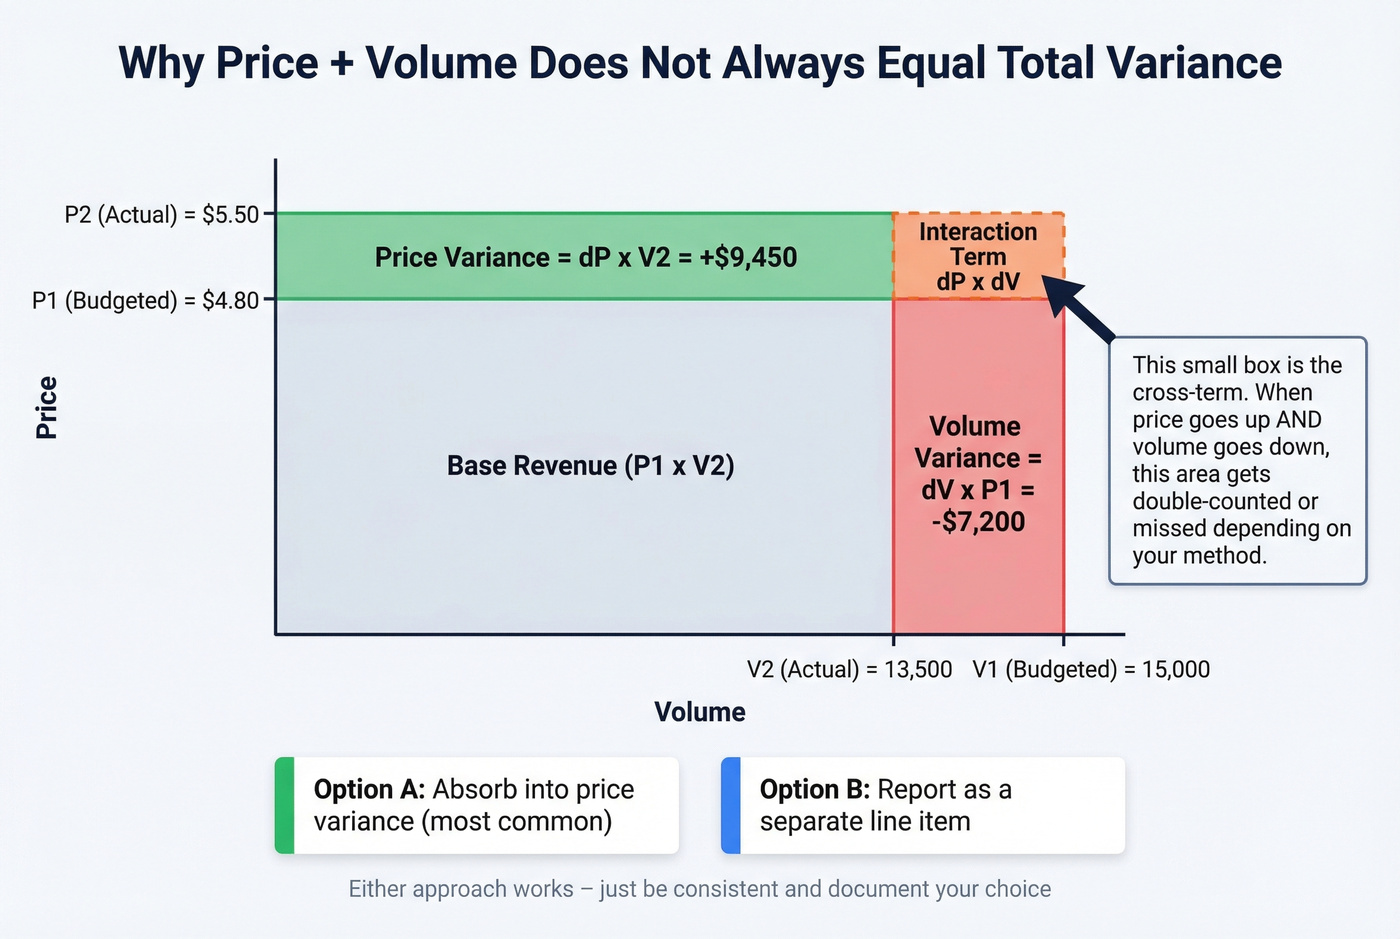
The mathematical identity is:
(P2 x V2) - (P1 x V1) = dP x V1 + dV x P1 + dP x dV
That last term - dP x dV - is the cross-term. It represents the revenue effect of price and volume changing simultaneously.
In our earlier example, the standard formulas use different bases (actual units for price variance, standard price for volume variance), which absorbs the interaction term into the sub-variances. But if you use the same base for both - say, prior-period values - you'll see a gap. This is exactly the problem FP&A practitioners flag on r/FPandA: "price variance + volume variance doesn't tie to total change."
Two standard practices for handling it: allocate the interaction term to price variance since pricing is the more controllable lever, or report it as a separate line item. Either works. Just be consistent and document your choice.
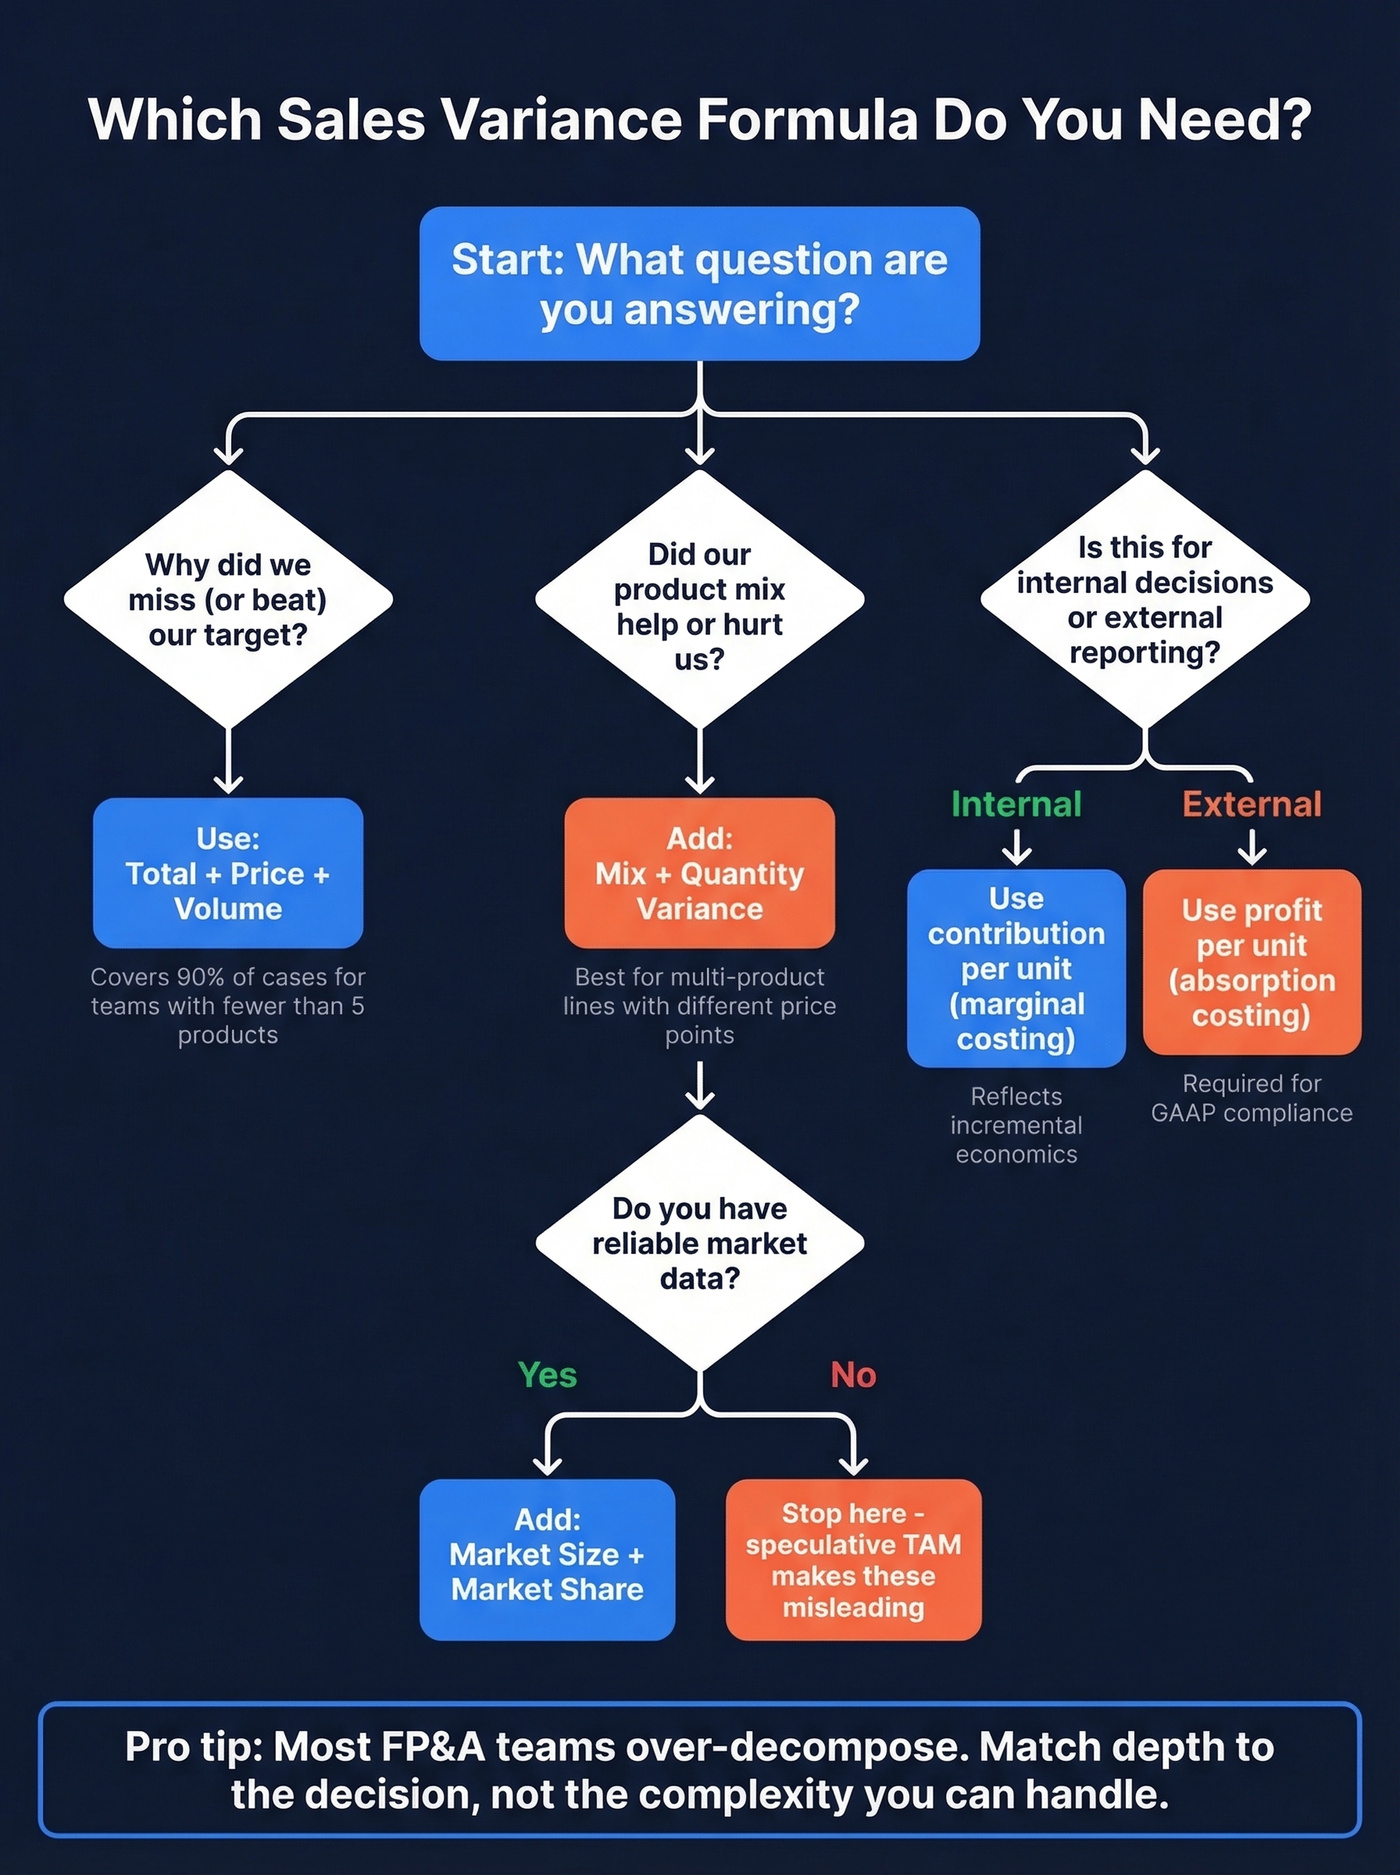
Choosing the Right Formula
Not every analysis requires every formula. Match the decomposition depth to the question you're answering.
| Scenario | Formula(s) | Why |
|---|---|---|
| CFO asks why you missed target | Total + Price + Volume | Covers the two primary drivers |
| Product mix shifted, units flat | Mix Variance | Isolates composition effect |
| Market conditions vs. execution | Market Size + Market Share | External vs. internal split |
| Internal pricing decision | Use contribution/unit (marginal) | Reflects incremental economics |
| External financial reporting | Use profit/unit (absorption) | GAAP compliance |
| Both price and volume changed | Include interaction term | Prevents unexplained residual |
Let's be honest: most FP&A teams over-decompose. If you're selling fewer than five products and your average deal size is under $50K, Price + Volume gets you 90% of the insight. Mix and quantity variance add precision, but they also add complexity that smaller teams rarely act on. Save the full decomposition for quarterly strategic reviews, not weekly pipeline calls.
The absorption vs. marginal choice matters more than most teams realize. Using absorption costing for an internal pricing decision bakes in fixed overhead allocation that has nothing to do with the incremental economics of that decision. Using marginal costing for external reporting violates GAAP. Match the method to the audience.
Common Mistakes in Variance Analysis
Stopping at total variance. A $50K miss could be $80K unfavorable volume partially offset by $30K favorable pricing. Those require completely different responses - one is a pipeline problem, the other might be a market contraction. Total variance tells you nothing actionable.
Ignoring the interaction term. When both price and volume change, your sub-variances won't tie to total without accounting for dP x dV, depending on the method you're using. We've seen finance teams spend hours hunting for "errors" that are just the missing cross-term.
Confusing gross margin % with gross margin $. This trips up even experienced analysts. Volume changes affect margin dollars but don't necessarily change margin percentage if incremental units carry the same margin profile as forecast. The percentage decomposition is genuinely tricky, and r/FPandA threads show this is a widespread pain point. If your CFO asks "why did margin drop?" make sure you clarify whether they mean the rate or the dollars before you start decomposing.
Mixing costing methods in the same analysis. Using standard profit per unit for one product and standard contribution per unit for another within the same variance report produces numbers that don't reconcile and can't be compared. Pick one method per report.
Forcing variance formulas on new products. Standard variance analysis requires a budget baseline. For products launched mid-period with no budget to compare against, the formulas produce meaningless results. Use contribution margin analysis instead - compare actual contribution to the business case projection, not to a budget that doesn't exist.
Ignoring external drivers. Seasonality, competitor pricing moves, and supply chain disruptions all create variance that has nothing to do with your team's execution. Before blaming sales leadership for an unfavorable volume variance, check whether the entire market contracted. The addressable market framework (TAM/SAM/SOM) helps sanity-check whether your market sizing assumptions were realistic in the first place. The market size variance formula exists for exactly this reason.
Setting Up Variance Analysis in Excel
Keep it simple. No macros, no VBA - transparent formulas that anyone on the team can audit.
Recommended column structure:
Product | Budget Units | Actual Units | Budget Price | Actual Price | Budget Revenue | Actual Revenue | Price Var | Volume Var | Mix Var | Total Var
Build monthly tabs with this layout, then create an annual summary tab that pulls totals. The Farseer PVV template follows a similar structure with Plan vs. Actual inputs for price, volume, and discounts - worth downloading as a starting point.
Add a reconciliation check column that verifies sub-variances sum to total variance. This is your error-detection mechanism. If the check column ever shows a non-zero value, something's broken upstream. Numeric's variance analysis guide covers additional Excel structuring tips for teams running monthly close processes, and CFI's breakdown of sales variance is a solid reference for the underlying accounting treatment.
If you’re tying variance analysis back to execution, it also helps to track pipeline health and compare against sales pipeline benchmarks so you can tell whether a volume miss is a rep-level issue or a top-of-funnel issue.
Your mix variance shifts unfavorable when reps can't reach premium buyers. With 98% email accuracy and 125M+ verified mobile numbers, Prospeo connects your team to the decision-makers who buy your highest-margin products.
Stop losing revenue to bad contact data - start reaching the right buyers.
FAQ
What's the difference between sales variance and revenue variance?
They're used interchangeably in most contexts. "Sales variance" typically refers to actual-vs-budgeted differences in units or dollars, while "revenue variance" specifically means the dollar gap in top-line revenue. Both decompose into price and volume components using identical formulas.
Can variance formulas apply to services, not just products?
Yes. Replace "units sold" with billable hours, subscriptions, or service engagements and "price per unit" with hourly rate or subscription price. SaaS teams commonly use these formulas with MRR as the revenue base and customer count as volume - the math works identically.
How do you calculate sales price variance?
Sales price variance = (Actual Price - Standard Price) x Actual Units Sold. It isolates the revenue impact of selling at a different price than budgeted. A positive result means you charged more than planned; a negative result signals discounting or pricing pressure. Always pair it with volume variance for the full picture.
How often should you run variance analysis?
Monthly at minimum for operational decisions, quarterly for strategic reviews. Weekly cadence suits high-velocity sales teams where pipeline changes rapidly. When volume shortfalls appear in consecutive periods, the root cause is often pipeline depth - tools like Prospeo help close that gap with verified emails and 30+ prospecting filters to build targeted lists fast.