How to Calculate Your Serviceable Available Market (SAM) - With Real Examples
You've got no customers, no revenue, and an investor just asked for your SAM. The math itself is simple. It's finding accurate inputs that kills most founders. Here's how to build a defensible serviceable available market number from scratch, with real worked examples and the data sources that actually work.
What You Need (Quick Version)
SAM in one sentence: the slice of your total market you can realistically sell to today, given your product, geography, and go-to-market constraints.
The formula (most common bottom-up version): Target accounts/customers x annual value per account (ACV) = SAM. If you price per seat or usage, expand it: target accounts x average seats/usage x price.
The key insight: bottom-up beats top-down every time. Saying "we'll capture 1% of a $1B market" is hand-waving. Counting the actual companies you can serve and multiplying by what you charge is defensible.
Where to get company counts: Census Bureau data gives you broad industry totals. B2B databases let you filter by ICP criteria - industry, headcount, geography, tech stack - to get the specific segment count you need for bottom-up math.
Jump to: Worked Examples | Data Sources | No Sales Data?
What Is Serviceable Available Market?
Your serviceable available market is the portion of the total addressable market (TAM) that your business can actually reach and serve with its current product, pricing, and distribution. It's the revenue opportunity inside the segment you can serve today - not the segment you hope to serve in three years after a Series B and two pivots.
"Serviceable Available Market" and "Serviceable Addressable Market" are used interchangeably across the industry. "Available" emphasizes what's reachable now; "Addressable" emphasizes what you can target. Same metric, different emphasis. Don't let anyone tell you they're different concepts.
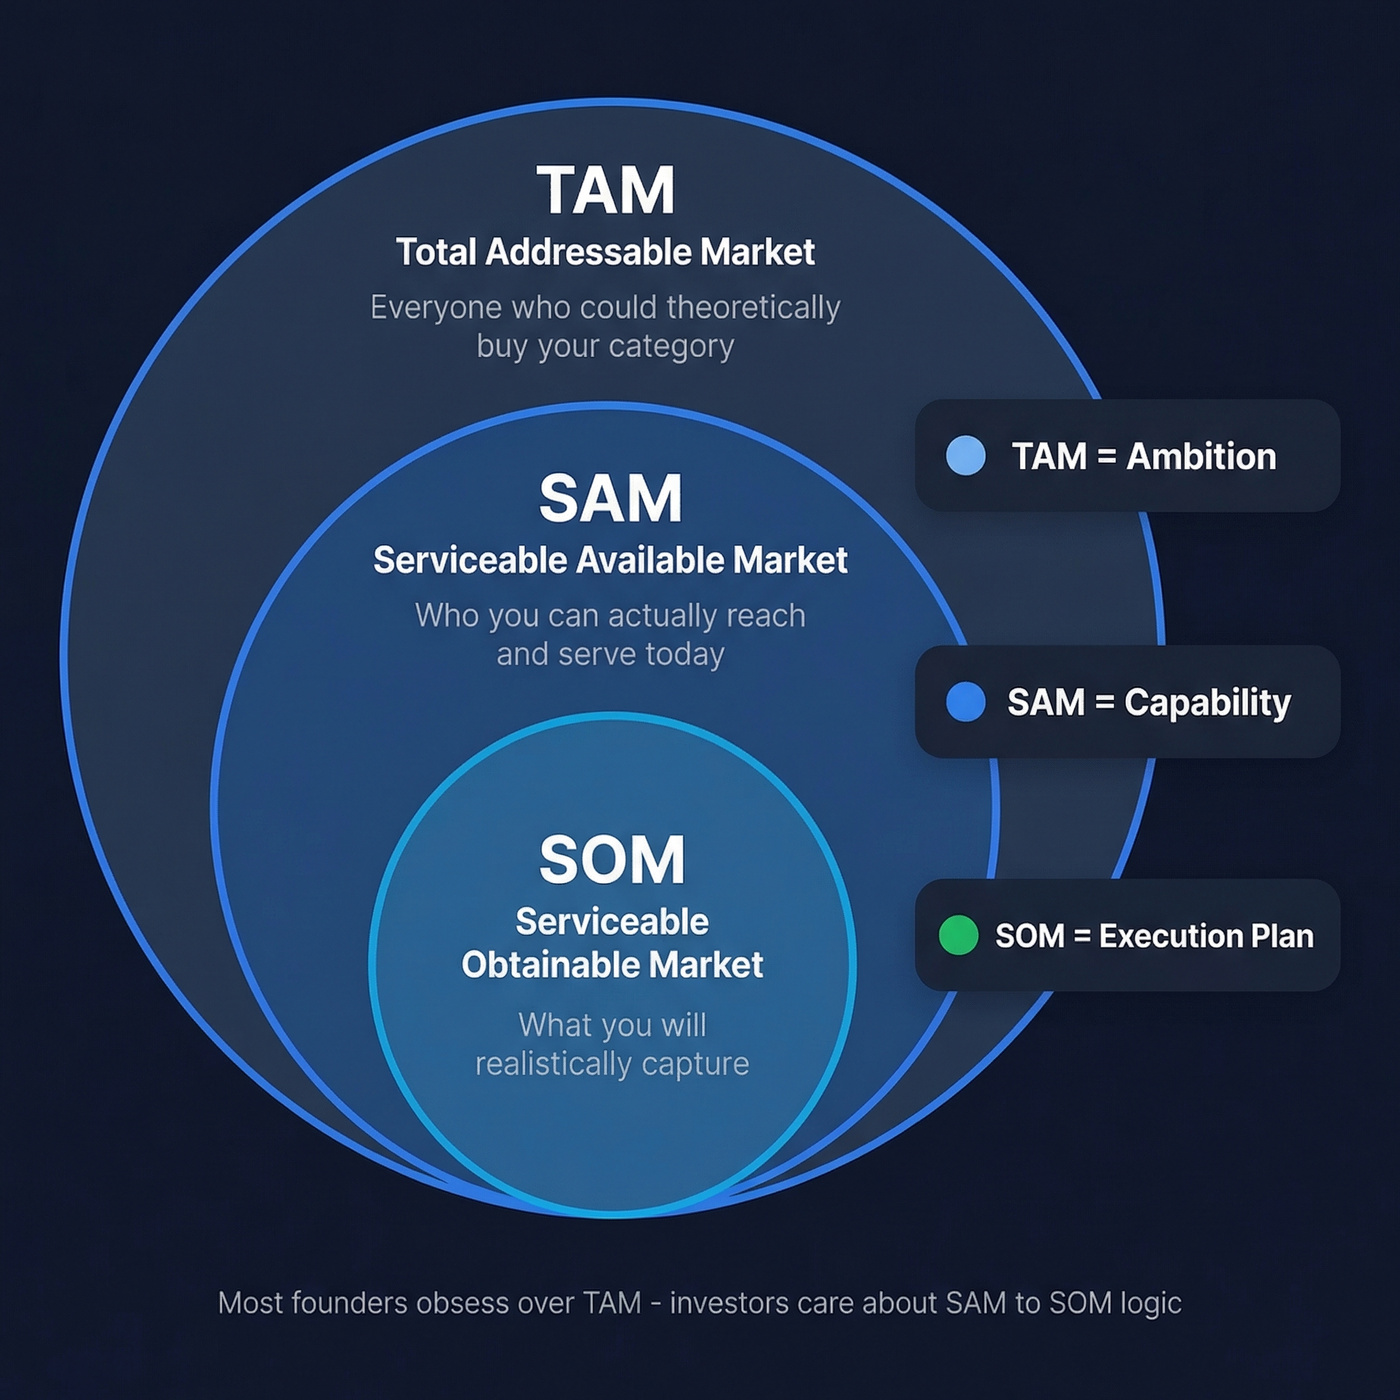
The hierarchy works like concentric circles:
- TAM (Total Addressable Market): Everyone who could theoretically buy your category of product.
- SAM (Serviceable Available Market): The subset you can serve with your current product and go-to-market constraints.
- SOM (Serviceable Obtainable Market): The subset you'll realistically capture in a given timeframe.
The practical SAM test: "If this customer came to us organically, could we actually sell to them?" If yes, they're in your SAM. If not - wrong geography, wrong size, or they need a feature you don't have - they're TAM, not SAM.
SAM vs TAM vs SOM
Stop obsessing over TAM. Investors don't fund TAM - they fund your ability to capture SOM. Here's how the three relate:
| Term | Definition | Formula | Who Cares Most |
|---|---|---|---|
| TAM | Total demand for your product category | All potential buyers x annual value | VCs (ambition check) |
| SAM | What you can realistically target and serve | Target accounts x annual value | Founders + investors |
| SOM | What you'll actually capture | SAM x expected share % | Operators + board |
TAM is your ambition. SAM is your capability. SOM is your execution plan.
Most pitch decks spend 80% of their market slide on TAM, which is exactly backwards. The number investors scrutinize is your SAM-to-SOM logic - how you get from "could sell to" to "will sell to." We've reviewed dozens of early-stage decks, and the ones that get funded fastest almost always lead with a tight SAM, not a bloated TAM.
How to Calculate SAM
Top-Down Approach
Start with a published market size number from Gartner, IBISWorld, or similar and narrow it by your segment's percentage. For example: "The global HR software market is $30B. We serve UK SMBs, which represent roughly 2% of that market. Top-down SAM: ~$600M."
This is useful as a sanity check, not as your primary method. Use top-down to validate, not to lead.
Bottom-Up Approach
This is the method that earns credibility:
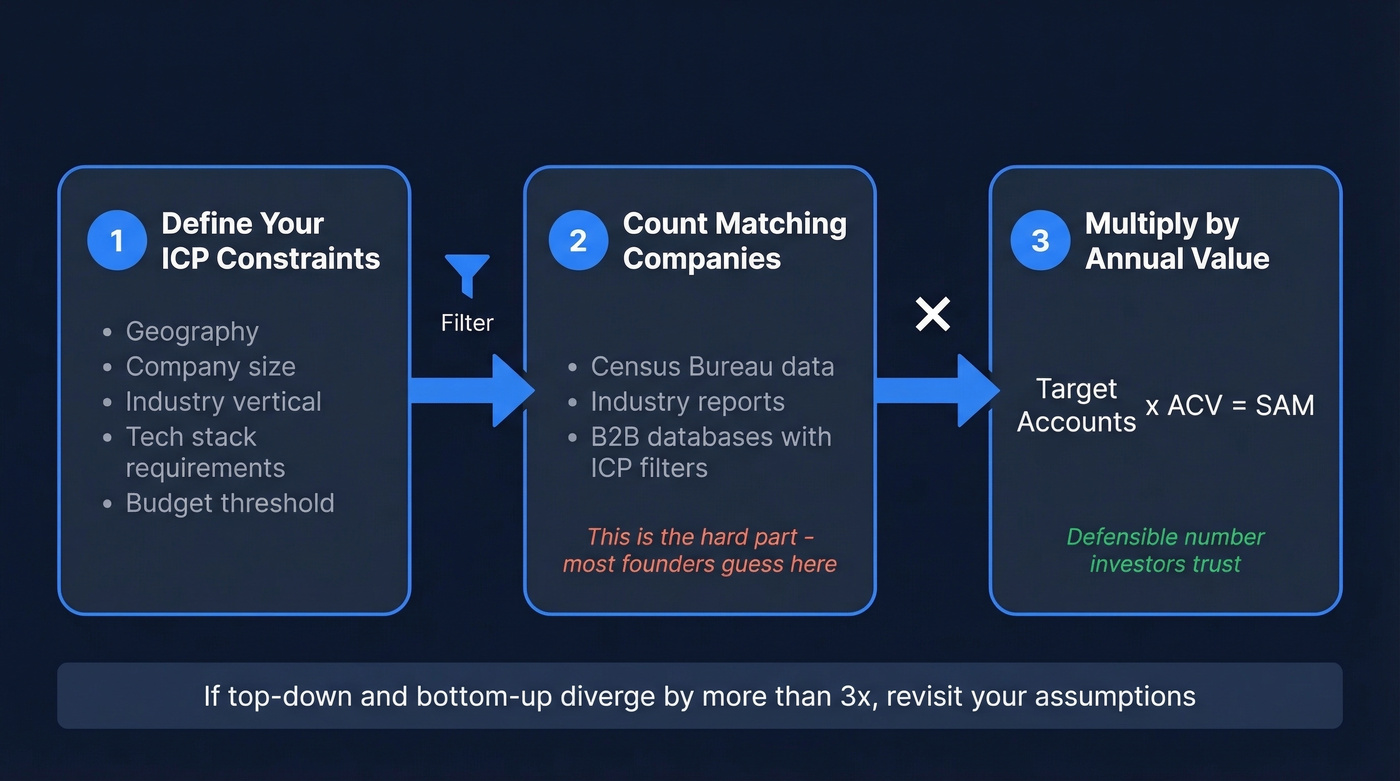
- Define your ICP constraints. Geography, company size, industry, tech stack requirements, budget threshold - every filter that separates "could buy" from "can't buy."
- Count the companies that pass all filters. This is the hard part. Census data, industry reports, and B2B company data providers are your friends here.
- Multiply by your annual value per account. If 50,000 companies match your ICP and your annual contract is $10,000, your SAM is $500M.
The most common blocker founders hit isn't the math - it's finding accurate company counts for niche segments, especially when you stack constraints like region + industry + tech stack. Let's be honest: most founders end up guessing at this number, and investors can tell.
If your top-down and bottom-up numbers diverge by more than about 3x, something's off in your assumptions. Investigate before you put either number in a deck.
You just read that the hardest part of SAM is finding accurate company counts for niche segments. Prospeo's B2B database has 300M+ profiles with 30+ filters - industry, headcount, geography, tech stack, funding, and more. Get the exact ICP count you need for bottom-up math, not guesswork.
Build a defensible SAM with real company counts, not estimates.
Worked SAM Examples
Example 1: B2B SaaS - UK Payroll Software
You're building payroll software for small UK businesses. Here's the filter chain using UK SME statistics:

- Start: 5.7M UK SMEs
- Filter 1 - Has employees: Exclude 4.3M sole traders = 1.4M SMEs with employees
- Filter 2 - Employee band: Your product targets 10-50 employees = 220,085 SMEs
- ACV: 1,200 GBP/year
SAM = 220,085 x 1,200 GBP = 264.1M GBP
Notice how the number drops from 5.7M to 220K - about a 96.1% reduction. That's normal. If your SAM doesn't shrink dramatically from TAM, you haven't filtered honestly. A SAM that's suspiciously close to TAM is the single fastest way to lose credibility on a market slide, because it signals you haven't thought about who you actually serve versus who theoretically exists in your category.
Example 2: Integration-Dependent Product
A trickier example. You're selling a product that requires customers to already use a specific integration platform:
- Businesses in serviceable geographies: 400,000
- Filter - Uses required integration: 50% = 200,000
- Average seats per company: 25
- Price per seat: $188/year
SAM = 200,000 x 25 x $188 = $940M
The integration dependency is the key constraint here. Without it, your SAM would be nearly $1.9B - but half your addressable market literally can't use your product. Product limitations and tech stack requirements are the filters most founders forget.

Where to Get SAM Data
The formula is easy. Finding the inputs is where most founders stall.
Free Sources
| Source | What It Gives You |
|---|---|
| US Census Bureau | Business counts by industry, size, state |
| Bureau of Labor Statistics | Role counts by industry |
| SEC Filings | Public company financials |
| UN Data | Population, trade, transport stats |
Paid Sources
| Source | What It Gives You |
|---|---|
| Gartner / Forrester / IDC | Industry revenue sizing |
| IBISWorld | Detailed industry reports |
| Crunchbase / PitchBook | Startup and funding data |
These sources answer different questions. Census data tells you how many businesses exist in a category. Analyst reports tell you total category revenue. Neither tells you exactly how many companies match your specific ICP filters.
That's where a B2B leads database fills the gap. Prospeo's database lets you filter companies across 30+ dimensions - industry, headcount, geography, tech stack, funding stage, headcount growth, and more - so you can run your exact ICP filters and get a segment-specific company count without manual list-building. For bottom-up SAM, that count is the core denominator. Multiply by ACV and you've got a defensible number.

Several free TAM/SAM/SOM calculator templates exist online for structuring the math, even if you still need to source your own inputs.
SAM With Zero Sales Data
Pre-revenue founders face a specific version of this problem: no customers, no churn data, no average deal size from actual sales. We've helped founders build SAM models for investor decks, and the #1 sticking point is always company counts, not math. Three proxy techniques that work:
Comparable company analysis. Find a public or well-documented company in your space. If they've disclosed customer counts and revenue, you can reverse-engineer their ACV and apply it to your target segment. This works especially well in SaaS, where public companies often break out customer counts in earnings calls.
Industry report extrapolation. Analyst reports from Gartner or IBISWorld often include average spend per company in a category. Use that as your ACV proxy until you have real pricing data.
B2B database validation. Run your ICP filters through a platform with granular company search - filter by headcount, industry, funding stage, and geography. The resulting company count is your SAM denominator. Multiply by your planned ACV and you've got a number grounded in real company data, not guesswork.
Here's the thing: you don't need sales history to build a defensible market size estimate. You need an accurate count of companies that match your constraints. That's it.
Common SAM Mistakes
Every founder inflates their SAM at least once. Here are seven mistakes we see kill pitch decks repeatedly.
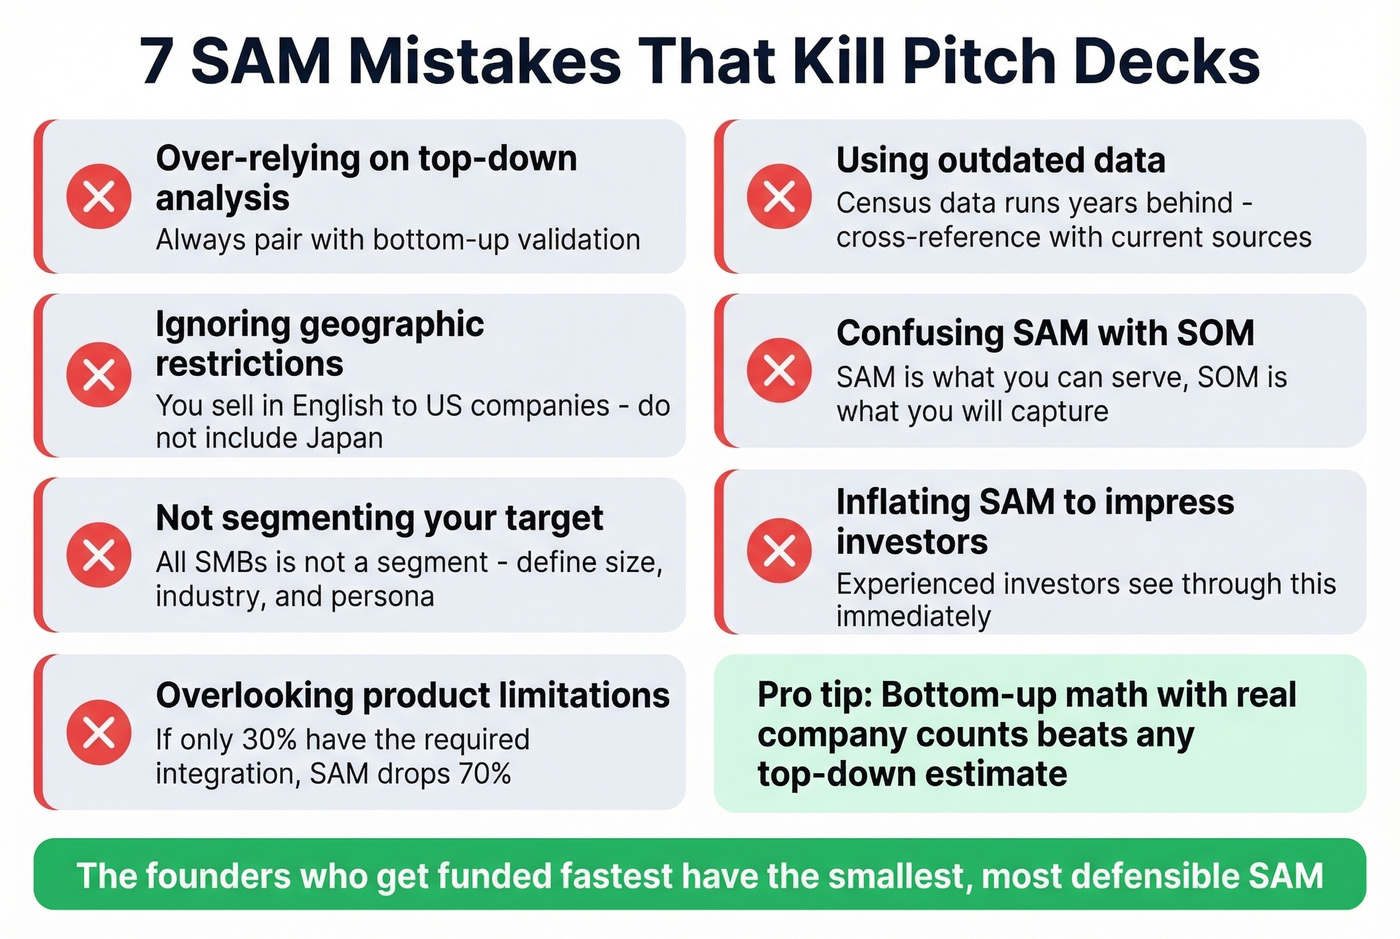
- Over-relying on top-down analysis. Always pair with bottom-up. Top-down is a sanity check, not a methodology.
- Ignoring geographic restrictions. You sell in English to US companies - don't include Japan. Filter by the geographies where you actually have go-to-market capability.
- Not segmenting the target demographic. "All SMBs" isn't a segment. Define company size, industry, and buyer persona before you count.
- Overlooking product limitations. If your product requires an API integration that only 30% of targets have, your SAM drops by 70%. List every technical prerequisite and filter accordingly.
- Using outdated data. Census data runs a couple of years behind. Cross-reference with a current B2B database or recent industry report.
- Confusing SAM with SOM. SAM is what you can serve; SOM is what you will capture. Keep them separate.
- Inflating SAM to impress investors. Experienced investors see through this immediately. In our experience, the founders who get funded fastest are the ones with the smallest, most defensible SAM - not the biggest, most impressive-sounding one.
How Investors Evaluate SAM
Investors spend roughly 3 minutes and 44 seconds on your entire pitch deck. Your market slide gets maybe 20-30 seconds of attention. A 2026 review of 82 pitch decks found 55% had inadequate market analysis. The bar is low - which means a well-built SAM slide actually stands out.
What investors look for isn't the biggest number. It's the clearest logic. They want to see that you understand the difference between TAM, SAM, and SOM, and that your SOM follows from realistic acquisition assumptions.
Skip the $10B TAM slide if your average deal is under $5K and you're pre-Series A. A tight $200M SAM with clear SOM logic will outperform a bloated TAM number every single time. The consensus on r/startups and r/venturecapital threads backs this up - investors have seen a thousand "1% of a huge market" slides. Show them you've counted real companies instead.
SOM benchmarks for early-stage B2B: expect to capture about 1% of SAM in Year 1, 3% in Year 2, and 5% in Year 3. Successful mature companies capture 5-20% of their SAM; industry leaders reach 20-40%. If your Year-1 SOM is above about 10% of SAM, your assumptions need exceptional justification - signed LOIs, a waitlist with thousands of signups, or a distribution advantage your competitors can't replicate.
Presenting SAM in Your Pitch Deck
Concentric circles or a stacked bar chart - either works. What kills credibility isn't the visual format; it's a number without methodology. Label each layer with both the dollar figure AND the derivation logic: "SAM: $264M = 220K UK SMEs (10-50 employees) x 1,200 GBP ACV."
Keep the slide to three numbers - TAM, SAM, SOM - each with a one-line derivation. A number without methodology is a red flag. A methodology without a number is useless. You need both, on one slide, in under 30 seconds of reading time.
Stacking filters like region + industry + tech stack shouldn't mean stacking guesses. Prospeo lets you layer technographics, headcount bands, revenue ranges, and 15,000 intent topics to count the exact companies that fit your SAM - refreshed every 7 days, not 6 weeks.
Turn your SAM formula into a live prospect list at $0.01 per lead.
FAQ
Is SAM the same as serviceable addressable market?
Yes - the terms are interchangeable. "Available" emphasizes current reachability; "Addressable" emphasizes targeting capability. Both refer to the portion of TAM you can realistically serve with your current product, pricing, and distribution.
What's a good SAM-to-SOM ratio?
For early-stage B2B, plan on capturing 1% of SAM in Year 1, 3% in Year 2, and 5% in Year 3. Mature companies hold 5-20%; industry leaders reach 20-40%. Anything above 10% in Year 1 requires exceptional justification backed by signed LOIs or waitlist data.
Should I use top-down or bottom-up to calculate SAM?
Bottom-up - always. Count real companies matching your ICP, multiply by ACV, and use top-down only as a sanity check. If the two diverge by more than 3x, revisit your assumptions. Bottom-up earns investor credibility because it shows you've counted actual businesses, not extrapolated from a Gartner headline.
How do I find accurate company counts for a niche market?
Start with Census Bureau data for broad industry totals, then validate with a B2B database that supports granular filtering. Stack filters for industry, headcount, geography, and tech stack to isolate a segment-specific count. Multiply that by ACV for a defensible bottom-up figure.
How often should I update my SAM?
Quarterly at minimum. Your SAM shifts as you enter new geographies, launch features, or adjust pricing. Treat it as a living number tied to your current product and GTM reality, not a one-time pitch deck exercise.