How to Calculate TAM for Your Startup (and Actually Impress Investors)
Your pitch deck is open. The market-size slide is blank. You've got 3 minutes and 44 seconds of investor attention - total - and 55% of decks get flagged for inadequate market analysis on this exact slide.
Here's the thing: most founders either slap a Gartner number on the slide and call it a day, or spiral into analysis paralysis trying to build a perfect model. Neither works. We've watched dozens of early-stage teams struggle with this, and the pattern is always the same - the founders who nail their TAM aren't the ones with the fanciest spreadsheets. They're the ones who can explain every assumption in plain English.
Let's break down how to build a credible TAM for your startup that survives due diligence, with the benchmarks and methods that actually matter in 2026.
TAM, SAM, SOM in 60 Seconds
| Term | What It Means | Formula |
|---|---|---|
| TAM | Total demand if you had 100% share | Total customers x ARPU/ACV |
| SAM | The slice your ICP can reach | ICP-filtered subset of TAM |
| SOM | What you'll realistically capture | Sales capacity adjusted by conversion/ramp |
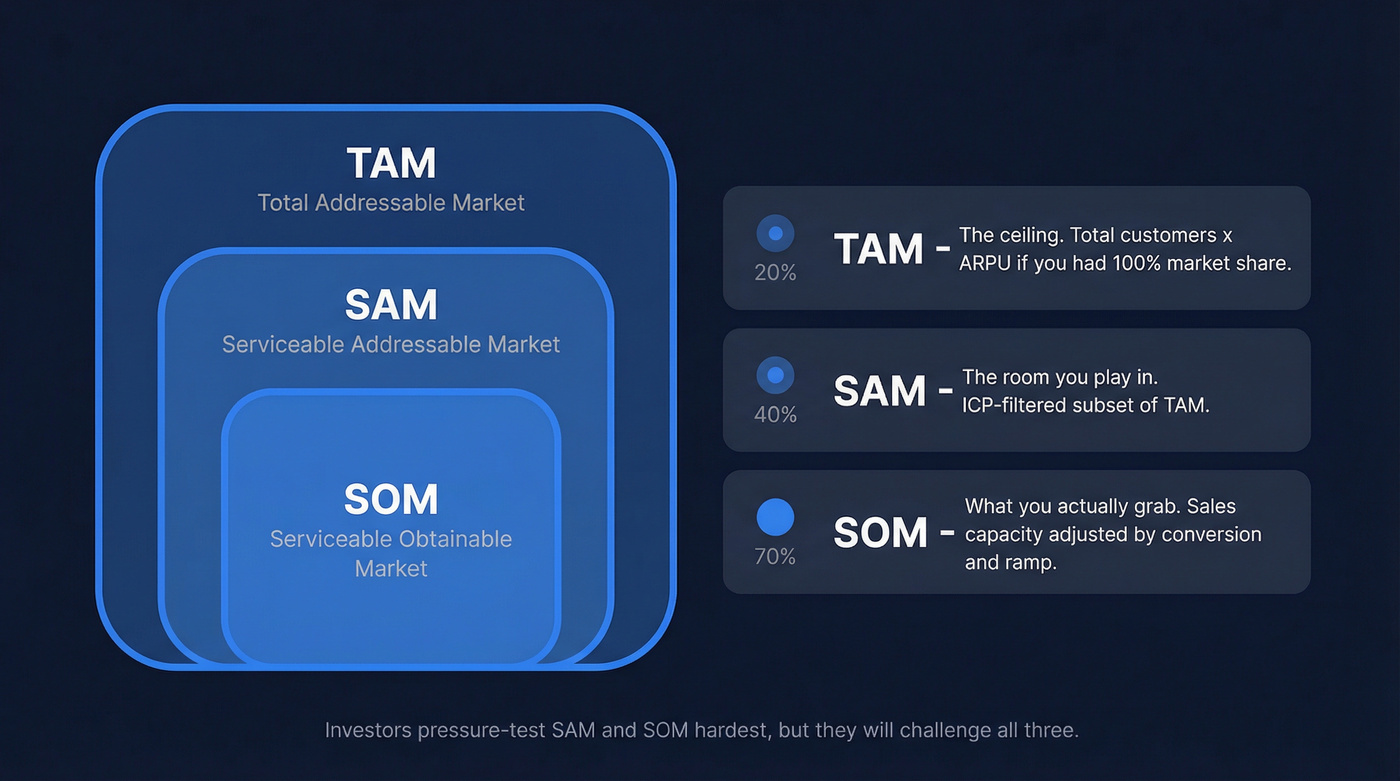
TAM is the ceiling. SAM is the room you're playing in. SOM is what you can actually grab in the next 12-36 months. Investors pressure-test SAM and SOM hardest, but they'll challenge all three.
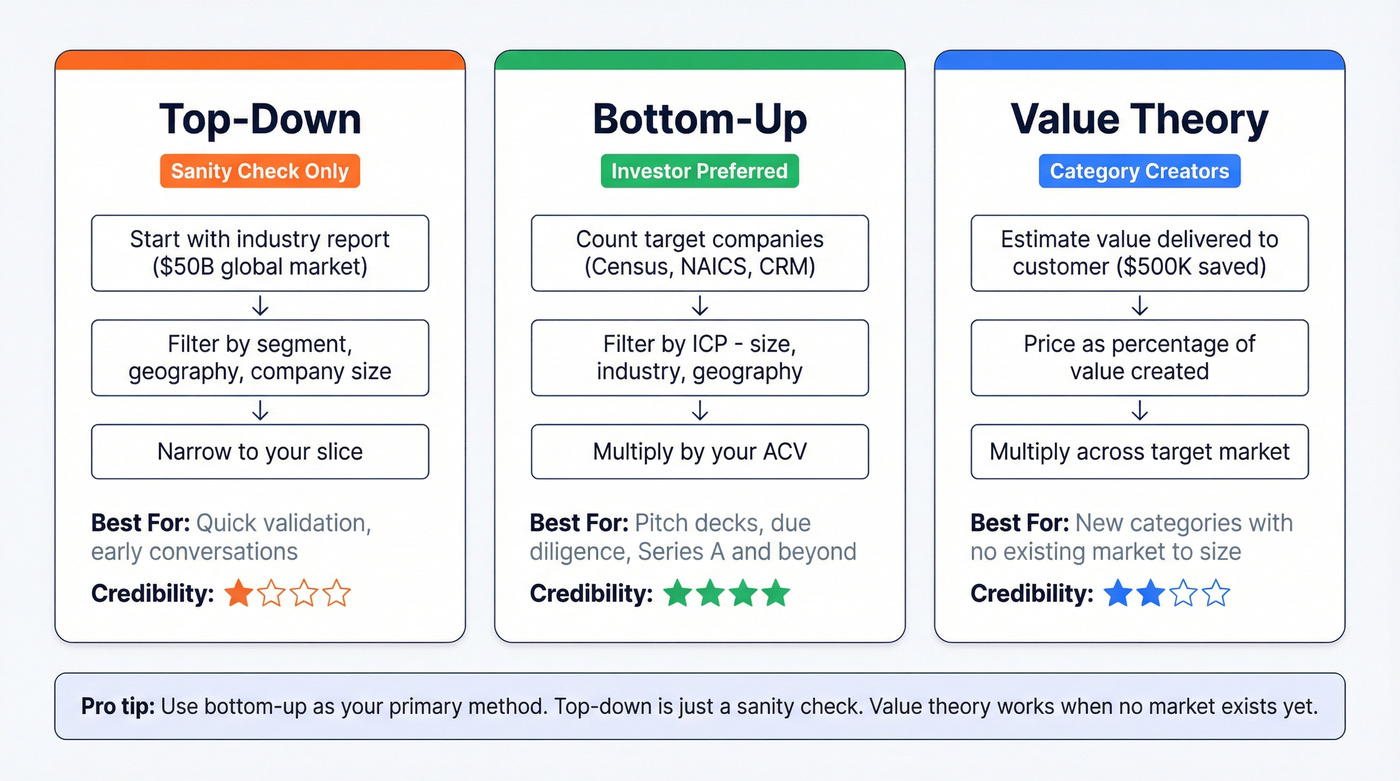
Three Ways to Calculate TAM
Top-Down
Start with an industry report number from Gartner, IBISWorld, or Statista and filter down to your segment. This is the fastest method and usually the least defensible for early-stage companies. Use it as a sanity check, not your primary number.
If your total addressable market slide says "$50B global market" with no filter, you lose credibility immediately.
Bottom-Up
This is the method investors trust most. Pull company counts from US Census County Business Patterns using NAICS codes, filter by employee size and geography, then multiply by your ACV. If you've got existing customers, your CRM data is the most credible bottom-up input available.
Example: Architecture firms under NAICS codes 54131 and 54132 show 1,857 + 365 establishments. At $5,000 ACV, that's an $11.1M TAM. Clean, defensible, sourced.
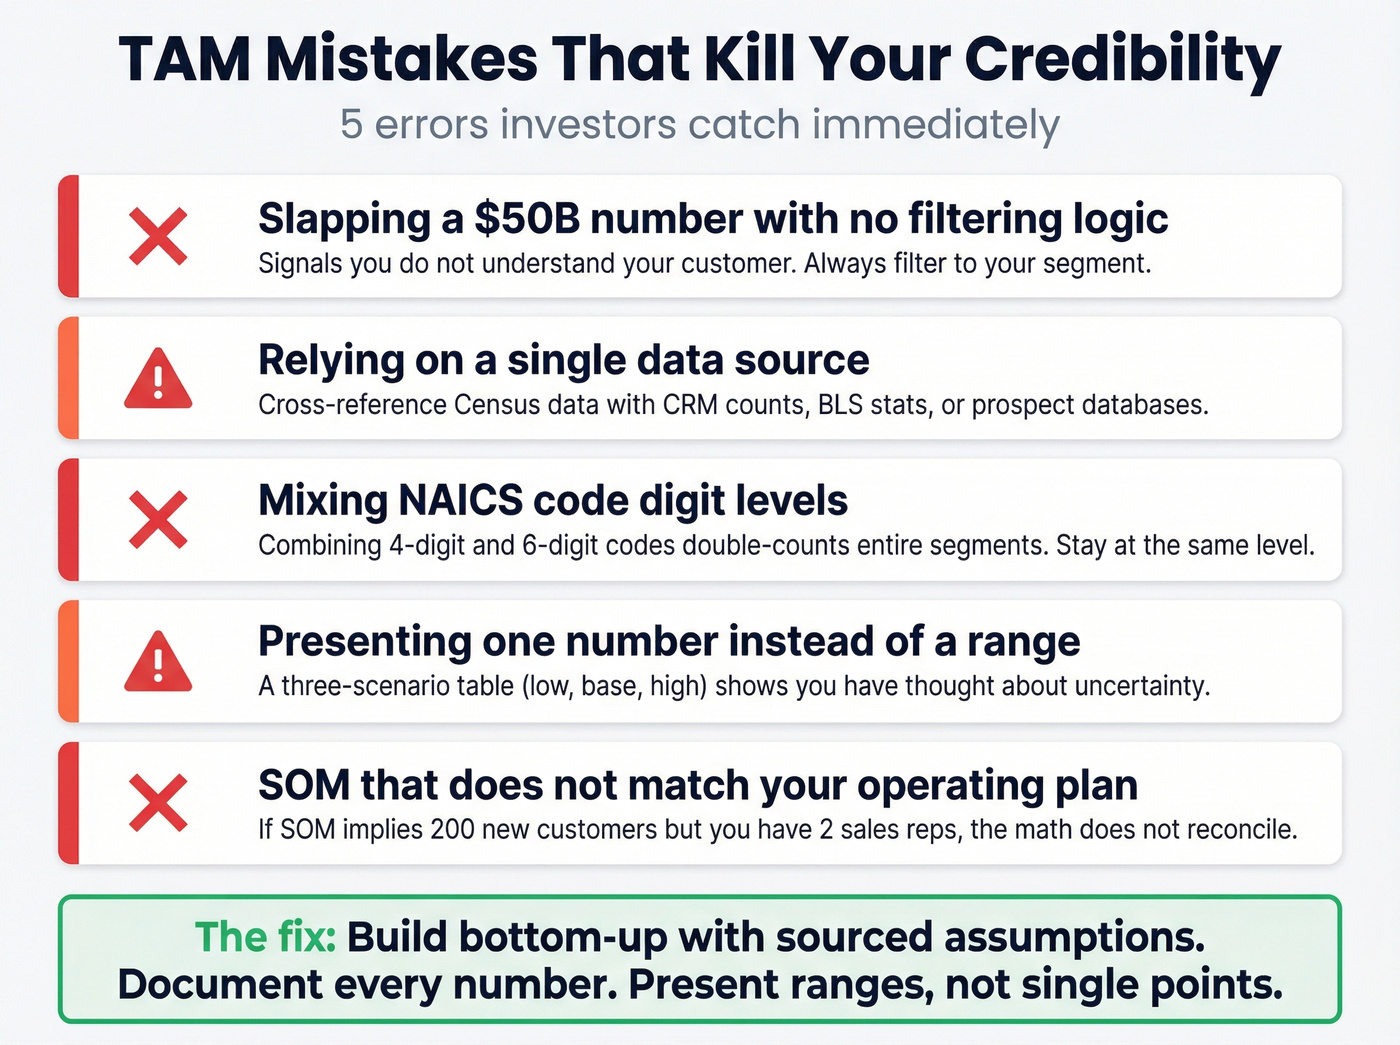
One critical caveat: NAICS codes are hierarchical and only additive at the same digit level. Mix 4-digit and 6-digit codes and you'll double-count entire segments.

Free sources include Census CBP, BLS job role counts, and NAICS industry codes. Paid reports from Statista, IBISWorld, or Gartner add depth but aren't required for a credible first pass.
Once you've counted target companies, tools like Prospeo let you filter by industry, headcount, funding stage, and tech stack to validate your count against real prospect data - not just Census estimates from years ago.
Value Theory
Price based on the value you deliver, not current market spend. This works for category-creating startups where no existing market exists to size. If your AI tool saves a company $500K/year in labor costs, pricing at $50K isn't constrained by what they currently pay for software in that category. It's constrained by the value you create.
Worked Example: B2B SaaS
You're building compliance software for mid-market fintech companies. Assume there are roughly 4,200 US fintechs with 50-500 employees. Your ACV is $18,000/year.
- TAM: 4,200 x $18,000 = $75.6M
- SAM: 2,100 companies match your ICP after filtering for regulatory complexity = $37.8M
- SOM: Year 1, you close 40 accounts = $720K
Now stress-test it. A Reddit founder building a product for airports and train stations estimated 1.0-1.5 units per customer - that 50% swing materially changed their TAM. Present both scenarios.
| Scenario | Customers | ACV | TAM |
|---|---|---|---|
| Low (-25% / -20%) | 3,150 | $14,400 | $45.4M |
| Base | 4,200 | $18,000 | $75.6M |
| High (+25% / +20%) | 5,250 | $21,600 | $113.4M |
Document every assumption. Investors will ask.
What's a Good TAM for Startups?
Your total addressable market can be too big and too small. Under $1B, you're not venture-scale - the exit math doesn't support 10x returns. Over $30B, you haven't defined your market; you've Googled an industry. The sweet spot for most venture-backed startups is $1B-$30B.
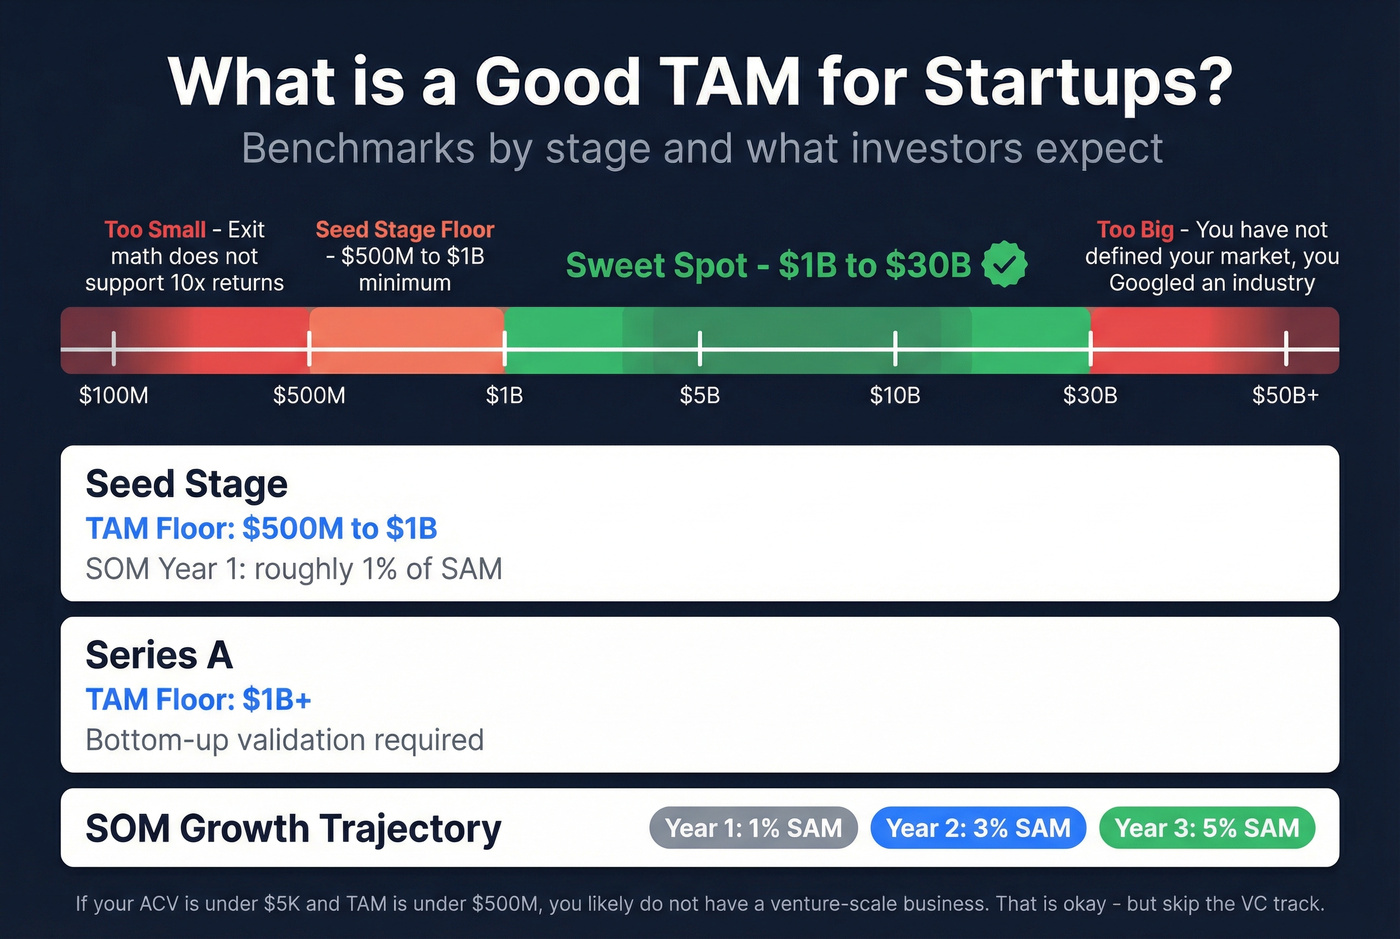
Stage-specific floors: $500M-$1B at seed, $1B+ at Series A with rigorous bottom-up validation expected. For SOM, MicroVentures benchmarks suggest 1% of SAM in Year 1, 3% in Year 2, 5% in Year 3.
Here's a strong opinion we'll stand behind: if your ACV is under $5K and your addressable market is under $500M, you don't have a venture-scale business. That's fine - plenty of great companies are built without VC. But don't waste months pitching funds whose math requires a $1B+ outcome. Skip the VC track and focus on revenue.
Your bottom-up TAM is only as good as your company counts. Prospeo's database of 300M+ profiles with 30+ filters - industry, headcount, funding stage, tech stack - lets you validate your addressable market against real prospect data, not stale Census estimates.
Build your TAM on real data, not guesswork. Start free.
Sizing TAM for Usage-Based Pricing
The "customers x ACV" formula assumes seat-based pricing. But 85% of SaaS companies surveyed have adopted usage-based pricing. If you charge per API call, per token, or per transaction, the formula changes:
TAM = total usage units x price per unit
For an AI company charging per thousand tokens, estimate total inference volume across your target market, multiply by your per-token price, and you've got a revenue TAM. Investors want to see that consumption grows as customers succeed - usage data becomes the proof point, not seat counts.
How Investors Challenge Your Market Sizing
Investors never take market sizes at face value. Presenting credible numbers means anticipating exactly where they'll push back.
"Too big" = lazy. A $50B TAM with no filtering logic signals you don't understand your customer. "Too small" = capped returns. Sub-$1B TAM makes the fund math impossible. No source = no credibility. If you can't name where the number came from, investors assume you made it up. And if your SOM implies 200 new customers in Year 1 but you've got two reps, the math doesn't reconcile with your operating plan.
In one seed fundraising process we followed, a founder described multiple screening calls, individual cofounder interviews, and even personal references - all before a term sheet landed. Your assumptions need to hold up under that level of scrutiny. Bottom-up is the primary method investors trust. Top-down is just a sanity check.
Common TAM Mistakes
A Series A startup built a "super-flexible platform for any company, in any industry." Every customer was unique. Every deal was bespoke. Clients paid under $1,000 but demanded enterprise-level service. The TAM slide said $10B. The unit economics said bankruptcy.
That's the most common failure pattern: conflating a massive addressable universe with an actual serviceable market.
Other mistakes we see repeatedly: relying on a single data source, using outdated Census data without checking the vintage year, and presenting a single number instead of a range. External shocks - regulatory changes, economic downturns, a pandemic - can expand or contract your market overnight. A three-scenario table tells investors you've thought about uncertainty. A single-point estimate tells them you haven't.
Including TAM in Your Business Plan
Your market analysis shouldn't live only on a pitch deck slide. It belongs in the market opportunity section of your business plan too. Lenders, accelerator applications, and strategic partners all want to see how you sized the market, and the same bottom-up rigor that impresses VCs strengthens every planning document you produce.
From TAM to Pipeline
Calculating TAM tells you the opportunity exists. Now you need to find the people in it. Prospeo's B2B database covers 300M+ profiles with 98% verified email accuracy and firmographic filters and 30+ filters - search by industry, headcount, funding stage, tech stack, and layer in buyer intent signals powered by Bombora to identify companies actively researching your category.
You just sized your market. Now reach it. Prospeo gives you 98% accurate emails and 125M+ verified mobiles for the exact ICP you defined - filtered by industry, company size, and growth signals. At $0.01 per email, your SOM math finally connects to real pipeline.
Turn your TAM slide into booked meetings for 1 cent per lead.
FAQ
How do I calculate TAM for a marketplace?
Size GMV on the constrained side (usually supply), then multiply by your take rate - typically 5-30%. A marketplace with $500M potential GMV and a 15% take rate has a $75M revenue TAM. Always present revenue TAM to investors, not raw GMV.
Is my TAM too small for venture capital?
VCs generally require $1B+ at Series A and $500M+ at seed. Below that threshold, show a credible expansion path into adjacent segments that gets you above $1B within 5-7 years. Without that path, bootstrap or seek non-VC funding.
What free tools help validate startup market sizing?
Start with US Census County Business Patterns for B2B company counts and BLS for job role data - both free. To cross-check those counts against live prospect data, Prospeo's free tier lets you filter companies by headcount, industry, and funding stage.
What's the difference between top-down and bottom-up TAM?
Top-down starts with a broad industry figure from analyst reports and narrows it - fast but hard to defend. Bottom-up counts individual target accounts and multiplies by ACV - slower but far more credible. Use bottom-up as your primary method and top-down only as a sanity check.