Territory Mapping: Build, Balance, and Maintain Sales Territories That Actually Work
A RevOps lead we know ran a territory rebalancing last year. She discovered that her top-performing rep had 40% fewer accounts than the worst performer - but three times the pipeline. The territories weren't unfair by count. They were unfair by workload. That single insight, once corrected, lifted the team's quarterly number by 11%.
Territory mapping isn't a cartography exercise. It's a revenue architecture problem. Most teams get it wrong because they're drawing lines on maps instead of modeling work.
The Short Version
If you're building a territory map this week, here's what matters. Clean your account data first - stale records poison every downstream decision. Balance by workload, not account count. Use drive-time isochrones instead of ZIP code boundaries. Review quarterly, not annually.
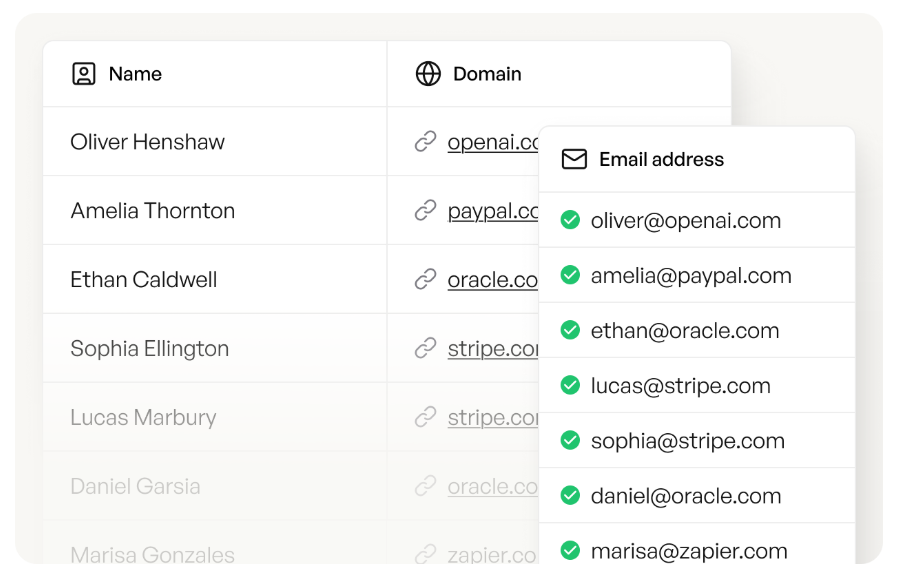
For tools: Maptive or Mapline for mid-market teams, Salesforce Maps if you're a Salesforce shop, and Maptitude if you want a full desktop GIS license without ongoing subscription fees. For the data layer most guides skip entirely: run your account list through Prospeo to verify the contacts inside your territories have working emails and direct dials. A perfectly drawn territory is worthless if reps can't reach anyone in it.
What Is Sales Territory Mapping?
Sales territory mapping is the process of dividing your addressable market into defined segments and assigning them to sales reps. Those segments can be geographic - regions, states, metro areas - but they don't have to be. Industry verticals, company size tiers, named accounts, and hybrid models all count.
The goal is coverage without overlap. Every viable account gets a clear owner. No rep steps on another's deals. The workload distribution is close enough to fair that you don't lose people to burnout or boredom.
The global sales mapping software market sits at roughly $2.5B and is projected to reach $7B by 2033, tracking a broader shift: companies are realizing territory design is a strategic lever, not an administrative chore.
Why It Matters
The business case is unusually well-documented. HBR research found that territory design alone can lift revenue 2-7% without changing strategy, headcount, or resources. The Alexander Group pegs productivity gains at 10-20% when territories are properly balanced. Xactly's data shows up to 30% higher quota attainment and 75% reduced planning time for teams using structured territory planning. Maplytics adds another angle: effective territory design correlates with 14% higher sales objectives, while poor design drags performance down 15%.
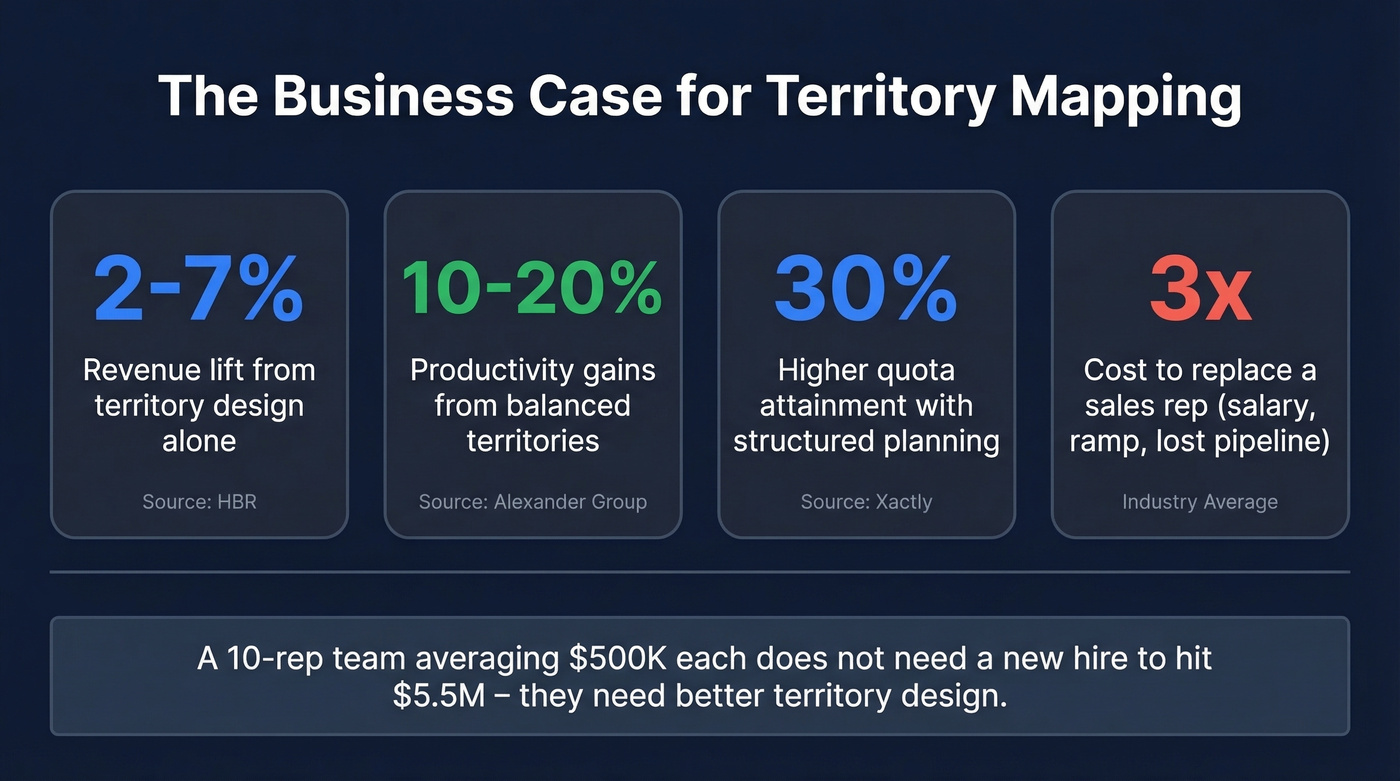
Those numbers compound. A 10-person sales team averaging $500K per rep doesn't need a new hire to hit $5.5M - they need better territory design.
The cost of getting it wrong is equally concrete. Replacing a sales rep runs roughly 3x their annual salary when you factor in recruiting, onboarding, and lost pipeline. Reps hit peak performance at about three years of tenure. Poorly balanced territories accelerate turnover, which resets that clock - you're not just losing a rep, you're losing 18 months of ramp time.
Modern buying groups include 11-15 stakeholders on average. That complexity means a single enterprise account can consume as much rep capacity as a dozen SMB accounts. Any territory model that ignores this will systematically overload reps covering complex deals.
How to Map Sales Territories
Step 1: Clean Your Data
Everything starts with clean account data. Pull your CRM records and make sure every account has a standardized location field - ZIP code, city/state, or lat/long coordinates. ZIP codes change more frequently than most people realize, so verify yours against current USPS or postal databases.
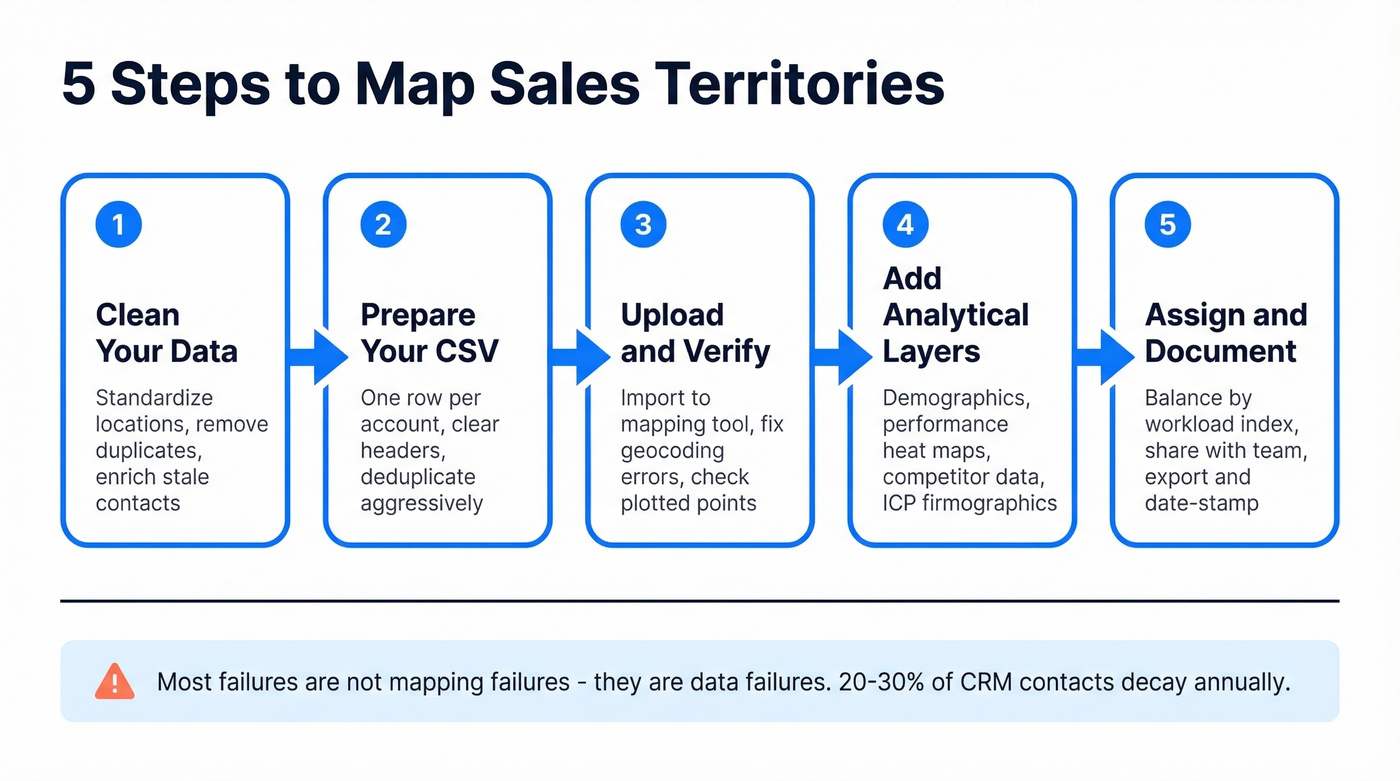
Here's the thing: most failures aren't mapping failures at all. They're data failures. If 20-30% of your CRM contacts have decayed (the industry average for annual data decay), your reps are inheriting dead leads regardless of how elegant the map looks. Run your account list through an enrichment tool before uploading - stale emails and wrong phone numbers undermine even perfectly drawn territories.
Step 2: Prepare Your CSV
Structure your data with one row per account and clear column headers. At minimum, include company name, ZIP/postal code, account tier, annual revenue or deal size, and owner. Deduplicate aggressively. Conflicting records create phantom territories that waste rep time and breed confusion during pipeline reviews.
Step 3: Upload and Verify
Import your CSV into your mapping tool and check the plotted points. Look for obvious errors: accounts plotting in the ocean, clusters that don't match known customer concentrations, missing records that didn't geocode. Most tools flag geocoding failures. Fix them before proceeding.
Step 4: Add Analytical Layers
This is where the process becomes territory intelligence rather than just a coloring exercise. Layer in demographics like population density and business density, sales performance heat maps showing pipeline by region and win rates, and competitor presence data. These overlays turn a flat map into a decision-making tool.
You'll spot whitespace opportunities in untapped regions, oversaturated zones, and performance anomalies that are invisible in a spreadsheet. If you're running an account-based motion, overlay your ICP firmographics to see where your total addressable market actually clusters.
Step 5: Assign and Document
Assign territories based on the workload analysis covered in the next section - not gut feel. Once assigned, share the map with the team and document the logic behind each boundary. Export your territory definitions in GeoJSON, PDF, or whatever your tool supports, and date-stamp them. You'll need this audit trail when territories get challenged.
And they will get challenged.
How to Balance Territories
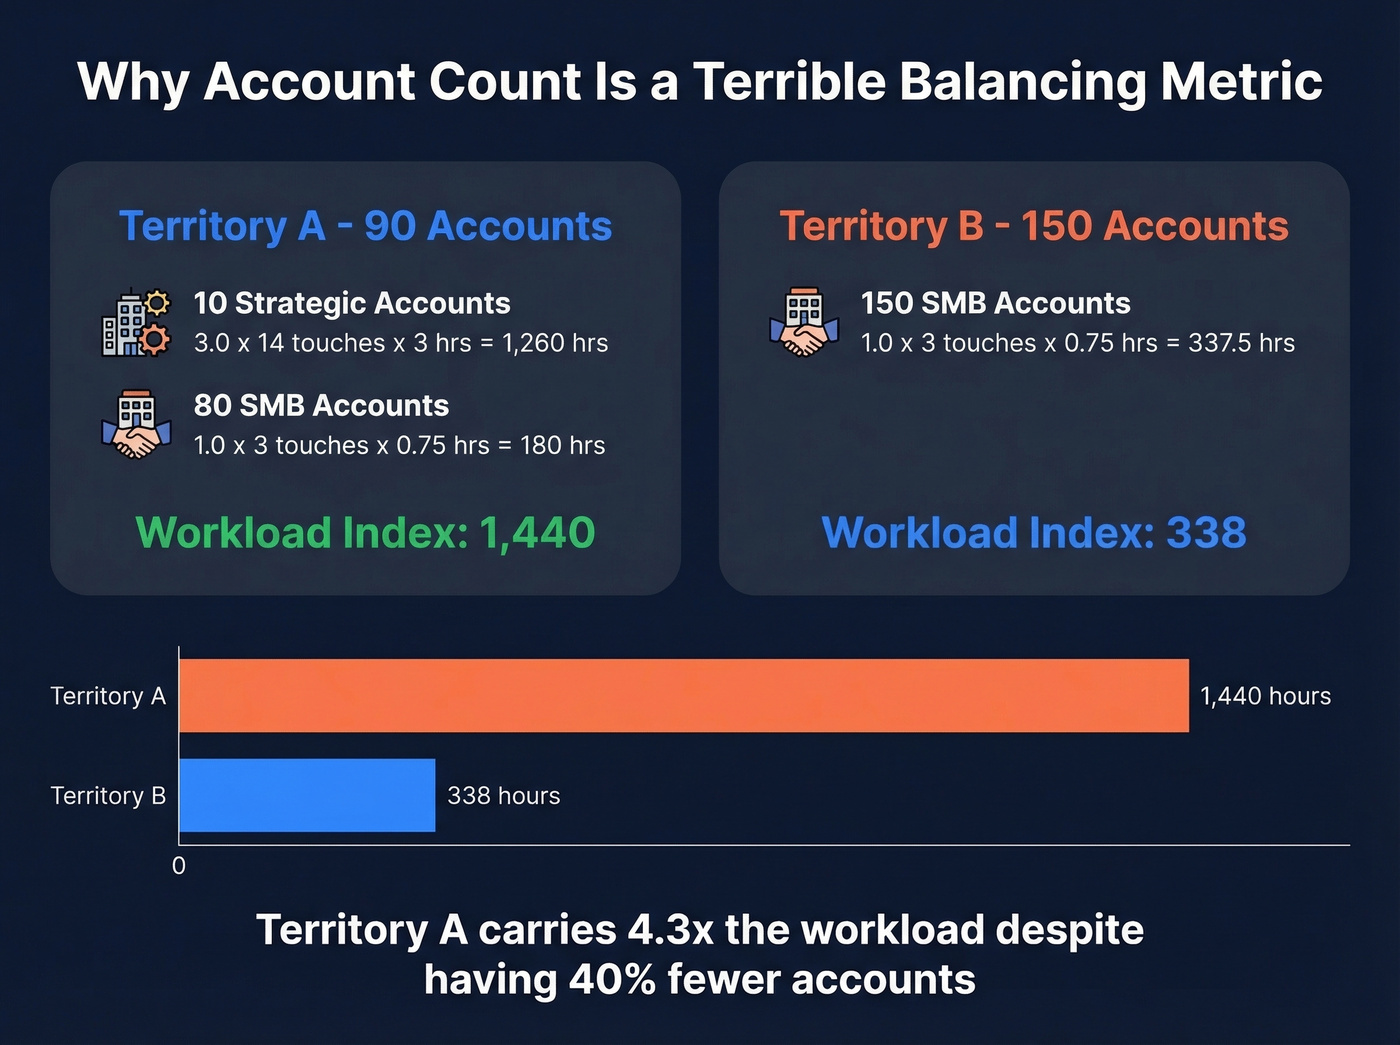
Account count is a terrible balancing metric. A rep with 200 SMB accounts and a rep with 50 enterprise accounts don't have remotely similar workloads. The Workload Index fixes this.
The Formula
Territory Workload Index = Σ (Account Weight x Engagement Frequency x Time per Engagement)
Calculate this for every account in a territory, then sum the results. Compare totals across territories. If they're within plus or minus 15-20% of each other, you're in good shape. Tighter than 10% is impractical to maintain. Wider than 25% means meaningful imbalance that's probably already showing up in pipeline variance and rep satisfaction scores.
Account Weight Multipliers
| Account Tier | Weight |
|---|---|
| Strategic/Enterprise | 3.0 |
| Mid-market | 2.0 |
| SMB | 1.0 |
| Prospect (unqualified) | 0.5 |
Engagement Frequency
Strategic customers need 12-16 touches per quarter. Mid-market accounts run 6-8. SMB accounts need 2-4. High-priority prospects require 8-12 touches, while nurture accounts sit at 2-4.
Time per Engagement
Field sales engagements - including prep, travel, meeting, and follow-up - run 1.5-4 hours each. Inside sales engagements run 0.5-1 hour. Travel time varies dramatically by geography: dense metro areas average 20-30 minutes between meetings, suburban/regional territories run 45-60 minutes, and rural or multi-state books can hit 90-120+ minutes per drive.
Let's run the math on a real example. A territory with 10 strategic accounts (weight 3.0 x 14 quarterly touches x 3 hours = 1,260 hours/quarter) and 80 SMB accounts (weight 1.0 x 3 touches x 0.75 hours = 180 hours/quarter) produces a Workload Index of 1,440. Compare that to a territory with 150 SMB accounts at the same engagement pattern - that's only 337.5 hours. The first territory carries over 4x the workload despite having fewer accounts.
Territory mapping lifts revenue 2-7% - but only if reps can actually reach the contacts inside those territories. With 30% annual data decay, your balanced workload model is built on dead leads. Prospeo enriches your entire account list with 98% accurate emails and 125M+ verified mobile numbers, refreshed every 7 days.
Stop mapping territories full of contacts your reps can't reach.
Auditing Territory Equity
For teams with 20+ reps, eyeballing workload balance isn't enough. The Coefficient of Variation is the simplest equity check: calculate the standard deviation of workload indices across all territories, divide by the mean. A CV above 0.30 indicates inequitable distribution that's likely costing you bookings through under-coverage in overloaded territories.
Enterprise RevOps teams sometimes use Gini coefficients and Lorenz curves for deeper analysis - the same tools economists use to measure income inequality. Overkill for a 10-rep team, but valuable when you're managing 50+ territories across multiple regions.
Don't forget capacity adjustments for ramping reps. A new hire in their first 90 days operates at roughly 0.5 FTE capacity. Days 91-180, they're at 0.75. Only after six months should you model them at full capacity. Assigning a full territory to a week-one rep is a recipe for lost accounts and a demoralized new hire.
7 Mistakes That Kill Territory ROI
1. Drawing by ZIP Codes
ZIP codes aren't stable geographic polygons - they're mail delivery routes that change regularly. They also ignore natural barriers like rivers, highways, and mountains that affect actual travel time. Use drive-time polygons built on road network data instead.
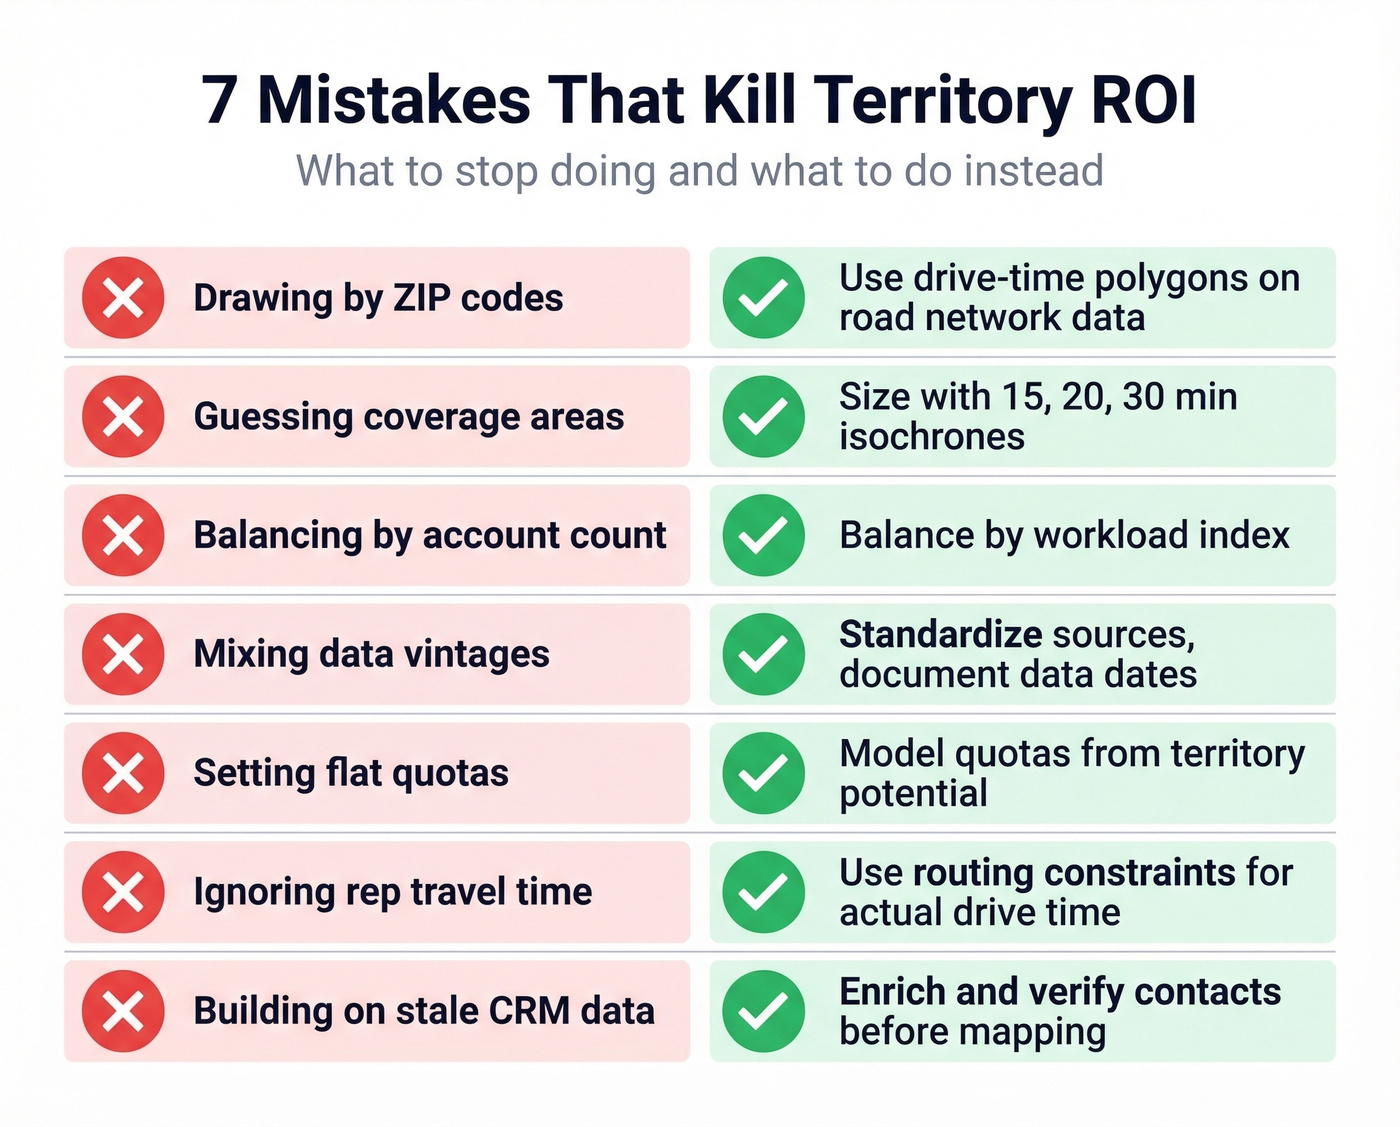
2. Guessing Coverage Areas
"This rep covers the Northeast" isn't a territory plan. Size territories with 15, 20, and 30-minute isochrones - concentric drive-time rings that show actual reachable area. Overlay your accounts and pipeline to assess cannibalization risk between adjacent territories.
3. Balancing by Account Count
The most common mistake we see. A territory with 100 accounts isn't equivalent to another territory with 100 accounts. Balance by workload index, not headcount.
4. Mixing Data Vintages
If your account data comes from three different sources updated at three different times, you're building on sand. Standardize on specific data vintages and document which sources feed each field. A territory built on 2024 firmographic data and 2026 pipeline data will produce contradictory signals.
5. Setting Quotas Without Parity
Quotas should reflect modeled territory potential - accounts, population, income, pipeline history - not a flat number divided equally. A rep covering rural Montana and a rep covering downtown Chicago shouldn't carry the same number.
6. Ignoring Rep Travel Time
Two territories can have identical workload indices but wildly different travel burdens. Use routing constraints to model actual time-in-car. A rep spending 15 hours per week driving is a rep not selling.
7. Building on Stale CRM Data
Nobody talks about this one because it's not a mapping problem - it's a data problem. 20-30% of CRM records decay annually. Job changes, company moves, email bounces, disconnected phone numbers. Run your account list through Prospeo before finalizing territory assignments. With 98% email accuracy and a 7-day refresh cycle, reps actually reach the contacts in their territories instead of burning time on bounced emails and dead numbers.

How Often to Rebalance
Annual territory reviews are nine months too slow. Markets shift, reps leave, accounts grow or churn, and new products open new segments. By the time you catch the imbalance in an annual review, you've already lost pipeline.
Run quarterly reviews focused on three metrics: pipeline-to-quota ratio by territory, win rate by territory, and effort-to-return (activities per dollar of pipeline generated). If one territory's pipeline-to-quota ratio is 1.8x while another's is 0.6x, you don't need to wait for the annual planning cycle to act.
Save structural changes - redrawing boundaries, reassigning accounts - for semi-annual planning cycles. Quarterly reviews identify problems; semi-annual rebalances fix them. This cadence gives reps enough stability to build relationships while keeping the org responsive.
Look, if your average deal size is under $15K, you probably don't need enterprise mapping software at all. A well-maintained spreadsheet with quarterly workload audits will outperform a $50K AlignStar deployment that nobody updates. The tool doesn't matter if the discipline isn't there.
Best Software for 2026
| Tool | Best For | Starting Price | Key Feature |
|---|---|---|---|
| Maptive | Mid-market teams | ~$100-200/mo | 150K+ locations, heat maps |
| Mapline | No-code teams | $99/mo | 7-day trial, drag-and-drop |
| Salesforce Maps | Salesforce shops | ~$50-75/user/mo | Native CRM, scenarios |
| Badger Maps | Field sales reps | $49/user/mo | Route optimization |
| MapBusinessOnline | Budget teams | $29/mo | Full-featured, 1-month free trial |
| Spotio | Outside sales | $39/user/mo | Canvassing + territory |
| eSpatial | Enterprise planning | $1,295/user/yr | Algorithmic optimization |
| Xactly AlignStar | Enterprise RevOps | ~$30K-80K+/yr | Ties to comp mgmt |
| Maplytics | Dynamics 365 shops | ~$30-60/user/mo | .shp/.kml/.geojson import |
| EasyTerritory | Dynamics 365 shops | ~$40-75/user/mo | Hierarchical territories |
| Maptitude | GIS power users | $695 one-time | Desktop GIS, census data |
| Felt | Collaborative mapping | Free / $200/mo (Team) | Browser-based, BI embeds |
| BatchGeo | Quick visualization | Free / $99/mo (Pro) | Simplest setup |
| Google Maps Platform | Developer teams | $100-1,200/mo | API-first, scalable |
Skip These If You're Starting Out
BatchGeo and Google Maps Platform are tempting because they're familiar. BatchGeo is a visualization tool, not a territory management platform - use it for stakeholder presentations, not ongoing operations. Google Maps Platform requires developer resources to build anything useful. Unless you have engineering bandwidth to spare, start with a purpose-built tool.
Best Value
Mapline is the easiest on-ramp - drag-and-drop territory creation, no GIS expertise required, and a 7-day free trial to validate fit. MapBusinessOnline at $29/mo is the cheapest dedicated option with real territory features. For most teams under 20 reps, one of these two will do the job.
CRM-Native Options
Salesforce Maps is the obvious choice if you're already in the Salesforce ecosystem. Native integration means territory assignments flow directly into account ownership, routing, and reporting. Scenario modeling lets you test rebalances before committing. The ~$50-75/user/month add-on cost stings, but maintaining a separate mapping tool and syncing data back to Salesforce is worse.
EasyTerritory and Maplytics both integrate natively with Dynamics 365. Maplytics supports .shp, .kml, and .geojson file imports for external geographic data. EasyTerritory's hierarchical territory model handles parent-child relationships well for orgs with regional managers overseeing multiple reps.
Enterprise Planning
Xactly AlignStar is the heavyweight. It ties territory design directly to compensation management, which eliminates the "my territory is unfair" arguments that derail every planning cycle. Expect $30K-80K+/year. eSpatial offers algorithmic optimization at a lower price point with scenario planning that's genuinely sophisticated.
Field Sales and GIS
Badger Maps ($49/user/mo) and Spotio ($39/user/mo) are purpose-built for reps who spend their days in cars. Badger is stronger on routing; Spotio adds canvassing features for door-to-door workflows.
Maptitude at $695 one-time is a steal if you have someone who knows GIS - desktop application, census and demographic data included, no subscription fees. For open-source, QGIS paired with free census data gets you surprisingly far.
AI-Powered Territory Optimization
AI-driven territory tools moved from "interesting demo" to "production-ready" in the mid-2020s. Modern platforms analyze thousands of data points - account potential, rep capacity, travel patterns, pipeline velocity - to recommend territory configurations that would take a human analyst weeks to model.
The early results are strong. Teams using tech-driven rebalancing report roughly 18% productivity gains and ~20% reductions in travel time. Those aren't marginal improvements - that's the equivalent of adding nearly one day per week of selling time per rep. Some platforms are even starting to factor in sustainability metrics like travel emissions, which matters for orgs with ESG commitments.
In our experience, the strongest results come from Maplytics and Xactly AlignStar, but the space is evolving fast. The real enabler is real-time CRM integration - static territory models break because the data they're built on goes stale. AI tools connected to live pipeline and activity data flag imbalances as they emerge, not months later during a planning cycle. If your current tool doesn't have an AI optimization roadmap, it'll feel dated within 18 months.
FAQ
What's the difference between territory mapping and territory management?
Territory mapping is the design phase - drawing boundaries, assigning accounts, balancing workload. Territory management is the ongoing discipline of monitoring performance, adjusting assignments, and rebalancing as markets shift. Mapping is a project; management is a process. Most orgs invest in the first and neglect the second.
Can I build a territory map in Excel?
Yes, but you'll hit limits fast. Excel can sort accounts by ZIP code, but it can't visualize drive times, model scenarios, or update dynamically. Dedicated tools start at $29/mo - the time saved on the first rebalance pays for a year of licensing.
How many territories should a sales org have?
One per rep is the baseline, not a rule. Some reps handle two small territories; some enterprise territories need two reps. Let the workload math drive the count. Use the Workload Index formula above to size territories by effort, not headcount alone.
What data do I need before creating territory maps?
At minimum: an account list with location data, revenue or deal size per account, and tier classifications. For better results, add pipeline history, win/loss data, and verified contact information. Enriching your CRM data before mapping - returning 50+ data points per contact at a 92% match rate - ensures reps can actually work the territories you assign instead of chasing outdated records.
How often should territories be rebalanced?
Quarterly reviews for early detection, semi-annual structural changes. Annual-only reviews leave nine months of drift uncorrected. Track pipeline-to-quota ratio, win rate, and effort-to-return by territory. When any metric diverges more than 30% from the team median, investigate immediately.
You just spent hours balancing workloads, layering firmographics, and drawing perfect boundaries. Now make sure every account has a verified decision-maker attached. Prospeo's CRM enrichment returns 50+ data points per contact at a 92% match rate - for roughly $0.01 per email.
Turn perfectly mapped territories into perfectly reachable pipeline.