Total Addressable Market Example: 5 Worked Calculations You Can Actually Use
Your co-founder just typed "$50B market opportunity" on slide 4 because that's what a Gartner report said. The investor across the table doesn't believe it - and neither should you. 55% of pitch decks have inadequate market analysis, and the problem is almost always the same: a total addressable market number that's copy-pasted from an industry report with zero logic behind it.
TAM is the total revenue opportunity if you captured 100% of the market. Bottom-up is the only method investors take seriously. Below: five worked examples with real numbers, the formulas, the mistakes to avoid, and a template to build your own.
What Is Total Addressable Market?
Total addressable market represents the entire revenue opportunity available for a product or service, assuming 100% market share with no competition. It's the theoretical ceiling. But here's what most guides skip: TAM isn't a number. It's an argument. The figure itself matters far less than the logic chain you use to get there.
Investors aren't evaluating the size of your market - they're evaluating whether you understand your customer well enough to size the market correctly.
Three Ways to Calculate TAM
| Method | Best for | Data needed | Investor credibility |
|---|---|---|---|
| Top-down | Sanity checks | Industry reports, gov data | Low |
| Bottom-up | Primary pitch number | ICP count, ACV, segments | High |
| Value theory | New categories | willingness-to-pay data | Medium |
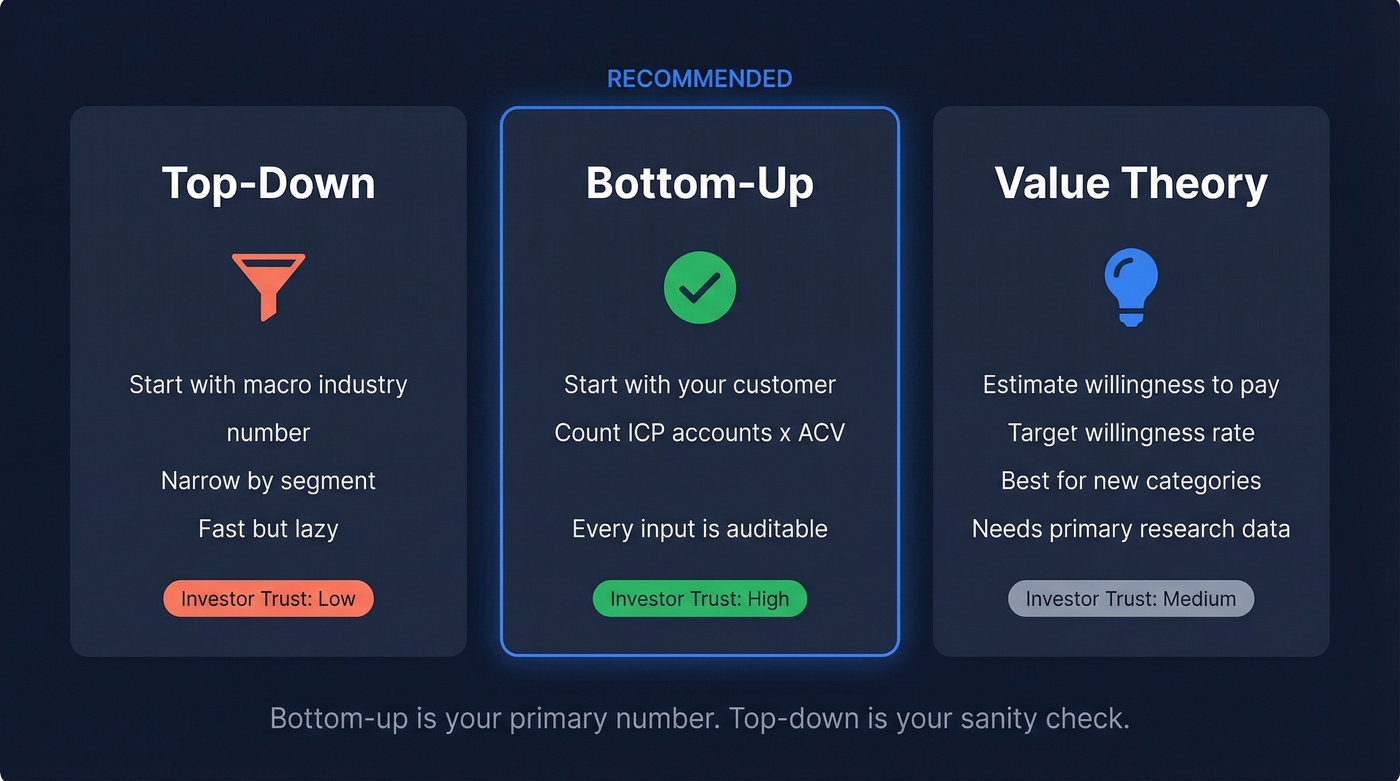
Top-down starts with a macro market number and narrows it. You take a published industry figure - say, the global CRM market - and filter down to your segment. It's fast, but it's lazy. Investors see right through it because the assumptions are hidden inside someone else's report.
Bottom-up starts with your customer. How many accounts fit your ICP? What will they pay? Multiply. This is the only method that forces you to prove you know who you're selling to, and it's the one we recommend building first every single time.
Value theory estimates what customers would pay based on the value your product delivers, regardless of what they're paying today. Useful for genuinely new categories - think Uber before ride-sharing existed - but it requires willingness-to-pay data that most early-stage companies simply don't have.
Bottom-up is your answer. Top-down is your sanity check.
5 Real TAM Calculations With Numbers
Airbnb - Marketplace TAM From an S-1 Filing
Airbnb's S-1 filing includes a clear TAM breakdown. They sized their total opportunity at $3.4T across three segments:
| Segment | TAM |
|---|---|
| Short-term stays | $1.8T |
| Long-term stays | $210B |
| Experiences | $1.4T |
Why this works: the segmentation is clear, and each piece is independently defensible. An investor can challenge any single segment without the whole thing collapsing. That's the hallmark of a good TAM - it survives scrutiny one layer at a time.
SaaS Bottom-Up - HR Analytics Platform
This is the method you should actually use. It's the clearest total addressable market example investors will trust, because every input is visible.
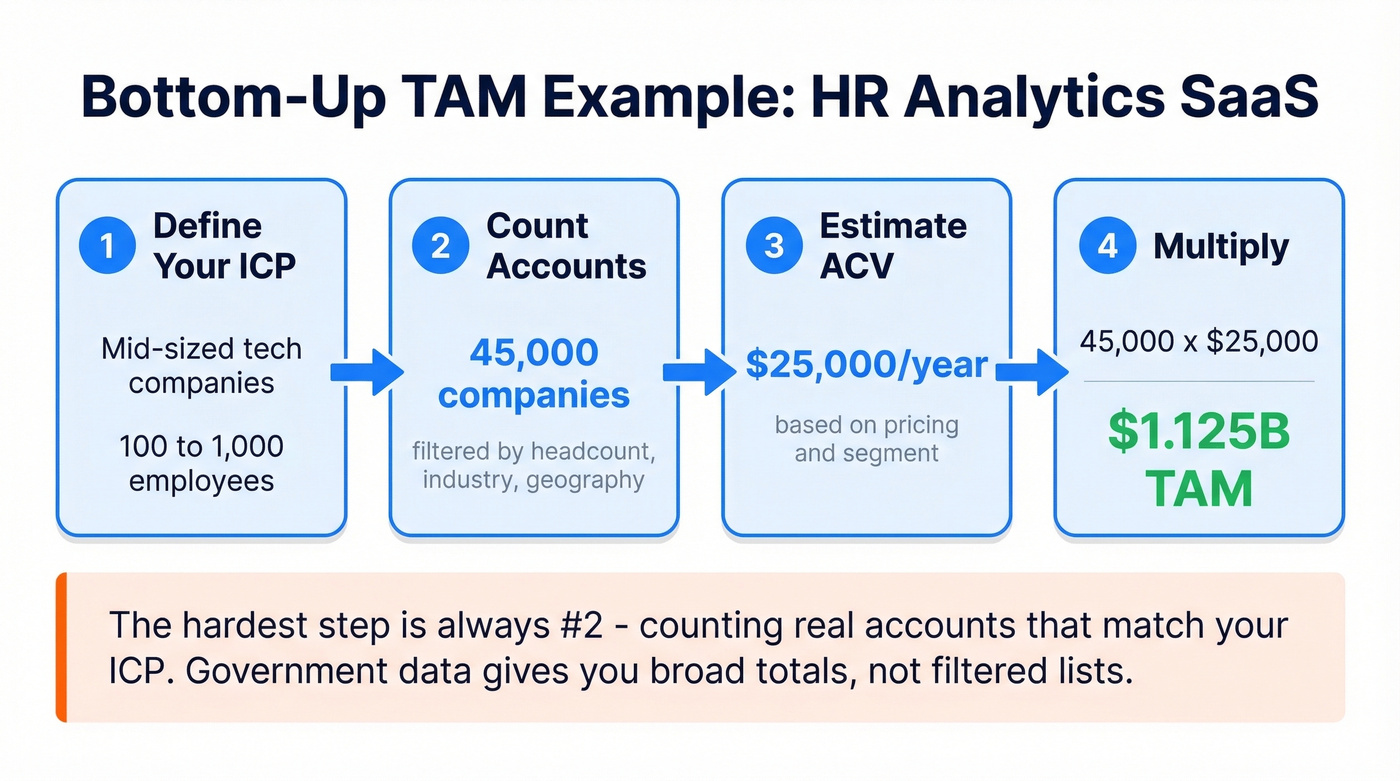
- Define your ICP: Mid-sized tech companies, 100-1,000 employees
- Count addressable accounts: 45,000 companies fit the criteria
- Estimate ACV: $25,000/year
- Multiply: 45,000 x $25,000 = $1.125B TAM
The hardest step is #2. Government databases give you broad industry totals, but they won't tell you how many mid-market tech companies with 100-1,000 employees exist in your target geography. For that level of specificity, you need a B2B data platform with granular filters - Prospeo's 30+ search criteria (headcount, industry, tech stack, funding stage) let you build that account list directly and export it, so your bottom-up number is grounded in real company data rather than extrapolation.
Every input is auditable. An investor can push back on your ACV or your account count, and you can show your work.
Consumer Product - Bottled Water (Top-Down)
Here's what top-down looks like in practice:
7.5B people x 1.9L/day x $0.32/L x 20% margin = ~$2.01T
That's a big number. It's also nearly useless for a pitch deck. You can't serve 7.5 billion people. You don't sell in every country. Your brand targets a specific price point and channel. Top-down gives you a ceiling to sanity-check your bottom-up number against - nothing more.
B2B Software - Accounting SaaS (Filtered Top-Down)
A filtered top-down approach adds rigor by making each assumption explicit:
| Filter | Count | Logic |
|---|---|---|
| Global businesses | 1B | Starting universe |
| Formal accounting | 300M | Excludes informal |
| Willing to pay for SaaS | 30M | 10% adoption rate |
| x $100/year ACV | - | Entry-level pricing |
| TAM | $3B | - |
Each filter is a defensible assumption. The investor can argue your 10% SaaS adoption rate should be 5% or 15%, and you can have that conversation productively. TAM is a framework for debate, not a final answer.
Uber - Dynamic TAM and the Damodaran Debate
The most famous TAM argument in startup history. In 2014, NYU professor Aswath Damodaran valued Uber by sizing the global taxi and car-service market at $100B, assumed Uber could capture 10%, and arrived at a $5.9B valuation.
Bill Gurley's rebuttal was devastating. He argued Damodaran could be off by 25x: "In choosing to use the historical size of the taxi and limousine market, Damodaran is making an implicit assumption that the future will look quite like the past."
Gurley was right. By 2022, Uber's quarterly gross bookings exceeded $26.4B - annualized, that's $105B+, which exceeds the entire original TAM estimate. The product didn't capture a market. It created new behavior.
If your product fundamentally changes behavior, static market sizing will undercount your opportunity. But you need to make that argument explicitly - investors won't give you credit for market expansion you can't articulate.
TAM to SAM to SOM Walkthrough (WeWork)
The WeWork case study from Toptal is one of the best public examples of a complete funnel from TAM down to serviceable obtainable market. This is an analyst model, not WeWork's own filing - but the methodology is textbook.
| Layer | Filter applied | Value | % of TAM | % of SAM |
|---|---|---|---|---|
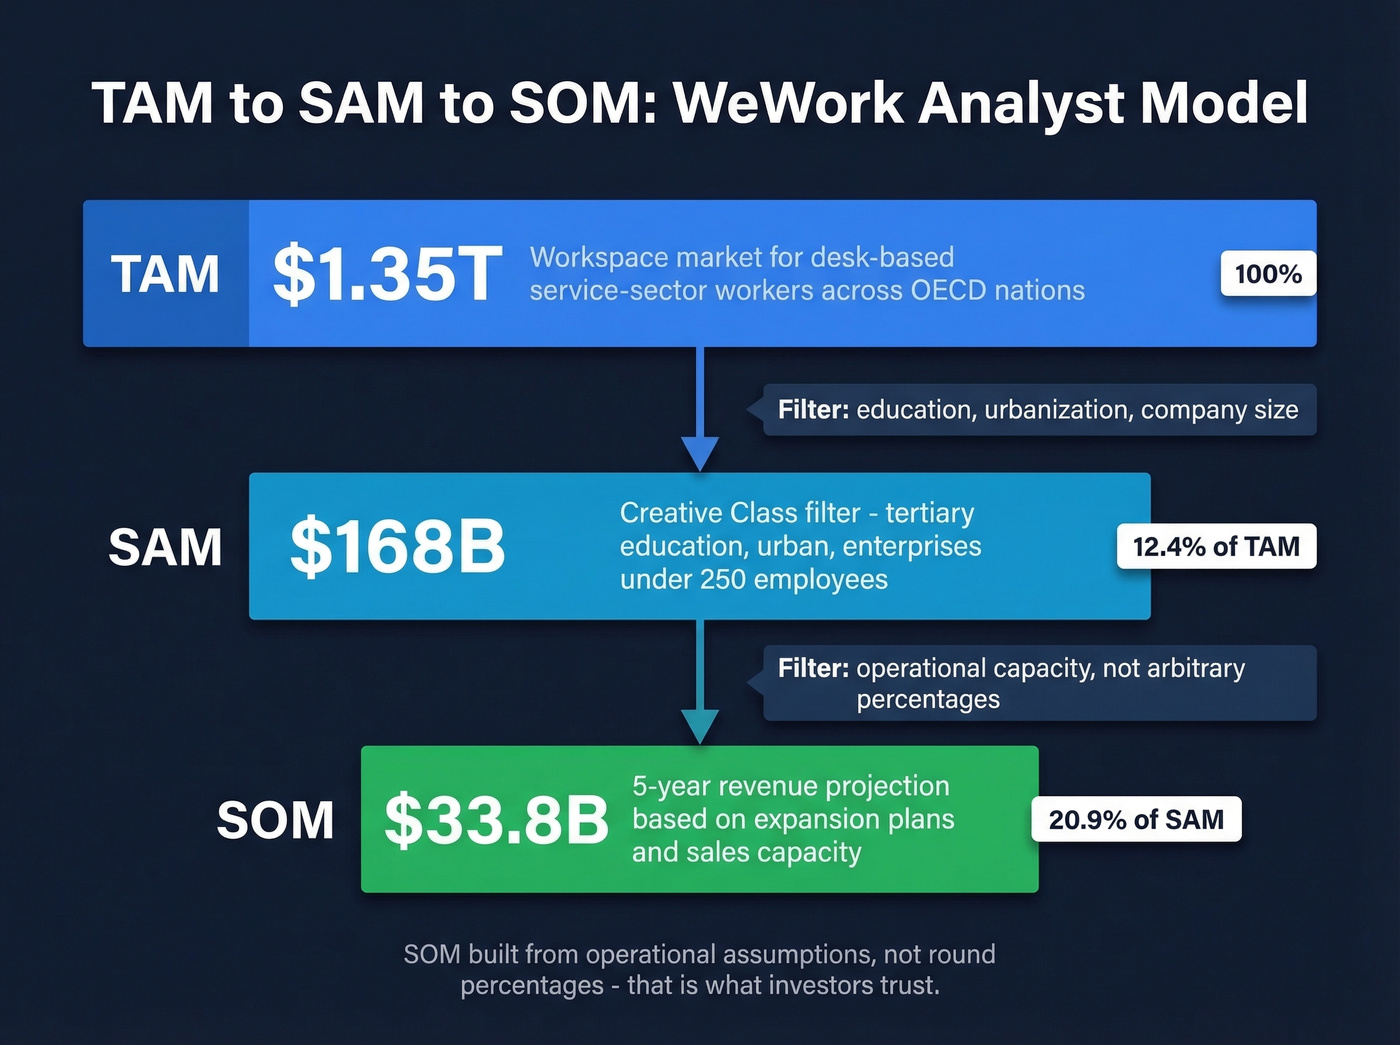
| TAM | Workspace market for desk-based service-sector workers across OECD nations | $1.35T | 100% | - |
| SAM | "Creative Class" filter | $168B | 12.4% | 100% |
| SOM | 5-year revenue projection | $33.8B | 2.6% | 20.9% |
The TAM starts with the total workspace market for desk-based service-sector workers across OECD nations - already more specific than "the global real estate market." SAM applies the "Creative Class" filter: tertiary education, urban, enterprises under 250 employees. Each filter represents a real constraint.
SOM is the five-year revenue projection based on actual expansion plans and sales capacity. Notice it's not "we'll capture 5% of SAM" - it's built from operational assumptions. That's the difference between a number investors trust and one they dismiss.
Your bottom-up TAM is only as good as your account count. Prospeo's database of 300M+ profiles with 30+ filters - headcount, industry, tech stack, funding stage, revenue - lets you build the exact ICP list your market sizing depends on. No extrapolation. Every company is real and auditable.
Ground your TAM in real company data, not guesswork.
5 TAM Mistakes That Kill Confidence
1. Market defined too broadly. A luxury vegan handbag brand claiming the entire handbag market as TAM is like a food truck claiming the entire restaurant industry. Your TAM should describe people who'd actually buy your specific product.
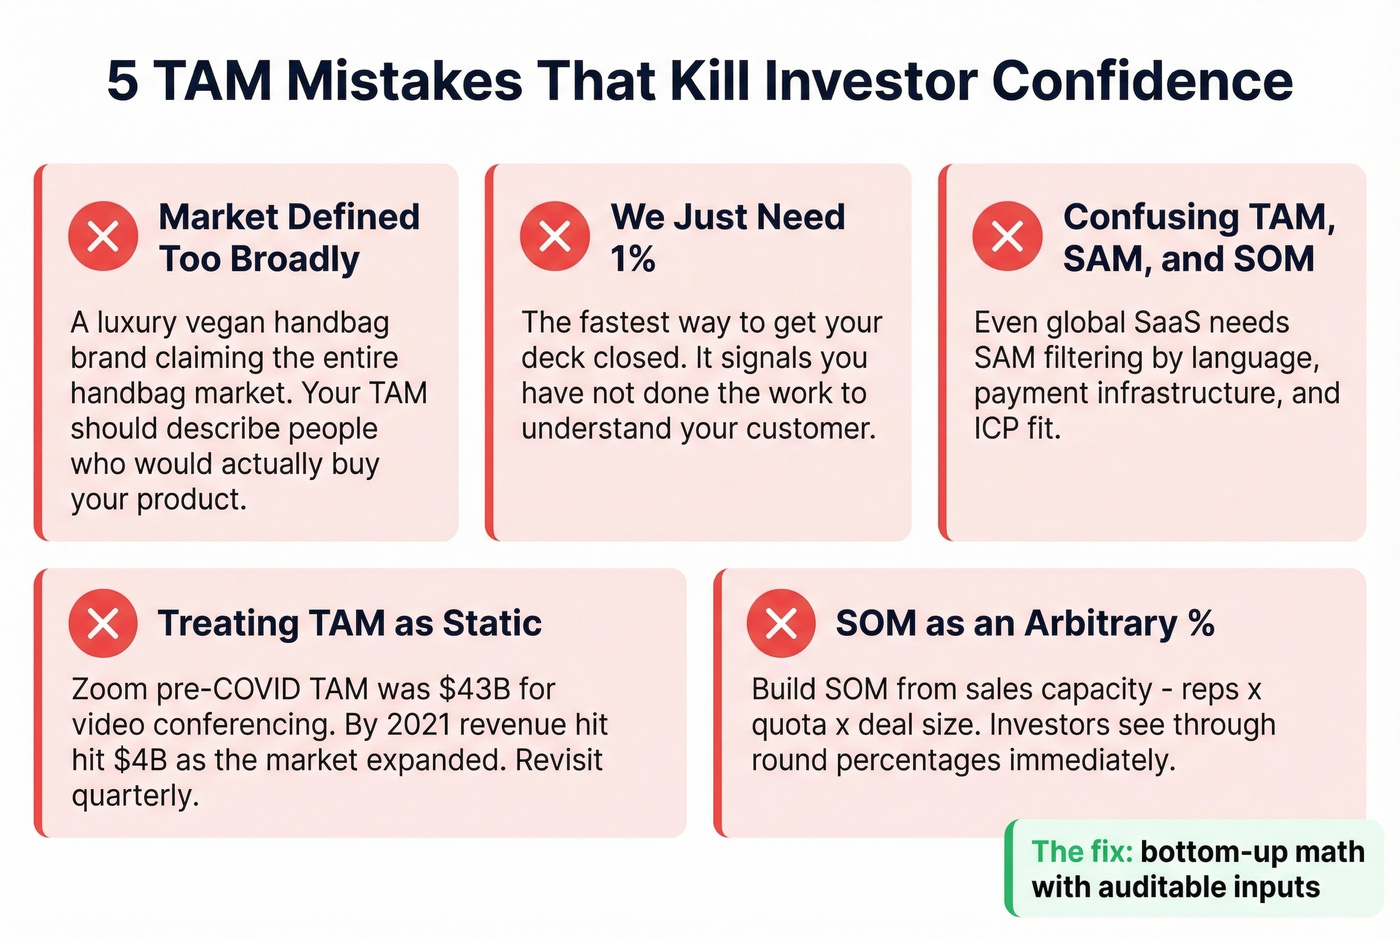
2. "We just need 1% of a huge market." The fastest way to get your deck closed. It signals you haven't done the work to understand who your customer actually is.
3. Confusing TAM, SAM, and SOM. We've seen this on r/startups - a crypto SaaS founder used 562M global crypto owners as TAM, then got stuck on whether SAM should be country-level for a globally accessible product. Even for global SaaS, SAM still requires filtering by language, payment infrastructure, ICP fit, and willingness to pay.
4. Treating TAM as static. Zoom's pre-COVID TAM for corporate video conferencing was framed around $43B. By 2021, annual revenue exceeded $4B as the product expanded far beyond its original enterprise audience. Revisit yours quarterly.
5. SOM as an arbitrary percentage. Build SOM from sales capacity: reps x quota x deal size. Investors see through round percentages immediately. A benchmark heuristic suggests 1% of SAM in Year 1, 3% in Year 2, 5% in Year 3 - but even that should be validated against your financial model.
Where to Find Data for Your TAM
Every TAM guide gives you the formula and then stops. That's like giving someone a recipe that says "combine ingredients" without telling them where to buy the ingredients.
Free sources include the U.S. Census Bureau, OECD databases, World Bank open data, Bureau of Labor Statistics, and industry association reports. These are solid for macro numbers - total businesses in a sector, workforce size, spending patterns.
Paid sources like Statista (~$199/mo), IBISWorld ($1,000-$3,000/report), and Gartner (often $2,000+ per report) are worth it if you need pre-built market models. Skip them if you're pre-seed and bootstrapping.
The real blocker is account counting. Here's the thing: we've seen this frustration repeatedly on Reddit - a founder selling camping hardware could find the global outdoor market size but had no way to determine how many specialty retailers in their niche would actually stock their product. Government databases give you industry totals, not ICP-level counts. For that level of filtering - mid-market SaaS companies with 50-200 employees that use HubSpot - you need a B2B data platform with granular search filters.

How Investors Evaluate Your TAM Slide
Investors spend an average of 3 minutes 44 seconds on your entire deck. Your market size slide gets a quick scan. In that window, they're looking for one thing: does this founder understand their customer?
Stop trying to make your TAM as big as possible. A tight, defensible $800M TAM signals you understand your market. An inflated $50B TAM signals you don't.
Let's be honest: if your average deal size is under $15K, you probably don't need a $5B+ TAM to build a great business. A focused $500M market with clear expansion paths and a real bottom-up model will outperform a fantasy $10B slide every time. We've seen decks where a smaller, well-argued TAM actually increased investor confidence because it showed the founder had done real segmentation work rather than just pulling a number from a Gartner PDF.
Build your SOM from sales capacity, not percentages. How many reps do you have? What's their quota? What's your average deal size? That math should match your financial projections. If your SOM implies 500 closed deals but your model shows 3 reps, the numbers don't add up - and investors will catch it.
Once you've sized the market, you need to reach it. Prospeo gives you 98% accurate emails and 125M+ verified mobile numbers for the accounts in your TAM - at $0.01 per email. Go from market sizing slide to booked meetings without switching tools.
Turn your TAM spreadsheet into a live pipeline today.
TAM Calculation Template
Here's the structure you need. Build this in a spreadsheet before you touch your pitch deck.
Market definition fields should cover geography, customer segment, product category, and time horizon (typically 3-5 years).
Your top-down table lists market layers, each with a source, year, and CAGR. Start broad, filter narrow, cite everything. Your bottom-up table flows from total companies in your universe to the percentage that fit your ICP, then to addressable companies, estimated ACV, and finally your bottom-up TAM. Every row should have a source or methodology note.
Assumption register lists every assumption with a sensitivity flag - high, medium, or low impact. If your ACV assumption changes by 20%, does your TAM move by $500M? Flag it.
Reconciliation rule: if your top-down and bottom-up TAM differ by more than 3x, revisit your assumptions. One of them is wrong. Read more on TAM, SAM, and SOM if you need a quick refresher. Visible.vc offers a free Google Sheet template that includes sensitivity analysis and is a solid starting point.
FAQ
What's a good TAM size for a startup?
Most VCs look for $1B+ TAM to underwrite venture-scale returns, but a defensible $500M with clear expansion paths beats a hand-wavy $10B number every time. The logic chain and bottom-up methodology matter more than the final figure.
How do you calculate TAM for a SaaS product?
Use bottom-up: define your ICP, count addressable accounts using government data or a B2B database with granular filters (headcount, industry, tech stack), then multiply by your annual contract value. The account count is the hardest input - invest time getting it right.
How often should you update your TAM?
Revisit quarterly or whenever your ICP, pricing, or geographic scope changes. Zoom's TAM expanded dramatically the year remote work went mainstream. Treat your market sizing as a living document, not a one-time slide.
What's the difference between TAM, SAM, and SOM?
TAM is total revenue if you had 100% market share. SAM filters TAM to the segment you can actually serve by geography, product fit, and language. SOM is what you can realistically capture in 1-3 years based on sales capacity and go-to-market plans - build it from rep count x quota x deal size, not a round percentage.