What's a Good Conversion Rate? It Depends on What You're Measuring
Amazon Prime members convert at 74%. Non-Prime members convert at 13%. Same site, same products, completely different numbers. That single stat should kill the idea that there's one universal answer to "what's a good conversion rate." A business owner on Reddit's r/PPC forum shared a 15.56% conversion rate - and was still losing money after ad spend and margins. The number alone tells you almost nothing.
Here's the thing: most teams obsessing over their conversion rate should be obsessing over revenue per visitor instead. A 1.1% rate on $50K deals is a machine. A 5% rate on leads that never close is a vanity dashboard.
Quick Benchmarks for 2026
The lazy answer is 2-5%. The real answer depends on your industry, traffic source, device mix, and what you're counting as a conversion.
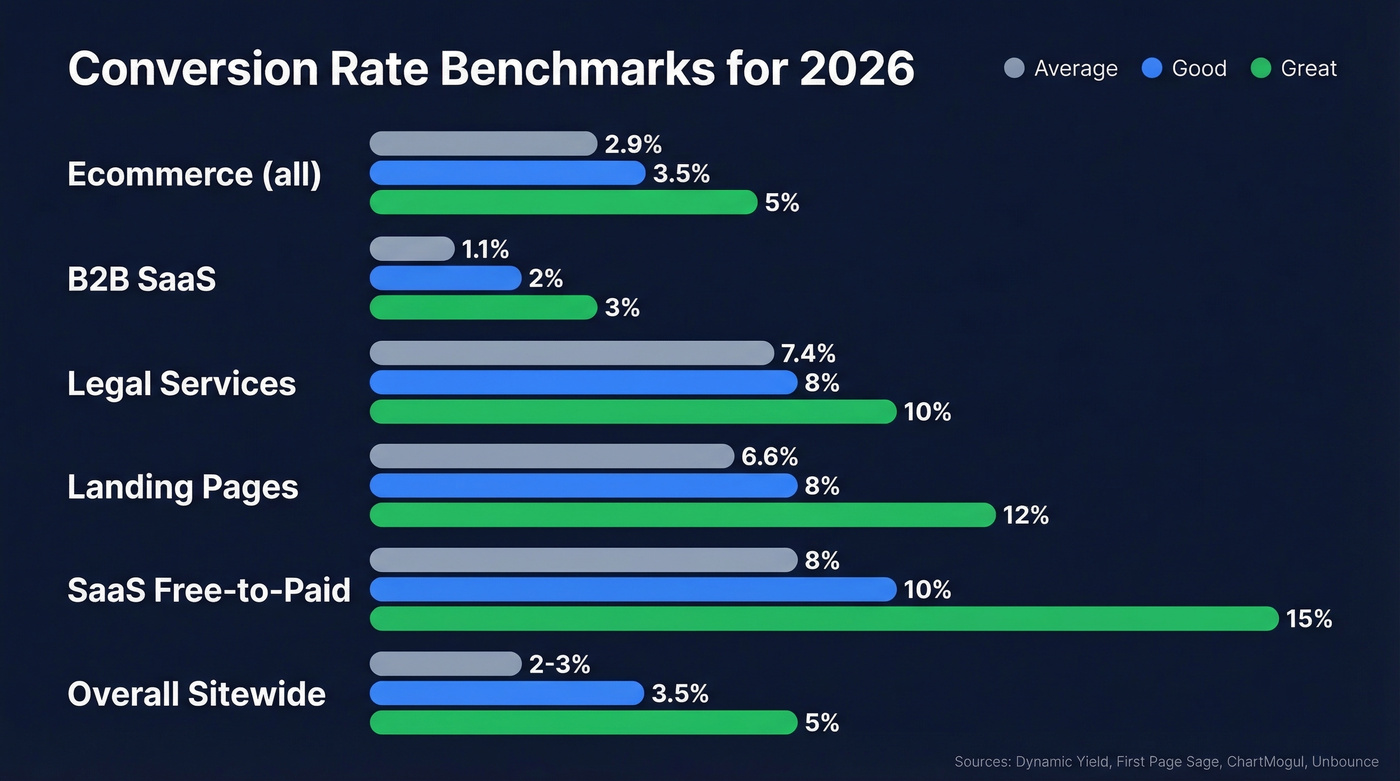
| Segment | Average | Good | Great |
|---|---|---|---|
| Ecommerce (all) | ~2.9% | 3.5%+ | 5%+ |
| B2B SaaS | 1.1% | 2%+ | 3%+ |
| Legal Services | 7.4% | 8%+ | 10%+ |
| Landing Pages | 6.6% | 8%+ | 12%+ |
| SaaS Free-to-Paid | 8% | 10%+ | 15%+ |
| Overall Sitewide | 2-3% | 3.5%+ | 5%+ |
Benchmarks by Industry
Ecommerce Rates
Dynamic Yield's dataset, as summarized by Smart Insights, aggregates across 200M+ monthly unique users, 400+ brands, and 300M+ total sessions. The overall ecommerce average lands around 2.9%, but category variation is massive. Food & Beverage hits 4.9%. Home & Furniture drags at 1.4%. If you're selling couches and benchmarking against a meal kit company, you'll feel terrible for no reason.
Separately, Ruler Analytics analyzed 100M+ data points across 14 industries and also found an average of 2.9% - but in that study, a "conversion" is a qualified lead, not necessarily a purchase. Don't treat it as an ecommerce checkout benchmark.
One thread on r/ecommerce captures this well: sellers of higher-priced or newer products report ~2% and wonder if something's broken. It's not. A 2% rate selling $2,000 furniture is a fundamentally different business than a 5% rate selling $15 snack boxes. Compare against your vertical, not "ecommerce."
B2B and Sales Conversion Rates
B2B is where the "2-5% is good" advice falls apart completely. First Page Sage tracked conversion rates across 25 industries using unique visitor data from Jan 2022 through Aug 2025, and the spread is enormous:
| Industry | Avg. CR |
|---|---|
| Legal Services | 7.4% |
| HVAC Services | 3.1% |
| Higher Education | 2.8% |
| Real Estate | 2.7% |
| Industrial IoT | 2.6% |
| Manufacturing | 2.2% |
| Financial Services | 1.9% |
| Construction | 1.9% |
| Transportation | 1.4% |
| B2B SaaS | 1.1% |
B2B SaaS sits at 1.1%. That's not a crisis - it's the nature of long sales cycles, high price points, and multi-stakeholder buying committees. If someone tells you 1.1% is "bad," ask them what their average deal size is. Typical sales conversion rates in enterprise B2B reflect complexity, not failure.
SaaS Free-to-Paid Rates
ChartMogul's Jan 2026 study of 200 B2B software products is the best data here. The median free-to-paid conversion is 8%, but that number hides a critical variable: whether you require a credit card upfront.
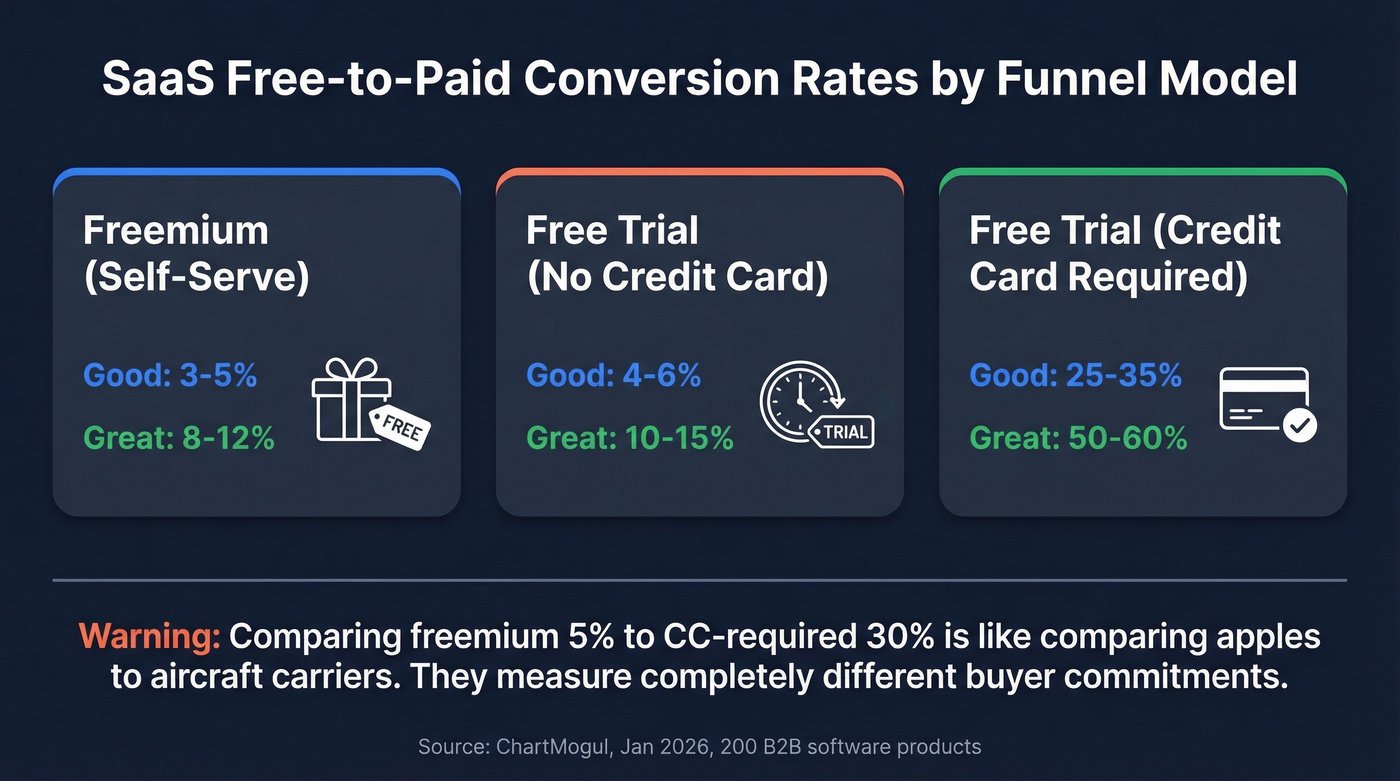
| Funnel Model | Good | Great |
|---|---|---|
| Freemium (self-serve) | 3-5% | 8-12% |
| Free trial (no CC) | 4-6% | 10-15% |
| Free trial (CC required) | 25-35% | 50-60% |
CC-required trials hit 30% median conversion. That's not because they're "better" - they measure a different thing entirely. You've already filtered out tire-kickers at signup. Comparing a freemium 5% to a CC-required 30% is like comparing apples to aircraft carriers.
Benchmarks by Traffic Source
Where your visitors come from matters as much as what you're selling. First Page Sage's traffic source data, spanning 2018-2023 across 150+ client accounts, shows clear patterns:
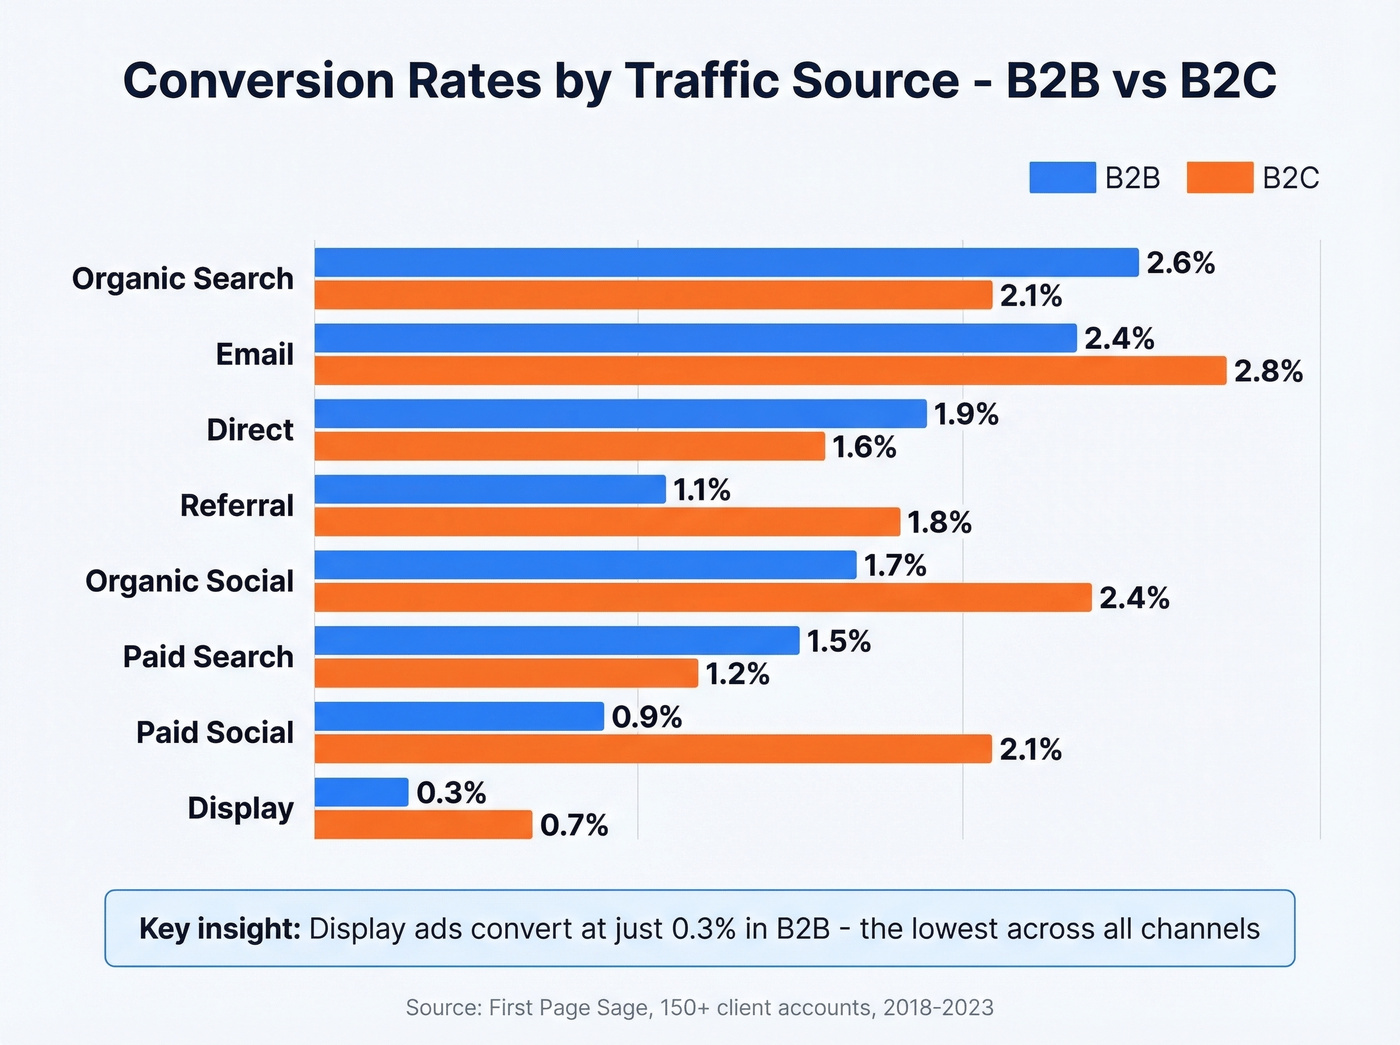
| Channel | B2B | B2C |
|---|---|---|
| Organic Search | 2.6% | 2.1% |
| 2.4% | 2.8% | |
| Direct | 1.9% | 1.6% |
| Referral | 1.1% | 1.8% |
| Organic Social | 1.7% | 2.4% |
| Paid Search | 1.5% | 1.2% |
| Paid Social | 0.9% | 2.1% |
| Display | 0.3% | 0.7% |
Display ads converting at 0.3% in B2B isn't a surprise to anyone who's run them. But here's what's less obvious: enterprise traffic converts lower than SMB traffic across every channel. Organic search hits 3.6% for SME-targeting companies but only 1.6% for enterprise. Bigger deals, longer cycles, more stakeholders.
Teams that segment by traffic source and company size before panicking about their overall number make dramatically better decisions.
B2B SaaS converts at 1.1%. At that rate, every lead matters - and bad data kills your funnel before it starts. Prospeo delivers 98% verified emails and 125M+ direct dials so the leads that do convert are real buyers, not dead ends.
Stop optimizing a funnel full of bad contacts. Fix the data first.
Mobile vs. Desktop
Mobile accounts for roughly 75% of ecommerce traffic but converts at just 2.8% versus desktop's 3.2% - a gap that used to be roughly 2x and has narrowed to about 1.7x. The bigger story is cart abandonment: 79% on mobile versus 68% on desktop. That 11-point gap represents enormous revenue sitting on the table.
If your analytics show a heavy mobile skew and you're benchmarking against desktop-heavy rates, segment by device before you draw conclusions.
Landing Pages vs. Sitewide
Your sitewide conversion rate and your landing page conversion rate measure completely different things. Unbounce analyzed 41,000+ landing pages with 464M unique visitors and found a median conversion rate of 6.6%. Sitewide averages sit at 2-3%.
That gap makes sense. Landing pages have one job and one CTA. Your homepage has navigation, blog links, an about page, and seventeen other ways for someone to wander off.
When a Higher Rate Actually Hurts
Let's be honest about something most conversion rate articles won't say: conversion rate is a proxy metric, not a business outcome. Optimizing a proxy can actively damage the thing you actually care about.
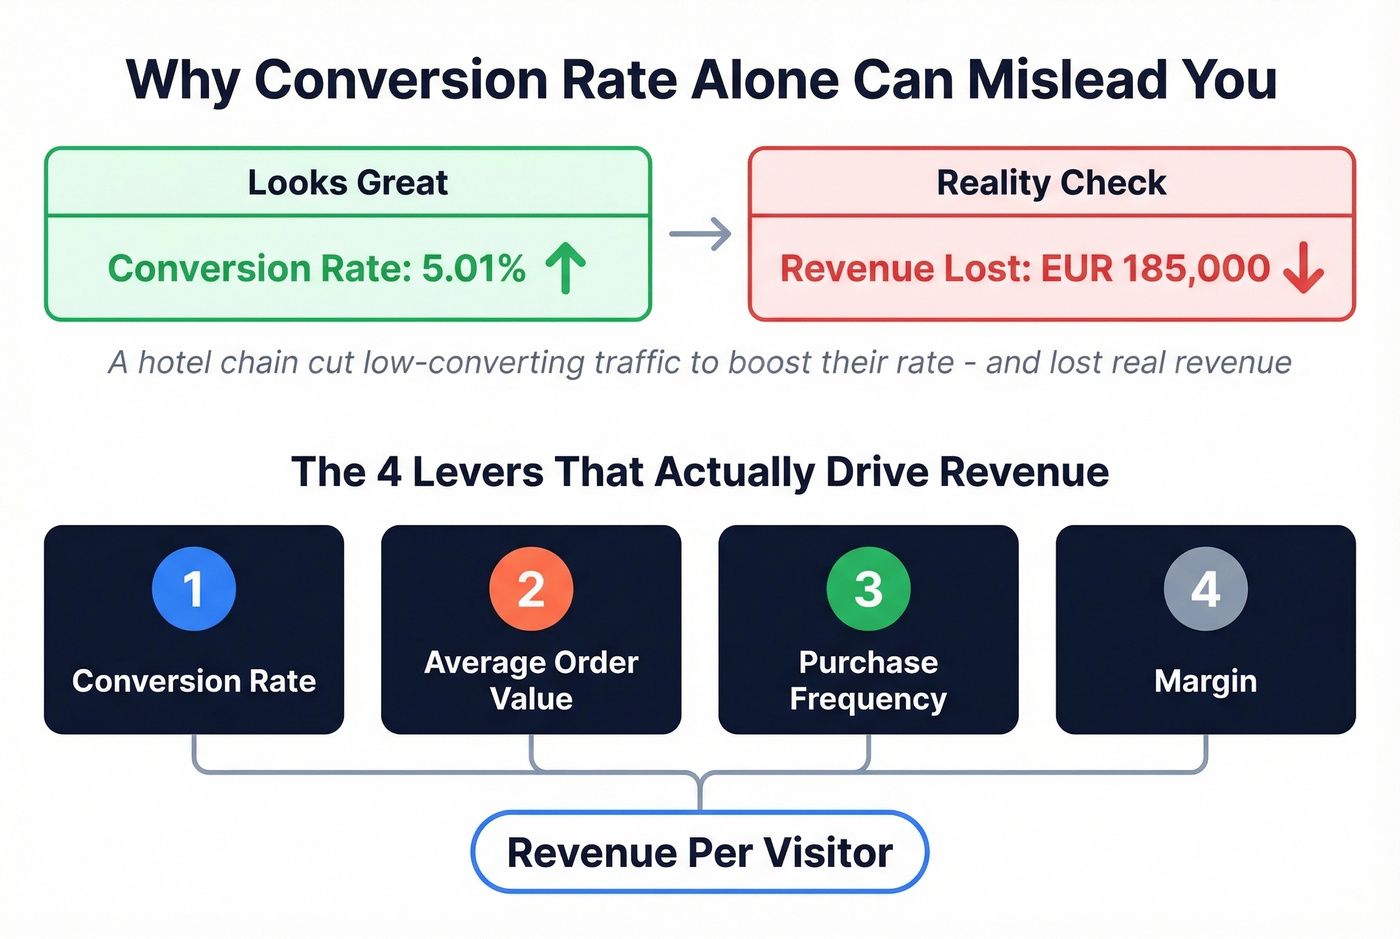
A hotel chain simulation from Mirai illustrates this perfectly. By cutting low-converting traffic channels, they pushed their conversion rate up to 5.01% - and lost EUR 185,000 in revenue. The "bad" traffic was still generating bookings at a lower rate, and those bookings still mattered.
As CXL's framework puts it: conversion rate is one number you can manipulate without making a cent more profit.
The smarter framework considers four levers: conversion rate, average order value, purchase frequency, and margin. We've seen teams chase rate lifts that actually destroyed their pipeline quality - a promo that tanks CR but doubles AOV can be your best quarter ever. Only 28% of companies say they're satisfied with their conversion rates, and we'd bet most of them are measuring the wrong thing.
If your conversion rate is climbing but revenue per visitor is flat or declining, you've got a vanity metric problem. Stop celebrating.
How to Fix a Low Rate
Diagnose First
Before you touch anything, figure out what's actually broken:
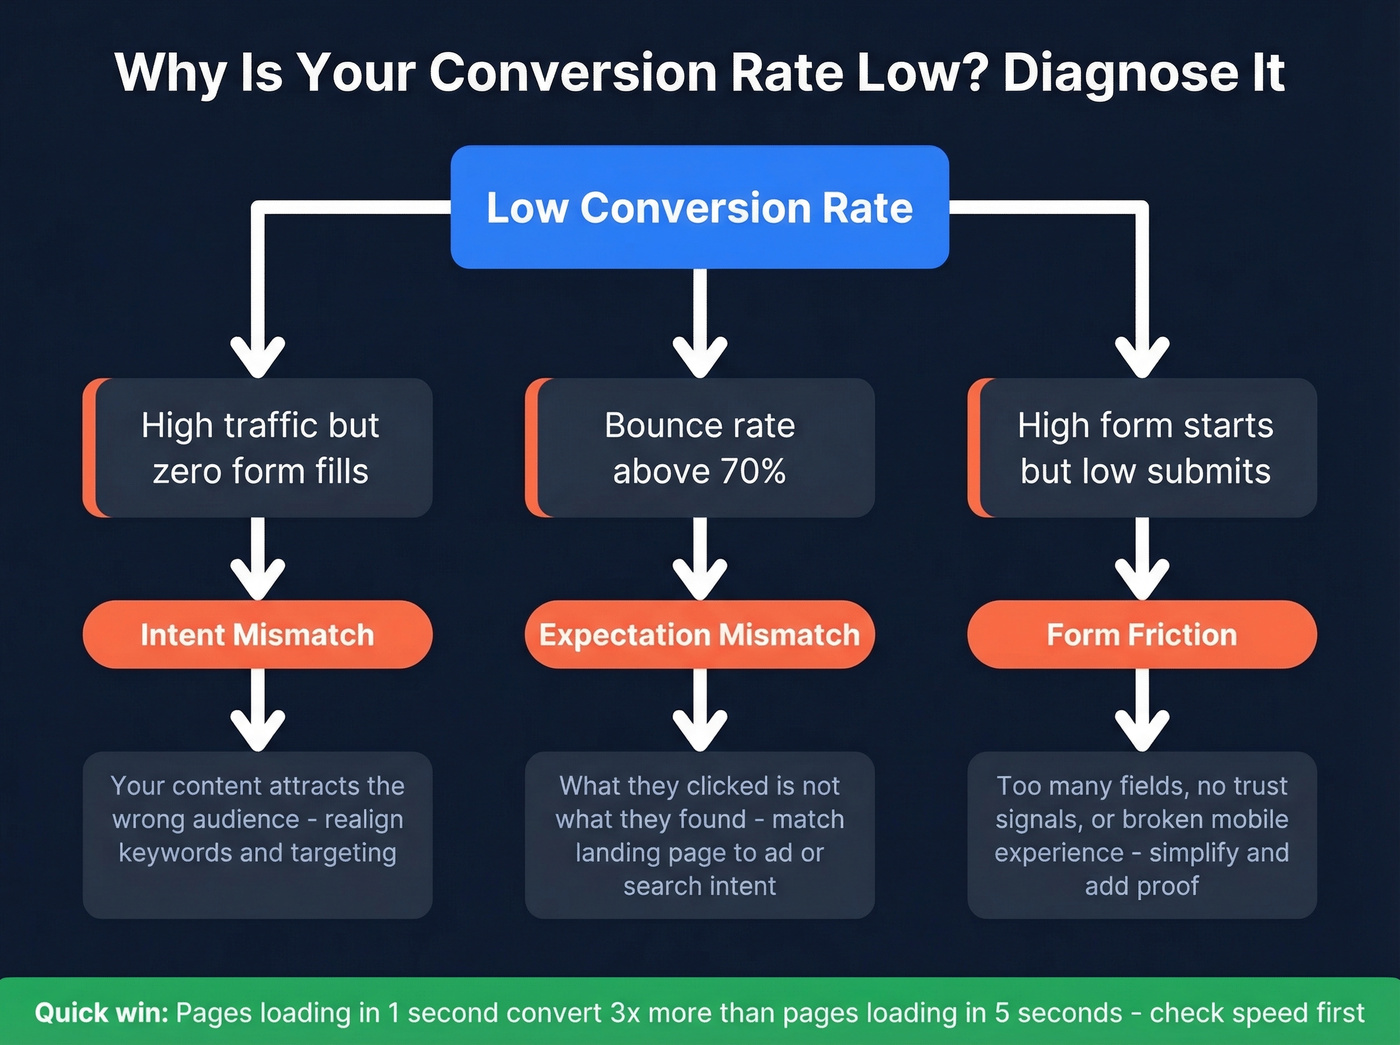
- High traffic, zero form fills - Intent mismatch. Your content attracts the wrong audience.
- Bounce rate above 70% - Expectation mismatch. What they clicked on isn't what they found.
- High form starts, low submits - Form friction or trust issues. Too many fields, no privacy signals, broken mobile experience.
Pages that load in 1 second convert 3x more than pages that take 5 seconds. Check your speed first - it's the cheapest fix with the biggest payoff.
Tactics That Move the Needle
Social proof near CTAs, clearer value propositions, and faster page loads are table stakes. What most teams don't know is that "reduce friction" isn't a universal law. A VWO case study found that adding an extra step to a flow increased conversions by 60%. Venture Harbour reported that multi-step forms lifted their conversion rate by 743% compared to a single long form. Sometimes friction filters out noise and builds commitment.
For outbound teams, there's a different problem entirely. If 35% of your emails bounce, you aren't converting 2% of prospects - you're converting 2% of the 65% that actually received your message. That's a data quality problem, not a conversion problem. Prospeo verifies emails in real time with 98% accuracy, so your conversion metrics reflect real humans, not dead addresses. One customer, Snyk, saw bounce rates drop from 35-40% to under 5% and AE-sourced pipeline climb 180%.
Skip the conversion rate optimization playbook entirely if your list quality is garbage. Fix the inputs first.
If you’re troubleshooting bounces specifically, start with bounce rates and then work through a full email deliverability checklist.
FAQ
What's a good ecommerce conversion rate?
The overall average is ~2.9%. Above 3.5% is strong. Food & Beverage leads at 4.9%, Home & Furniture trails at 1.4% - always benchmark against your specific vertical, not a cross-industry average.
What's a good B2B conversion rate?
It varies wildly by sector. Legal services average 7.4%, B2B SaaS averages 1.1%. Benchmark against your industry and deal size, not a generic "2-5%" range that ignores sales cycle length.
What's a good SaaS free-to-paid rate?
The median is 8%. For freemium models, 3-5% is solid. For CC-required trials, 25-35% is the norm. These measure fundamentally different buyer commitments, so don't compare them directly.
Is a 1% conversion rate bad?
Not necessarily. B2B SaaS averages 1.1%. If your average deal is $50K+, a 1% rate on qualified traffic powers serious revenue - rate without deal size context is meaningless.
How does bad data hurt my conversion rate?
If 35% of outbound emails bounce, your real audience is only 65% of your list - inflating your denominator and deflating your rate. Cleaning your data with real-time verification ensures you're measuring conversions against contacts who actually received your message.
You read it above: enterprise traffic converts lower across every channel. When each conversion costs more to earn, you can't afford 35% bounce rates torching your sender reputation. Prospeo's 7-day data refresh and 5-step verification keep bounce rates under 4%.
Convert fewer leads that actually close - starting at $0.01 per verified email.