Account Based Marketing Benchmarks: Every Number You Need in 2026
80% of organizations say they're running ABM. Only 29% measure it with ABM-aligned metrics. That gap - between "we do ABM" and "we can prove ABM works" - is where most programs quietly die.
The ABM market is projected to hit $3.81B by 2030, yet nearly half of teams still measure success by MQLs. On r/b2bmarketing, practitioners ask for even ballpark numbers and come up empty because ABM audiences are company-specific and universal figures are scarce. The benchmarks below are the closest thing to universal numbers that exist, and we've organized them by tier so you can actually find where your program sits.
The Three Numbers Your CEO Cares About
ABM delivers 137% average ROI based on a survey of 771 marketers. But that headline stat doesn't help you in a board meeting. These three do:
- Pipeline velocity lift - how much faster ABM accounts move through stages
- Account-to-opportunity conversion rate - what percentage of target accounts become real deals
- Deal size increase - how much larger ABM-sourced deals close compared to non-ABM
Everything else is a supporting metric. Let's get into the ranges.
ABM Benchmark Table by Tier
Most "benchmark" articles give you a single number with no context. A 15% account-to-opportunity conversion rate is strong in manufacturing and mediocre in SaaS. The table below breaks metrics into tiers so you can see where you actually stand.
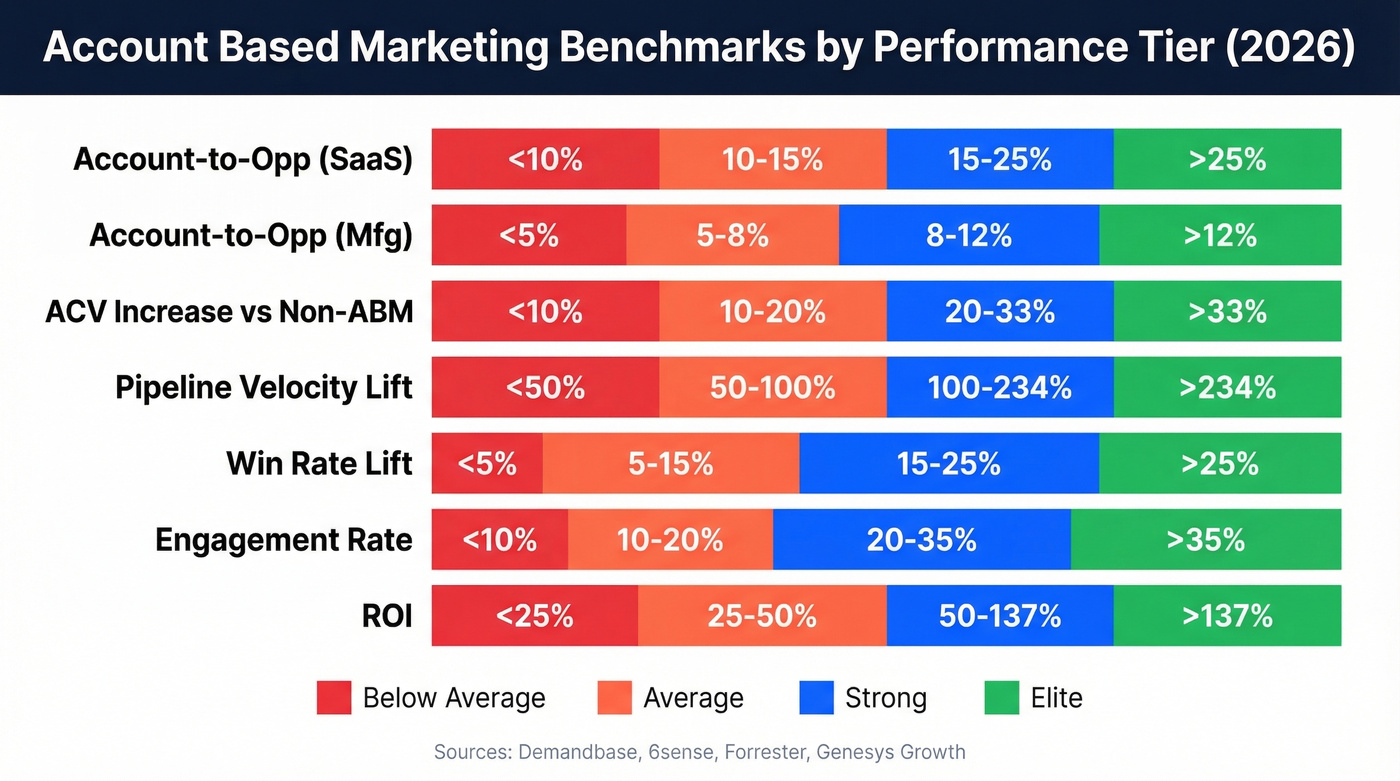
| Metric | Below Average | Average | Strong | Elite |
|---|---|---|---|---|
| Account-to-Opp (SaaS) | <10% | 10-15% | 15-25% | >25% |
| Account-to-Opp (Mfg) | <5% | 5-8% | 8-12% | >12% |
| ACV Increase vs Non-ABM | <10% | 10-20% | 20-33% | >33% |
| Pipeline Velocity Lift | <50% | 50-100% | 100-234% | >234% |
| Win Rate Lift | <5% | 5-15% | 15-25% | >25% |
| Engagement Rate | <10% | 10-20% | 20-35% | >35% |
| ROI | <25% | 25-50% | 50-137% | >137% |
SaaS companies convert target accounts to opportunities at 15-25% while manufacturing runs 8-12%. ABM-sourced deals close 33% larger on average, and ad-influenced accounts move through pipeline 234% faster.
Across multiple studies, 76-87% of ABM teams report higher ROI than non-ABM approaches.
Enterprise vs. Mid-Market
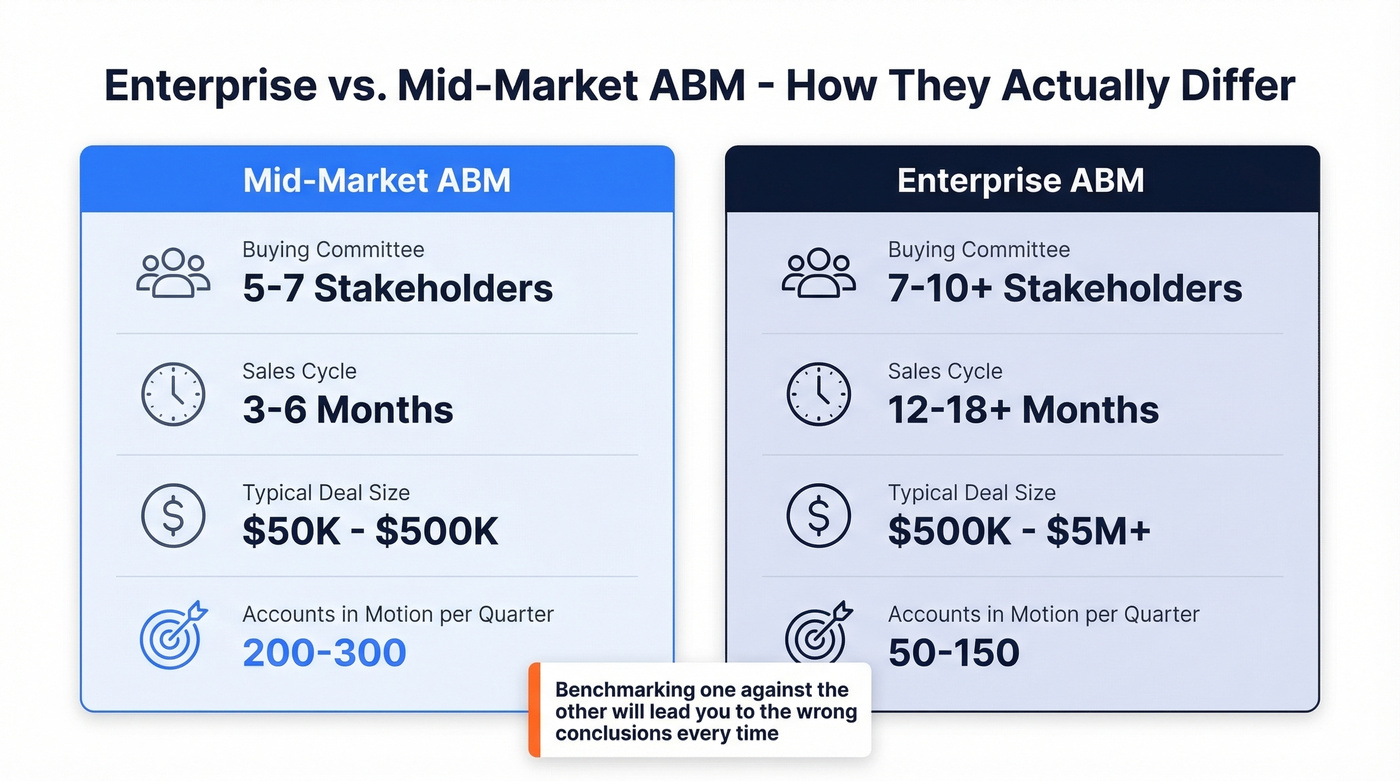
An enterprise ABM program and a mid-market program look nothing alike operationally. Benchmarking one against the other will lead you to the wrong conclusions every time.
| Dimension | Mid-Market | Enterprise |
|---|---|---|
| Buying Committee Size | 5-7 stakeholders | 7-10+ stakeholders |
| Sales Cycle | 3-6 months | 12-18+ months |
| Typical Deal Size | $50K-$500K | $500K-$5M+ |
| Accounts in Motion/Qtr | 200-300 | 50-150 |
Mid-market teams need 200-300 accounts in motion each quarter to drive meaningful pipeline. Enterprise programs run tighter ICP-matched lists but require deeper multi-threading across larger buying committees - think 7-10+ stakeholders who all need to be touched with relevant messaging before a deal progresses. We've seen teams that segment benchmarks by these tiers reach actionable insights significantly faster than those blending everything together.
Mid-market ABM needs 200-300 accounts in motion per quarter. That means verified emails and direct dials for 5-7 stakeholders per account - over 1,000 contacts that need to be accurate. Prospeo delivers 98% email accuracy and 125M+ verified mobiles with 30+ filters including buyer intent, technographics, and headcount growth to nail your target account lists.
Build your entire ABM contact list in minutes, not weeks.
ROI & Pipeline Benchmarks
Forrester's data shows most ABM programs report 21-50% higher ROI compared to non-ABM approaches, with deal sizes running 11-50% larger. 64% of teams report shorter sales cycles after implementing ABM.
Contact-level ABM - targeting specific people within accounts - drives up to 74% higher meeting conversion and 118% more pipeline. One practitioner on r/GrowthHacking shared enterprise fintech results: $51M in pipeline with an 84% engagement-to-pipeline conversion rate across 28 new logos. That's an outlier, but it shows what's possible when account selection and contact coverage are dialed in.
Here's the thing: if your average deal size is under $25K, you probably don't need ABM at all. The orchestration overhead eats the margin. ABM's ROI advantage kicks in when deal sizes justify the per-account investment.
Engagement & Operational Metrics
Mature ABM teams run 50+ meaningful touchpoints per account per quarter. Newer teams typically manage 20-30, and that gap is more about orchestration maturity than budget.
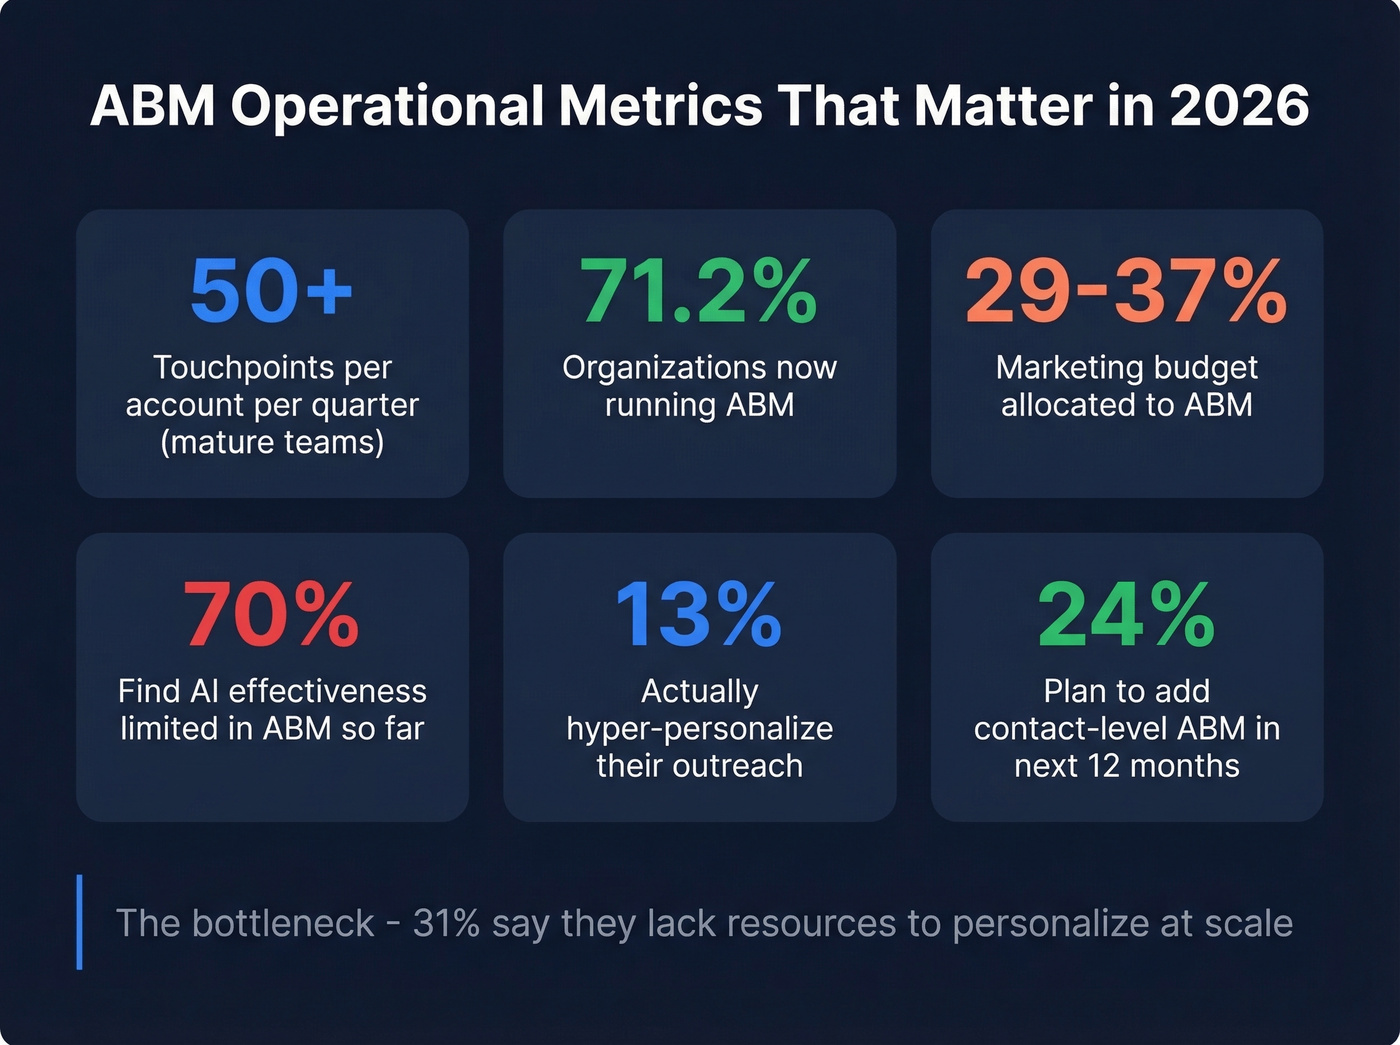
Budget allocation runs 29-37% of total marketing spend dedicated to ABM. Adoption sits at 71.2% across organizations surveyed. While 78.7% incorporate AI into their ABM workflows, nearly 70% find its effectiveness limited so far - a number that surprised us, given how much vendor marketing suggests otherwise.
Only 13% of teams actually hyper-personalize outreach, though 24% plan to implement contact-level ABM in the next 12 months. The bottleneck: 31% say they lack resources to personalize at scale. Everyone else is running "personalized" campaigns that amount to swapping a company name into a template.
A practical engagement scoring model worth trying: assign 1 point for ad impressions, 5 for content downloads, 10 for demo requests, 20 for direct sales contact. Accounts scoring 50+ in a quarter are "hot." It's crude, but it beats the nothing that most teams are working with.
Why Your ABM Benchmarks Are Probably Misleading
Most ABM measurement is broken. KPIs are tied to goals and timeframes; metrics inform those goals - conflating the two is why ABM dashboards become noise. Here's where we see teams go wrong most often:
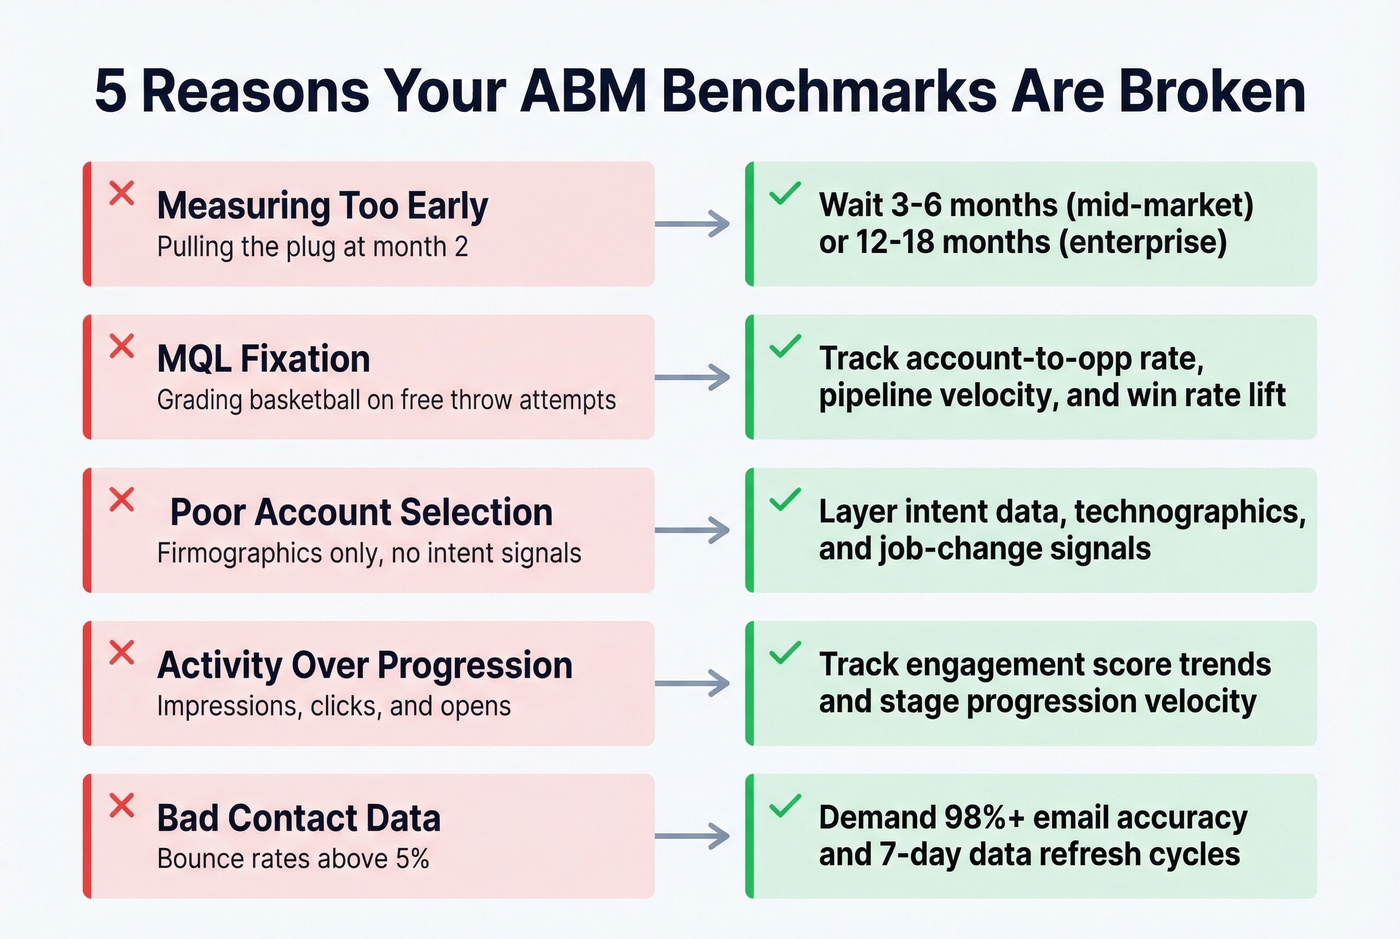
Measuring too early. Mid-market ABM takes 3-6 months to show pipeline impact. Enterprise takes 12-18+. Pulling the plug at month two is the single most common mistake, and it's usually driven by leadership expecting demand-gen timelines from an account-based motion.
MQL fixation. Nearly half of ABM teams are still measured by MQLs. That's like grading a basketball team on free throw attempts instead of wins.
Poor account selection. Firmographics-only targeting - no intent signals, no technographic data - means you're marketing to accounts that aren't in-market. Account penetration rates suffer. Layering buyer intent data alongside technographic and job-change signals dramatically improves target list quality. Tools like Prospeo track 15,000 intent topics via Bombora, which helps narrow lists to accounts showing real buying behavior.
Activity over progression. Impressions, clicks, and opens tell you nothing about whether an account is moving through buying stages. Track account engagement score trends, multi-threaded contact coverage, and stage progression velocity instead. Those give you a far clearer picture of program health.
Bad contact data. This one's a silent killer. If your bounce rate is above 5%, your engagement scores are fiction - every bounced email is a touchpoint that never happened. Snyk cut bounce rates from 35-40% to under 5% after switching to Prospeo's 98% accuracy emails with a 7-day refresh cycle, and their AE-sourced pipeline jumped 180%. Skip this problem entirely by auditing your data quality before you audit your ABM strategy.

How to Set Your Own Targets
Industry averages are for sanity-checking, not goal-setting. We've watched teams waste quarters chasing someone else's numbers instead of improving their own. Here's a better approach:
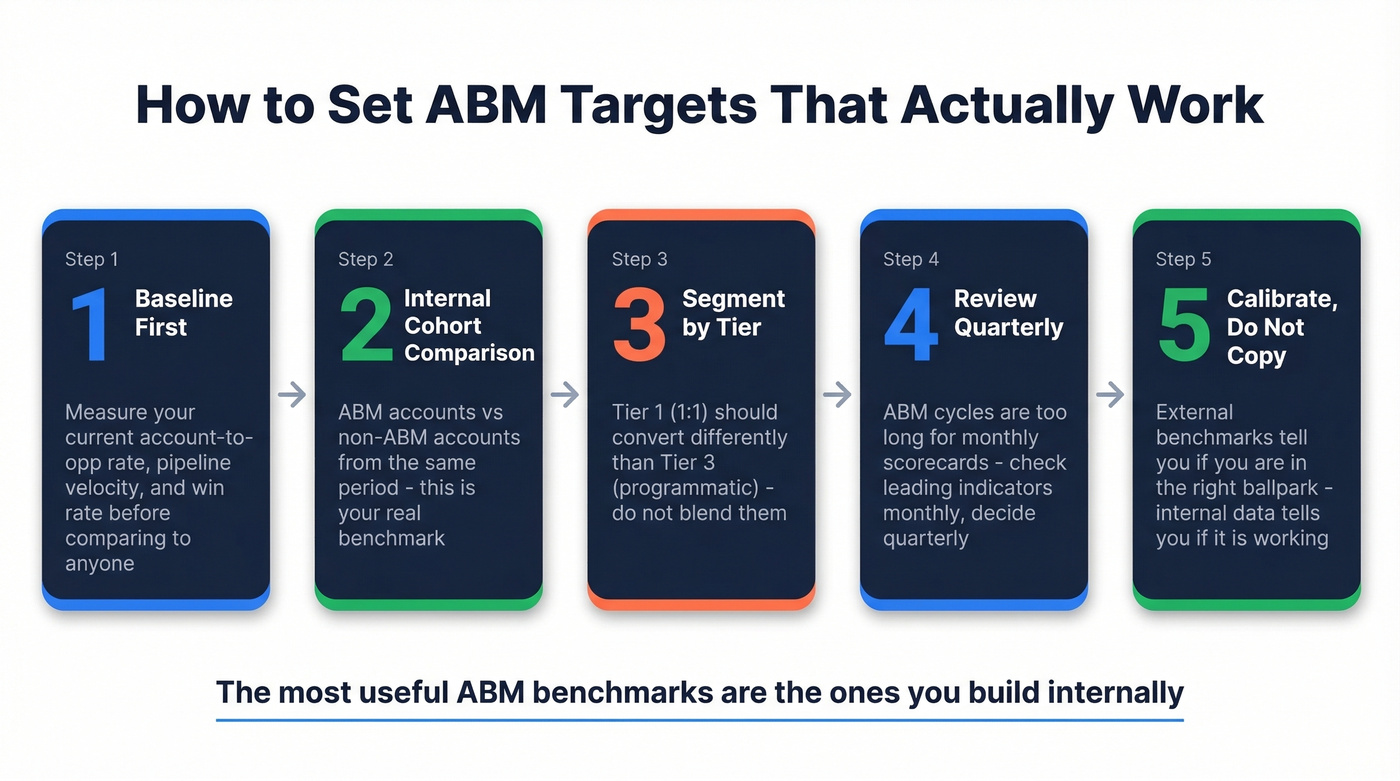
Baseline first. Measure your current account-to-opportunity rate, pipeline velocity, and win rate before comparing to anyone else. You can't improve what you haven't measured, and external benchmarks are meaningless without internal context.
Run an internal cohort comparison. ABM accounts vs. non-ABM accounts from the same period. That delta is your real benchmark - it controls for your market, your ICP, and your sales motion in ways no industry report can.
Segment by account tier. Your Tier 1 (1:1) accounts should convert differently than Tier 3 (programmatic). Blending them hides signal.
Review quarterly, not monthly. ABM cycles are too long for monthly scorecards to be meaningful. Monthly check-ins on leading indicators are fine, but don't make strategic decisions on 30 days of data.
Use external benchmarks to calibrate, not to set targets. Your ICP, market, and sales motion are unique. External numbers tell you if you're in the right ballpark. Nothing more.
The most useful account based marketing benchmarks are the ones you build internally - comparing ABM cohorts against non-ABM cohorts within your own pipeline. External data tells you whether your program is in the right universe; internal data tells you whether it's actually working.
Bad contact data is the silent killer of ABM benchmarks. If your bounce rate is above 5%, your engagement scores are fiction. Prospeo's 5-step verification and 7-day data refresh cycle keep bounce rates under 4% - and intent data across 15,000 Bombora topics ensures you're targeting accounts that are actually in-market.
Stop measuring ABM engagement against bounced emails and stale data.
FAQ
What's a good ROI for ABM?
Most programs report 21-50% higher ROI than non-ABM approaches, with the average across a 771-marketer survey landing at 137%. Programs with deal sizes above $100K and tight ICP targeting consistently hit the upper end of that range.
How many target accounts should an ABM program have?
Mid-market teams need 200-300 accounts in motion per quarter to generate meaningful pipeline. Start with 50-200 high-quality accounts before scaling - spreading too thin kills personalization and engagement scores.
How long before ABM shows results?
Mid-market programs typically show pipeline impact in 3-6 months; enterprise programs take 12-18 months or longer. Measuring too early is the top reason leadership kills ABM programs prematurely.
What's the biggest data quality mistake in ABM?
Running campaigns on stale or unverified contact data. Bounce rates above 5% corrupt engagement scores and waste touchpoints. A 7-day data refresh cycle and 98%+ email accuracy are the baseline you should demand from any data provider.