Account Executive KPIs: 10 Metrics + Benchmarks (2026)
Only 51% of AEs hit quota. Cross-industry win rates average around 21%. Sales cycles have stretched 32% since 2021. If you're tracking the wrong account executive KPIs - or tracking too many - you're flying blind.
Here's the tight set of metrics that actually predict whether your AEs will close.
The Quick Stack
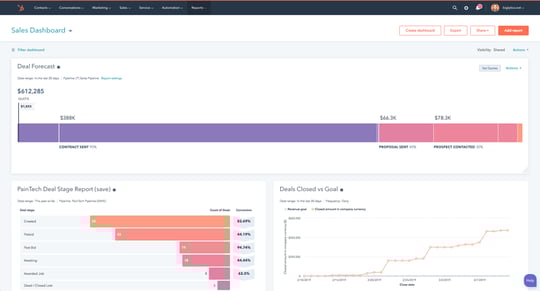
Don't build a 20-widget dashboard nobody opens. NetSuite recommends 5-7 reports max before cognitive load kills adoption.
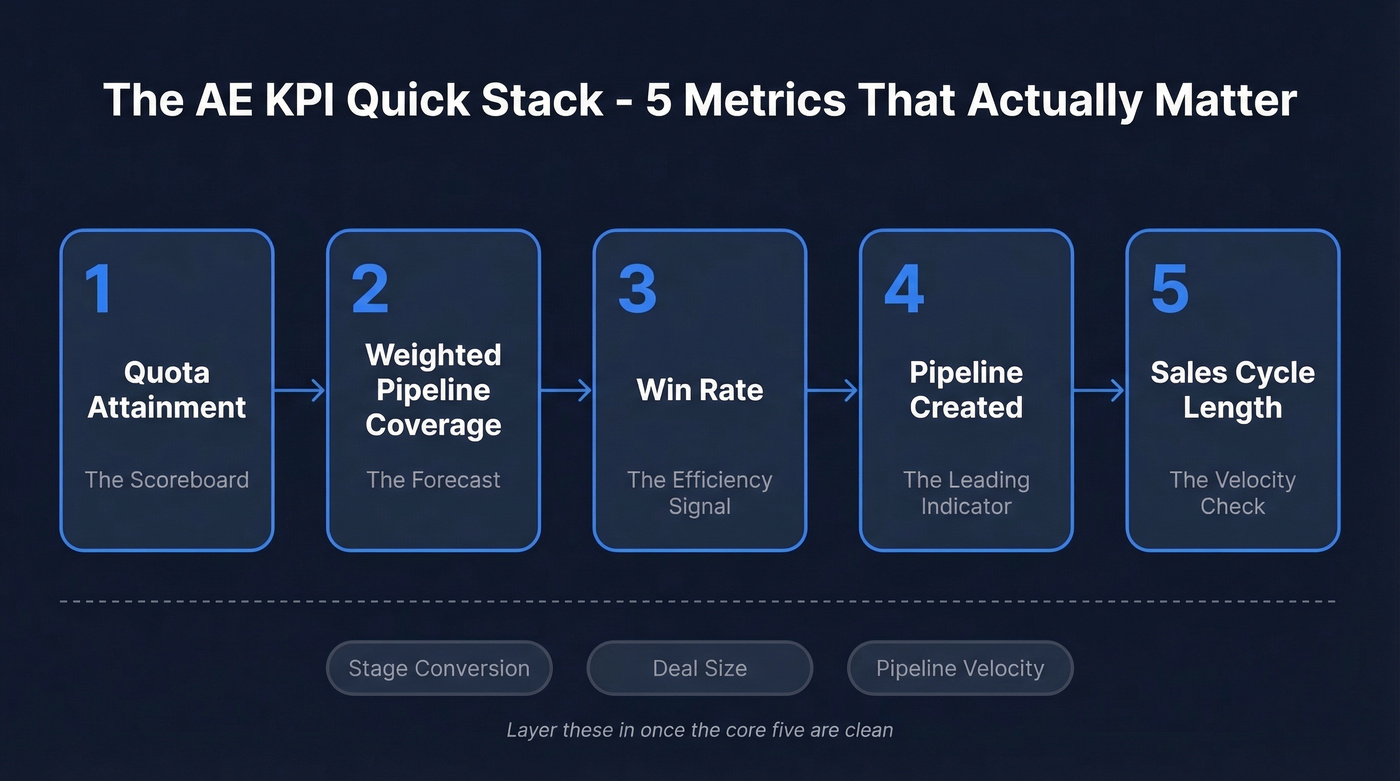
- Quota attainment - the scoreboard
- Weighted pipeline coverage - the forecast
- Win rate - the efficiency signal
- Pipeline created - the leading indicator
- Sales cycle length - the velocity check
Once those five are clean, layer in stage conversion rates, deal size, and pipeline velocity. Most AE teams don't need more than seven metrics reviewed weekly. The rest is noise.
AE KPIs vs AM KPIs
AEs are hunters. AMs are farmers. Mixing their metrics is the fastest way to build a useless dashboard.
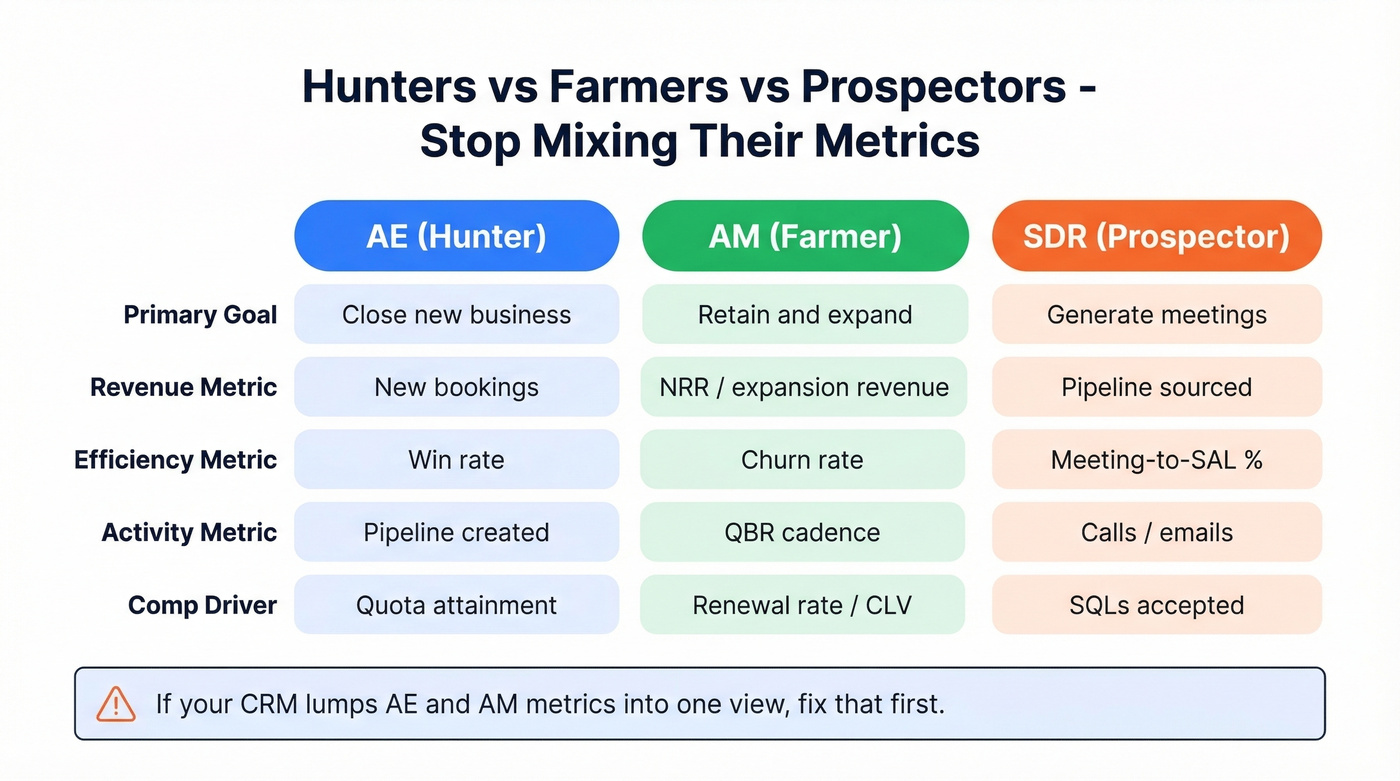
| Metric | AE (Hunter) | AM (Farmer) | SDR |
|---|---|---|---|
| Primary goal | Close new business | Retain & expand | Generate meetings |
| Revenue metric | New bookings | NRR / expansion | Pipeline sourced |
| Efficiency metric | Win rate | Churn rate | Meeting-to-SAL % |
| Activity metric | Pipeline created | QBR cadence | Calls / emails |
| Comp driver | Quota attainment | Renewal rate / CLV | SQLs accepted |
If your CRM lumps AE and AM metrics into one view, fix that first.
10 Metrics Every AE Should Track
1. Quota Attainment
Average quota attainment runs 74%, and only 51% of AEs actually hit their number. Those are different lenses: one is average attainment percentage, the other is the share of reps crossing the finish line. If your team is consistently below 60%, stop blaming reps - fix your targets or your pipeline inputs.
2. New Bookings / Closed-Won Revenue
Raw revenue closed in a period. With the standard 50/50 base-to-variable mix, this number drives the variable half of an AE's paycheck. Track monthly for velocity sellers, quarterly for enterprise.
3. Pipeline Created ($)
Pipeline created is the most underweighted metric in sales. Full stop. It's also one of the cleanest leading indicators you can manage without turning your scorecard into an activity quota.
Define it clearly: new qualified opportunities created by the AE within a rolling 30-day window. No recycled deals, no "re-opened" from last quarter.
4. Pipeline Coverage (Unweighted)
Formula: total open pipeline / quota target.
| Segment | Target Coverage |
|---|---|
| SMB (high-velocity) | 2-3x |
| Mid-market | 2.5-4x |
| Enterprise | 3-5x |
Benchmarks from Outreach are useful starting points, but they're just that - starting points. Your actual close rates should dictate the multiplier.
5. Weighted Pipeline Coverage
Unweighted coverage treats every deal as equally likely to close. That's lazy math.
Weighted coverage multiplies each opportunity's value by its stage probability - what Salesforce calls Expected Revenue. A $100K deal at 30% contributes $30K, not $100K. This is the number your forecast should run on, and it's the metric that separates teams who forecast accurately from teams who spend the last two weeks of every quarter scrambling.
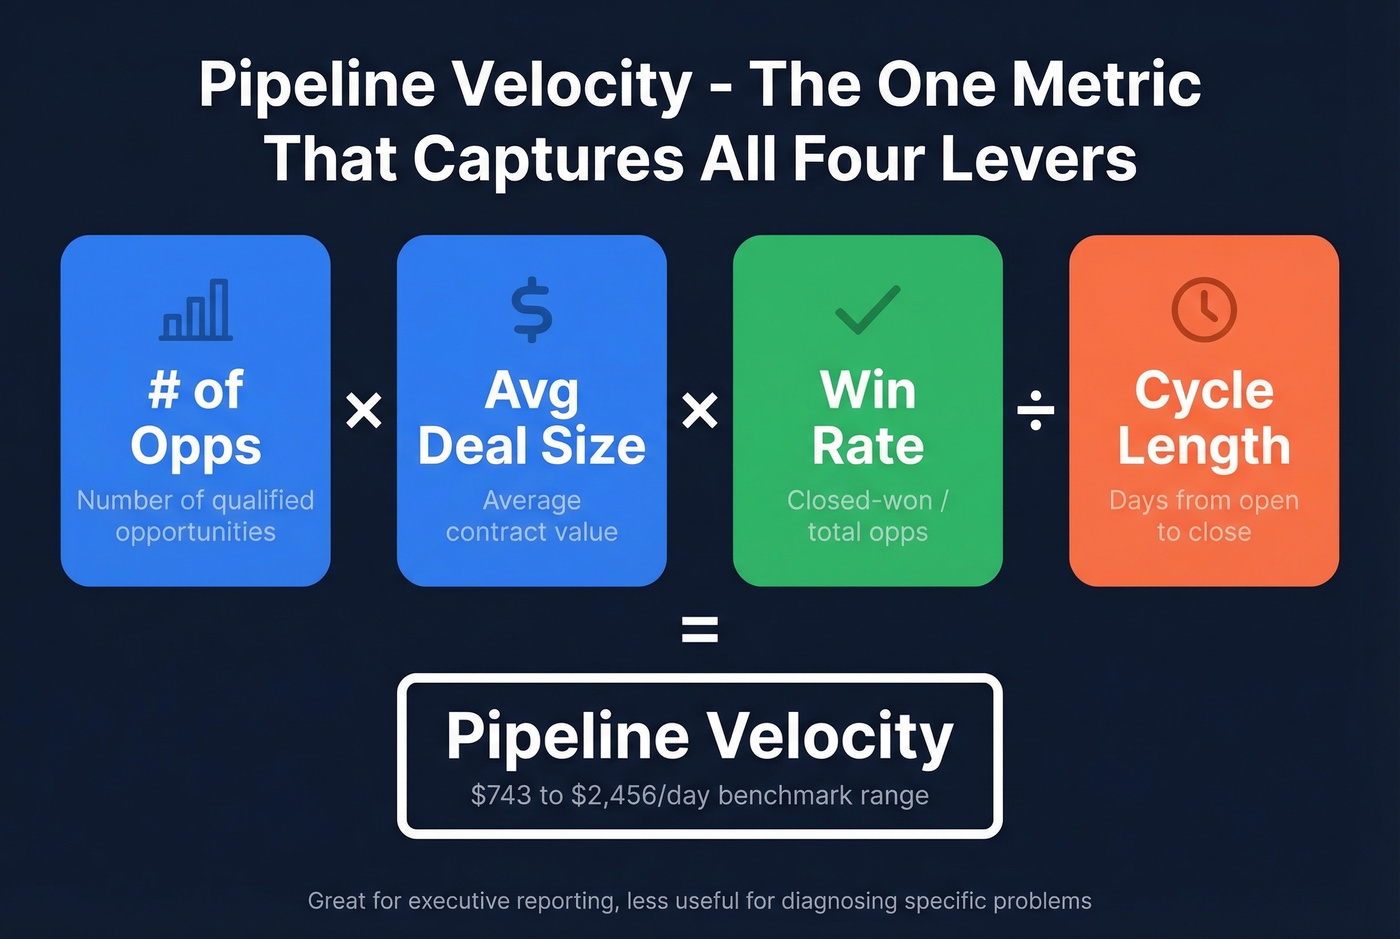
6. Pipeline Velocity
(# of opps x avg deal size x win rate) / sales cycle length. Benchmarks range from $743 to $2,456/day. Velocity is the single metric that captures all four levers at once, which makes it great for executive reporting but less useful for diagnosing specific problems. If you want a deeper breakdown of Pipeline Velocity, start with the levers before you chase the number.
7. Stage Conversion Rates
Track stage-to-stage, not just top-to-bottom. In SaaS funnel benchmarks, opportunity-to-close runs about 31% for enterprise and closer to 39% for SMB/mid-market. When a specific stage shows a drop-off, that's where coaching should focus - not at the end of the funnel when it's too late.
8. Win Rate
Typical win rates land between 20-30%, with cross-industry averages around 21%. Below 15%, you have a qualification problem. Above 35%, your pipeline is probably too conservative - you're leaving deals on the table by not swinging at harder opportunities.
9. Average Deal Size
Median private SaaS deal size is $26,265. A shrinking deal size with stable win rates means reps are discounting or selling to smaller accounts. Investigate both. A growing deal size with declining win rates usually means reps are reaching upmarket without the right enablement.
10. Sales Cycle Length
Cycle length scales directly with ACV. The full breakdown:
Sales Cycle Benchmarks
| ACV Band | Avg Cycle (Days) |
|---|---|
| < $1K | 25 |
| $1K-$5K | 40 |
| $5K-$10K | 55 |
| $10K-$50K | 75 |
| $50K-$100K | 120 |
| $100K-$250K | 170 |
| $250K-$500K | 220 |
| > $500K | 270 |
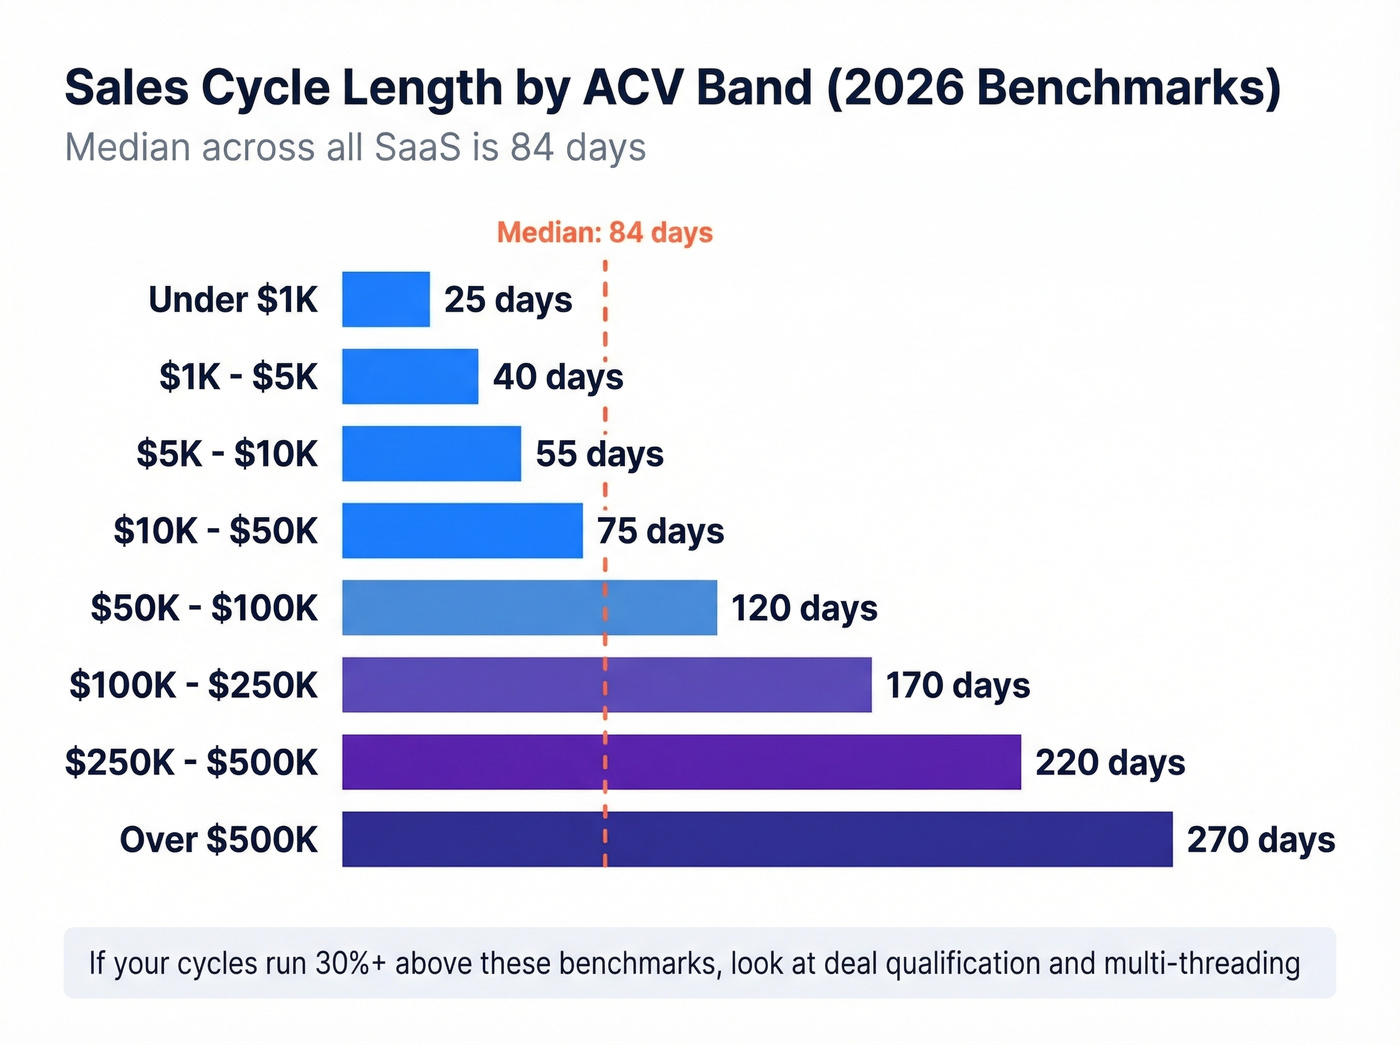
The median across all SaaS sits at 84 days. If your cycles run 30%+ above these benchmarks, look at deal qualification and multi-threading - in our experience, those are the two biggest cycle killers. A deal with one champion and no executive sponsor will stall every time.
Pipeline coverage ratios are meaningless when 30% of your contacts bounce. Snyk's 50 AEs cut bounce rates from 35-40% to under 5% with Prospeo - and grew AE-sourced pipeline 180%. At $0.01/email with 98% accuracy, cleaning up phantom pipeline is the fastest KPI win your team can get.
Stop inflating coverage with dead contacts. Start closing real deals.
Leading Indicators That Aren't Vanity
Worth tracking: email response rate (8-10% B2B benchmark), calls-to-meeting ratio (1:8 to 1:15), and email open rate (20-30%, useful for sequence tuning only).
Here's the thing: stop tracking raw call volume without connect rates, emails sent without reply rates, and "activities logged" as a standalone metric. We've seen AEs game activity-volume metrics every single time they're tracked in isolation. An AE making 30 calls with a 12% connect rate outperforms one making 80 calls at 3%. Track conversions, not volume.
KPI Mistakes to Avoid
"3x coverage" as gospel. The Gary Smith Partnership makes a strong case that blanket coverage ratios ignore deal quality, timing, and pipeline accuracy. Use weighted coverage instead.
Dashboards with 15+ widgets. We've watched teams build beautiful, sprawling dashboards that get abandoned within a month because nobody knows where to look first. Five to seven widgets. That's it.
Ignoring data quality as a root cause. Your pipeline coverage ratio is meaningless if 30% of the contacts in those deals have bounced emails or wrong phone numbers. Phantom pipeline - deals built on stale data - inflates coverage, deflates win rate, and extends cycle length. It makes every metric on your dashboard a liar. If you need a framework for diagnosing this, start with pipeline health and work backward to inputs.
Let's be honest: this one is frustrating because it doesn't look like a KPI problem on the surface. Snyk's 50 AEs were running bounce rates of 35-40%. After switching to Prospeo for contact verification, bounces dropped below 5%, and AE-sourced pipeline jumped 180%. That was a data input problem masquerading as a performance problem.

Every KPI on this list - win rate, cycle length, velocity - degrades when AEs waste hours chasing wrong numbers and bounced emails. Prospeo's 7-day data refresh and 125M+ verified mobiles (30% pickup rate) mean your reps connect with real buyers on the first attempt, not the fifth.
Give your AEs data that actually converts into pipeline.
Build Your AE Dashboard
Keep it to three categories, per Monday.com's taxonomy:
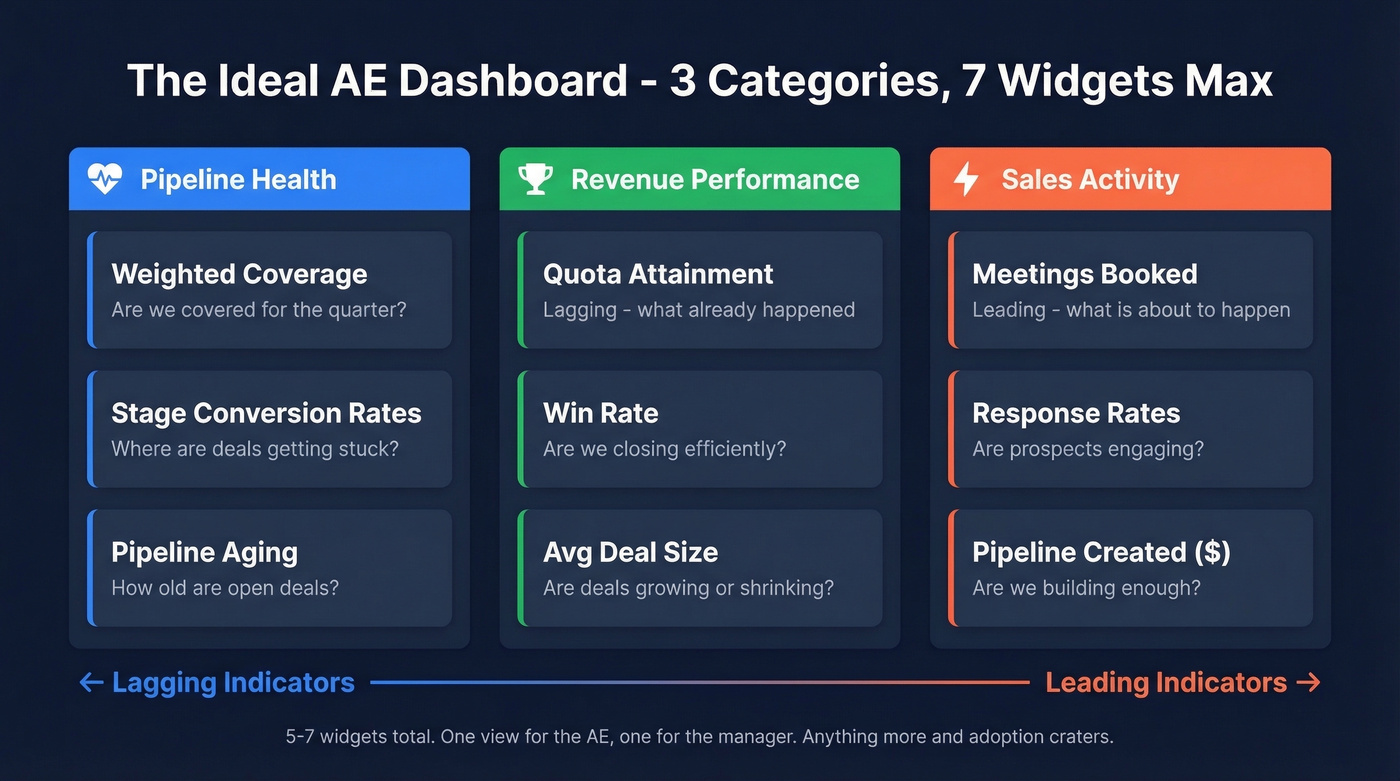
Pipeline health - weighted coverage, stage conversion rates, pipeline aging. Accuracy here depends entirely on contact data quality; a 7-day refresh cycle keeps pipeline reports honest instead of six weeks stale. If you're standardizing definitions, align this with your sales operations metrics.
Revenue performance - quota attainment, win rate, average deal size. These are your lagging indicators. They tell you what already happened.
Sales activity - meetings booked, response rates, pipeline created. These are your leading indicators. They tell you what's about to happen. For what to include (and what to cut), use these sales activities as a baseline.
Five to seven widgets total. One view for the AE, one for the manager. Anything more complex and adoption craters.
What to Do Next
Pick five account executive KPIs from this list. Review them weekly. Recalibrate targets quarterly based on actual conversion data, not gut feel. Skip the vanity metrics, skip the 20-widget dashboards, and skip the coverage ratios that don't account for deal quality. The right AE metrics won't just tell you what happened - they'll show you what to fix before the quarter slips. If you want a broader benchmark layer, pair this with funnel metrics and sales pipeline benchmarks.
FAQ
What are the most important KPIs for account executives?
Quota attainment, weighted pipeline coverage, win rate, pipeline created, and sales cycle length. These five cover the full picture from leading activity to lagging revenue, and they're the metrics top-performing AE teams review weekly.
What's a good pipeline coverage ratio?
Target 2-3x for SMB, 2.5-4x for mid-market, and 3-5x for enterprise (unweighted). Weighted coverage is more accurate because it factors in stage probability - a $100K deal at 30% counts as $30K, not $100K.
How do you measure forecast accuracy for an AE?
Compare the AE's committed forecast at a set date against actual closed-won revenue at quarter end. Anything within 85-115% is strong. Consistent over-forecasting signals pipeline quality issues or poor deal qualification.
How does bad contact data affect AE performance metrics?
Stale emails and wrong numbers inflate pipeline coverage with deals that can't progress, drag down win rates, and extend cycle length. Cleaning up contact data is one of the highest-ROI fixes a sales team can make - Snyk cut bounce rates from 35-40% to under 5% and grew AE-sourced pipeline 180% after addressing this.