Annual Contract Value in SaaS: The Metric That Determines Your Business Model
Your VP of Sales just closed a $150K deal and is celebrating in Slack. Your CFO looks at the same contract - three years, no ramp - and sees $50K ACV. Both are right. Both are looking at different numbers. And the gap between those two numbers determines everything from how you hire reps to whether your unit economics actually work.
ACV in SaaS isn't just a formula you plug into a spreadsheet. It dictates your go-to-market motion, your sales comp structure, and ultimately whether your business model scales.
What Is Annual Contract Value?
Annual contract value is the annualized recurring revenue from a single customer contract, excluding one-time fees. A customer signs a $120K three-year deal? The ACV is $40K, not $120K.
Why annualize? Because a three-year deal and a one-year deal generating the same annual revenue should look equivalent when you're planning headcount, setting quotas, or forecasting pipeline. Annualizing strips away contract-length distortion and gives you a clean unit to compare deals against each other.
There's no universal standard for ACV calculation. Some companies include certain first-year fees; most teams exclude one-time implementation and onboarding so ACV stays a clean recurring metric. What matters is that every team - sales, finance, RevOps - uses the same definition. Consistency beats precision here.
How to Calculate ACV
The core formula:
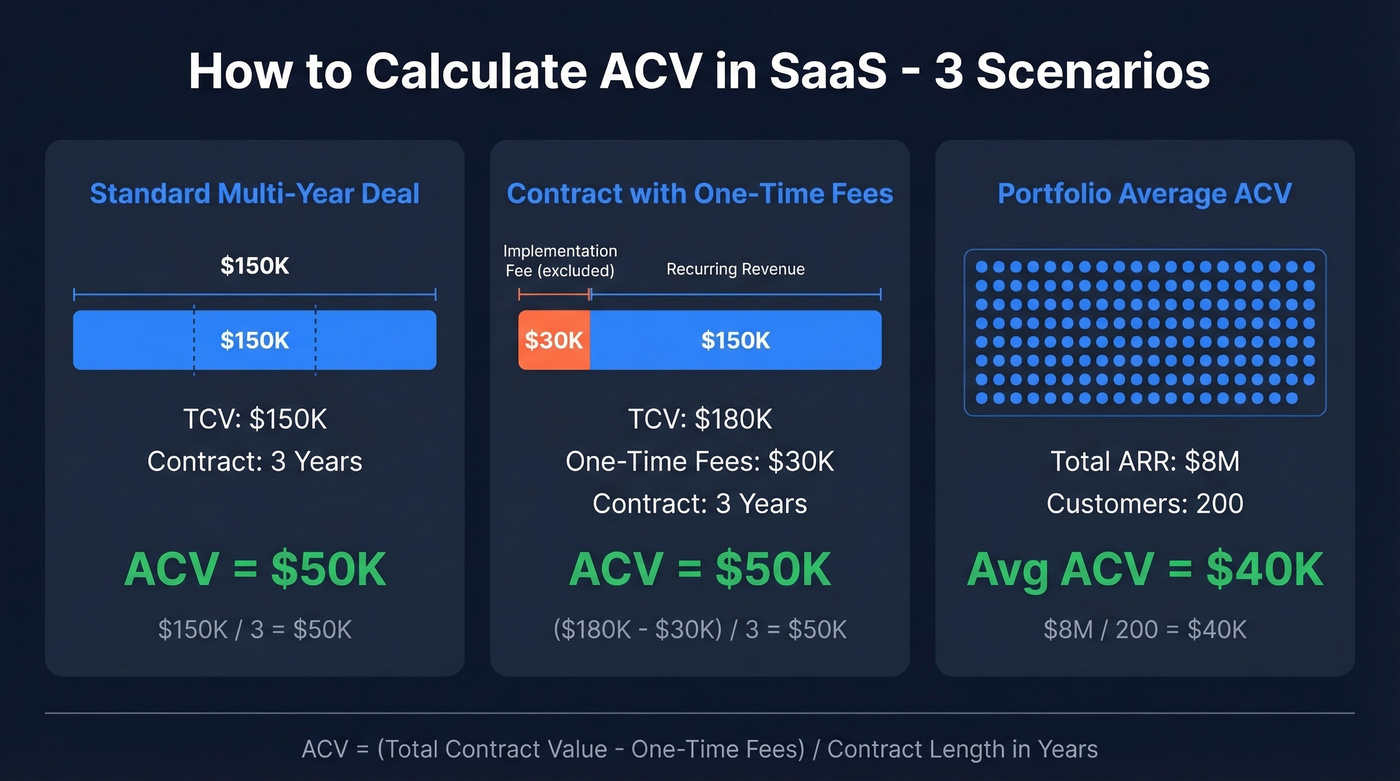
ACV = (Total Contract Value - One-Time Fees) / Contract Length in Years
Three scenarios make this concrete.
Scenario 1: Standard multi-year deal. A customer signs a 3-year contract worth $150K with no implementation fees. ACV = $150K / 3 = $50K.
Scenario 2: Contract with one-time fees. Same customer, but the deal includes a $30K implementation fee. TCV is $180K, but you strip out the one-time charge first. ACV = ($180K - $30K) / 3 = $50K. The implementation revenue matters for cash flow, but it shouldn't inflate your per-deal recurring metric.
Scenario 3: Portfolio average ACV. You've got 200 customers generating $8M in total annual recurring revenue. Your average ACV = $8M / 200 = $40K. This is the number investors care about - it tells them what kind of GTM motion you're running and whether your sales economics make sense at scale.
ACV vs. ARR vs. TCV vs. MRR
These four metrics get confused constantly.
| Metric | Definition | Scope | Includes One-Time Fees? | Primary Use |
|---|---|---|---|---|
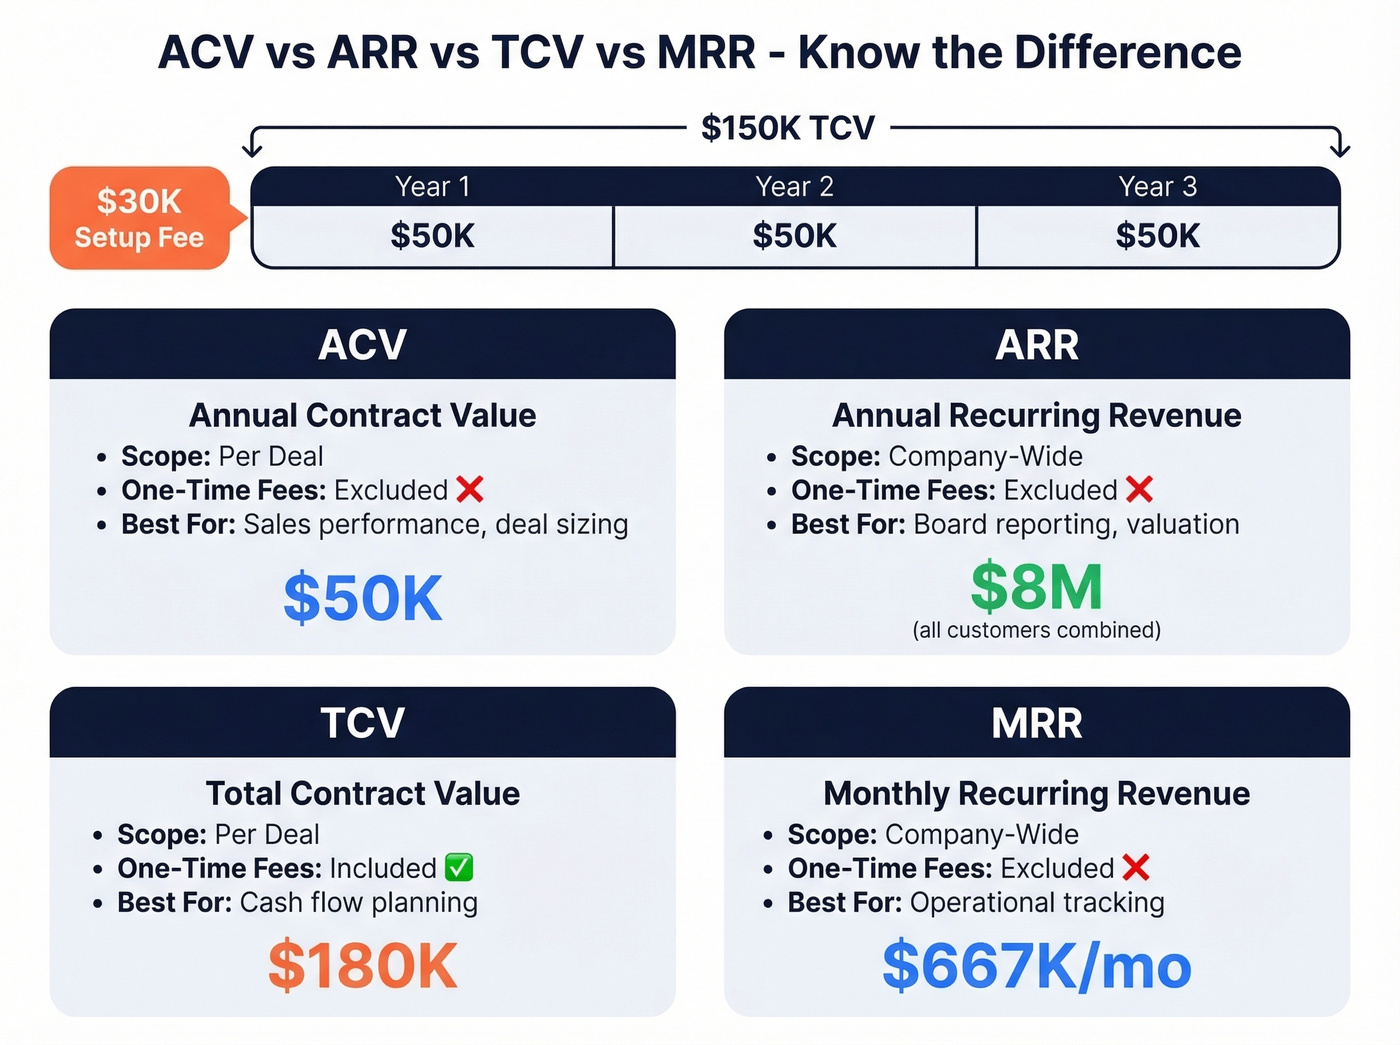
| ACV | Annualized value, single contract | Per-deal | No | Sales performance |
| ARR | Annual recurring revenue, all contracts | Company-wide | No | Board reporting |
| TCV | Total committed value over full term | Per-deal | Yes | Cash flow planning |
| MRR | Monthly recurring revenue | Company-wide | No | Operational tracking |
Two advanced companions worth knowing: Entry ARR and Exit ARR. Entry ARR is what a customer books at initial signing. Exit ARR is their run-rate after expansions, downgrades, or churn during the period. The delta between them is your net expansion story.
ARR is for your board deck. ACV is for your operating decisions. Track both, but don't confuse them in the same sentence. We've seen finance teams report ACV to the board when they meant ARR, and the resulting confusion wastes an entire quarterly review.
One more subtle trap: TCV attribution timing. Threads on r/FPandA regularly surface cases where teams attribute TCV to the opportunity creation date rather than the close date, which distorts pipeline reporting for an entire quarter.
2026 ACV Benchmarks
The median ACV for private B2B SaaS hit $26,265 in 2024 per SaaS Capital data, up from $22,357 the prior year. That's a healthy jump, driven largely by companies pushing upmarket and leaning harder into expansion revenue.
ChurnZero's survey of 1,200+ customer success leaders found the average SaaS ACV falls between $25,000 and $99,999, which aligns with what we see across the market. Maxio's report covers 500+ B2B SaaS companies, and High Alpha's survey drew 800+ respondents - all pointing to the same upmarket trend.
Benchmarkit's latest report adds sharper detail. The median new CAC ratio climbed 14% year-over-year to $2.00 in S&M spend per $1.00 of new customer ARR. NRR sits at 101%. Expansion ARR now represents 40% of total new ARR, up five percentage points, and for companies above $50M, expansion accounts for more than half of all new ARR.
The Mid-ACV Trap
Here's the thing: this is one of the most underappreciated dynamics in SaaS, and in our experience it kills more companies than bad product-market fit.
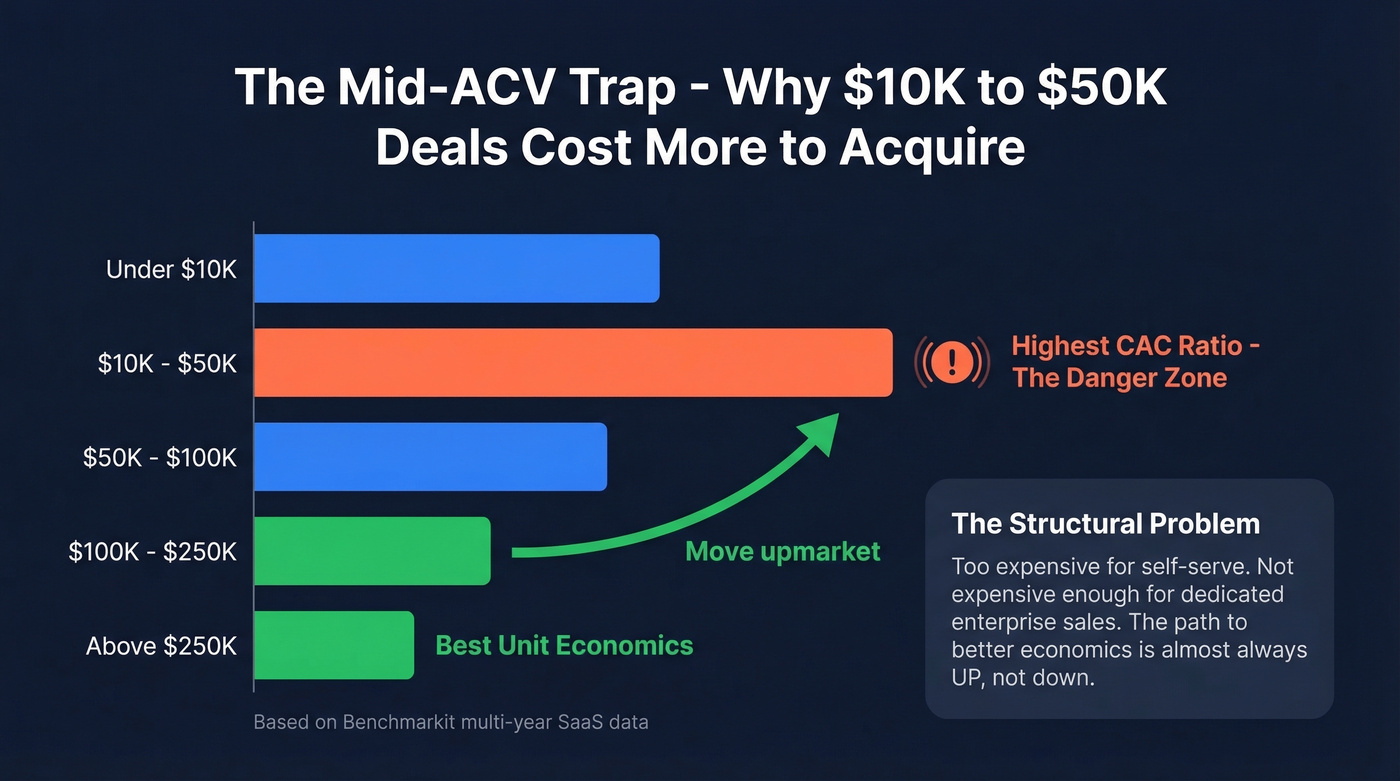
Benchmarkit's multi-year data consistently shows that $10K-$50K ACV solutions are more expensive to acquire than $50K-$100K deals. This isn't a one-year anomaly - it's structural. You're too expensive for self-serve but not expensive enough to justify a dedicated enterprise sales motion. Deals above $100K and $250K actually show lower CAC ratios and materially shorter payback periods than mid-range bands.
If you're sitting in that $10K-$50K band, your path to better unit economics is almost always up, not down.
Stuck in the mid-ACV trap? The fastest way out is reaching bigger buyers - VP and C-level decision-makers who sign $50K+ deals. Prospeo's 300M+ profiles with 30+ filters (buyer intent, funding, headcount growth) let you target accounts ready to buy at enterprise price points.
Stop selling small. Find the buyers who match your real ACV potential.
How ACV Shapes Your GTM Motion
Your annual contract value isn't just a reporting metric. It's a strategic constraint.
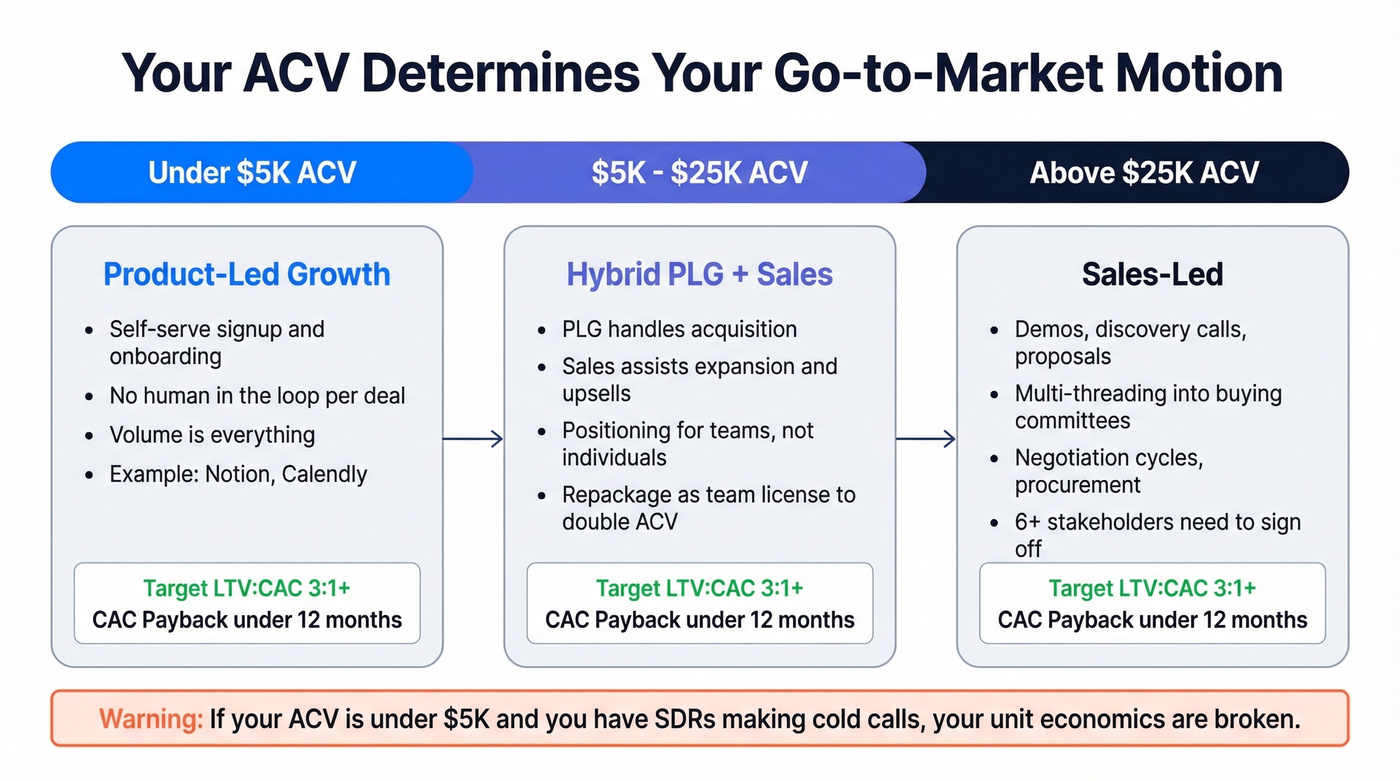
Under $5K ACV: Product-led growth, self-serve. You can't afford a human in the loop for every deal. $5K-$25K ACV: Hybrid territory. PLG handles acquisition; sales assists expansion and upsells. Above $25K ACV: Sales-led. Demos, multi-threading, negotiation cycles. And when complex buying committees are involved - six people needing to sign off - you need a rep regardless of deal size.
The target unit economics that make these motions work: LTV:CAC of at least 3:1 and CAC payback under 12 months. If your average deal sits below $5K and you've got a team of SDRs making cold calls, your unit economics are broken. You'll spend more acquiring each customer than they'll ever pay you.
Let's be honest about something most SaaS companies with sub-$10K deals won't admit: they don't have a pricing problem. They have a positioning problem. They're selling to individual contributors when they should be packaging for teams and departments. Repackaging the same product as a team license can double ACV overnight without writing a single line of new code.
How to Increase Average ACV
Moving ACV up isn't about raising prices and hoping customers don't leave. It's about capturing more value from the right buyers.
Value-based pricing is the foundation. Price on outcomes, not features. If your product saves a customer $500K annually, a $50K ACV is a bargain - price accordingly.
Upsell and cross-sell aggressively. Expansion ARR is now the dominant growth lever for mature SaaS companies. At 40% of total new ARR across the market - and over 50% for companies above $50M - expansion isn't a nice-to-have. It's the primary engine.
Incentivize longer contracts. A 10% discount for a 3-year commitment is worth it if it locks in revenue and reduces churn risk. The TCV looks great, and the ACV stays clean.
Move upmarket. This is where most companies find their biggest gains, but it requires reaching VP and C-level decision-makers at larger accounts, not just the individual contributors who signed up for your free tier. That means multi-threaded outreach with accurate contact data. We've found that the difference between reaching a VP of Engineering with a verified direct dial and bouncing off a generic info@ address is often the difference between a $5K deal and a $50K deal - tools like Prospeo with 98% email accuracy and a 7-day data refresh cycle exist specifically for this kind of upmarket push.
ACV for Usage-Based Pricing
Usage-based models make ACV calculation trickier, but not impossible.
For committed usage agreements - common in enterprise - ACV is straightforward: it's the annual committed minimum. For pay-as-you-go, prepaid credits, tiered usage plans, and base-plus-overage models, you'll want to annualize trailing-12-month usage revenue per customer, or use contracted minimums plus expected overages based on historical consumption patterns.
The risk with usage-based ACV is revenue unpredictability. A customer's usage can swing 30-40% quarter to quarter. That's why many hybrid models pair a base subscription with usage-based overages. It gives finance a floor to forecast against while preserving upside from heavy users.
Common ACV Mistakes
Inconsistent definitions across teams. Sales includes the $30K implementation fee because it inflates their deal size. Finance excludes it for cleaner forecasting. The board sees a number that's 15% higher than reality. This happens more often than anyone admits, and it usually surfaces at the worst possible moment: a board meeting where the numbers don't reconcile.
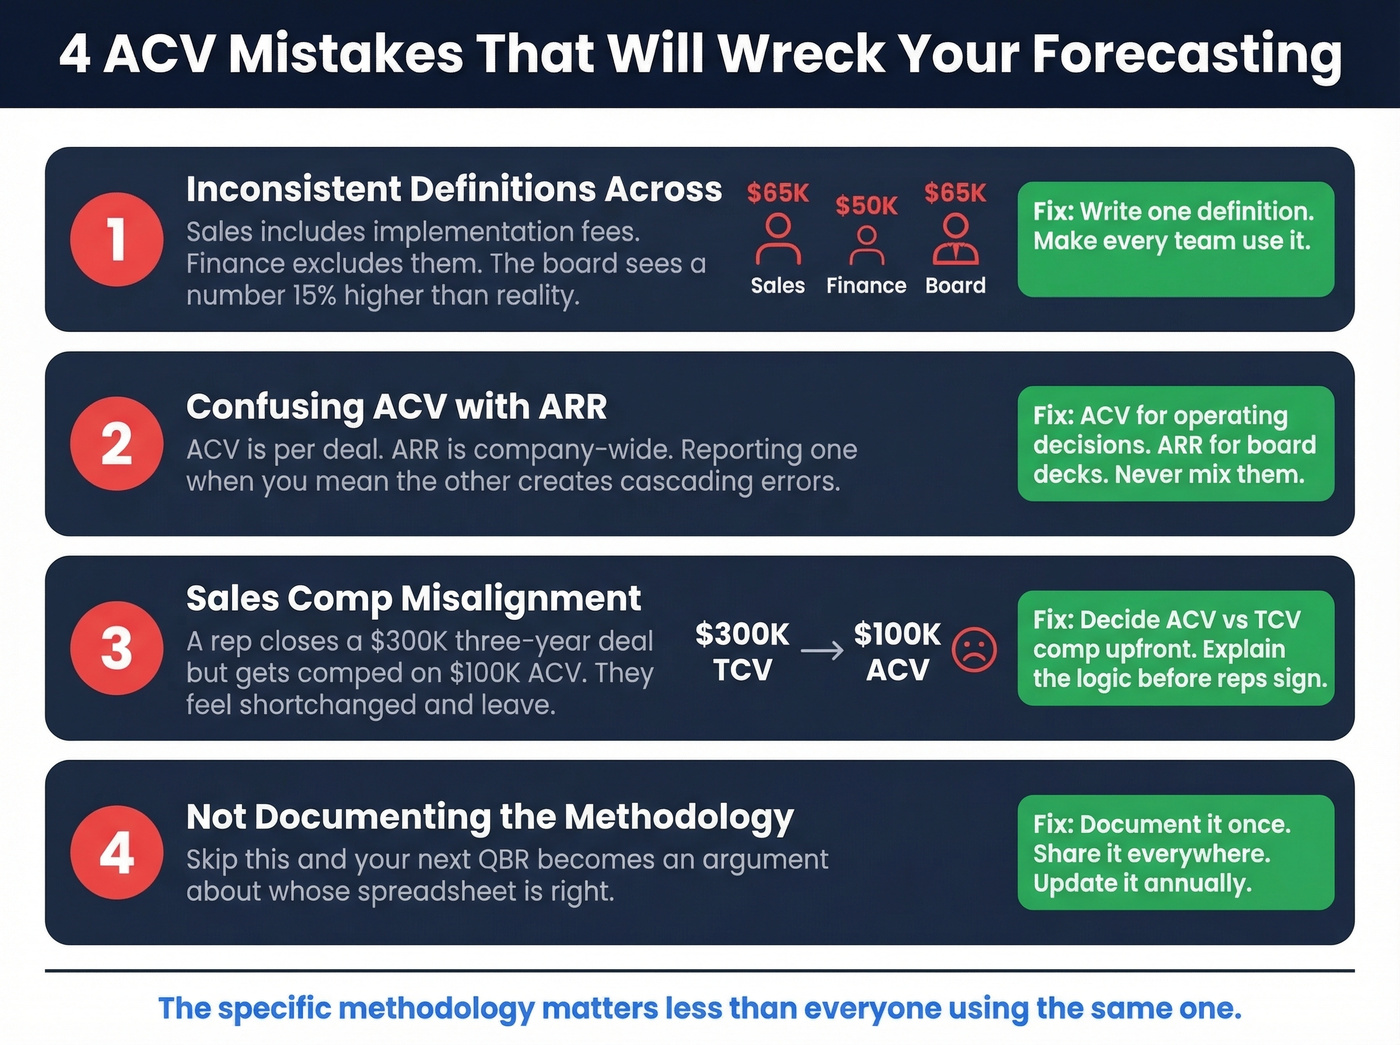
Confusing ACV with ARR. ACV is per-deal. ARR is company-wide. Reporting one when you mean the other creates cascading errors in forecasting, quota-setting, and investor communications.
Sales comp misalignment. There's a real debate about whether enterprise reps should be comped on ACV or TCV. A rep who closes a $300K three-year deal but gets comped on $100K ACV feels shortchanged. This exact frustration shows up constantly in sales forums on Reddit, because it feels like you're penalizing reps for selling longer commitments. In our experience, the comp misalignment issue causes more rep attrition than most companies realize. There's no universal right answer, but whatever you choose, make sure reps understand the logic before they sign their comp plan.
Not documenting the methodology. Pick a definition, write it down, make every team use it. The specific methodology matters less than everyone using the same one. Skip this step and you'll spend your next QBR arguing about whose spreadsheet is right instead of discussing strategy.
Expansion ARR drives 40%+ of new revenue for mature SaaS - but only if your reps can reach the right stakeholders. Prospeo delivers 98% accurate emails and 125M+ verified mobiles so your team multi-threads into existing accounts without bouncing.
Your expansion pipeline is only as good as the contact data behind it.
ACV in SaaS: Questions Answered
What's a good ACV for SaaS?
The median across private B2B SaaS is $26,265. Under $5K works for product-led growth; above $25K justifies a sales-led motion. The right number is whichever ACV supports healthy unit economics - LTV:CAC above 3:1 and CAC payback under 12 months - at your chosen GTM model.
Should ACV include one-time fees?
Most finance teams exclude them so ACV reflects pure recurring revenue. Either approach works - just document your choice and enforce it across sales, finance, and RevOps so board reporting stays consistent.
ACV vs. ARR: which matters more?
Both serve different purposes. ACV measures per-deal performance for evaluating sales productivity and setting quotas. ARR measures your company-level recurring run-rate for board decks and investor updates. Track both; confuse them at your peril.
How does ACV affect fundraising?
Investors use ACV to assess GTM efficiency and scalability. Higher ACV with strong NRR signals enterprise traction and predictable expansion revenue. SaaS Capital's long-standing research shows the relationship between ACV and company size is direct and dramatic - a rising ACV tells investors you're moving upmarket successfully.