Average Email CTR by Industry: 2026 Benchmarks From 8 Sources
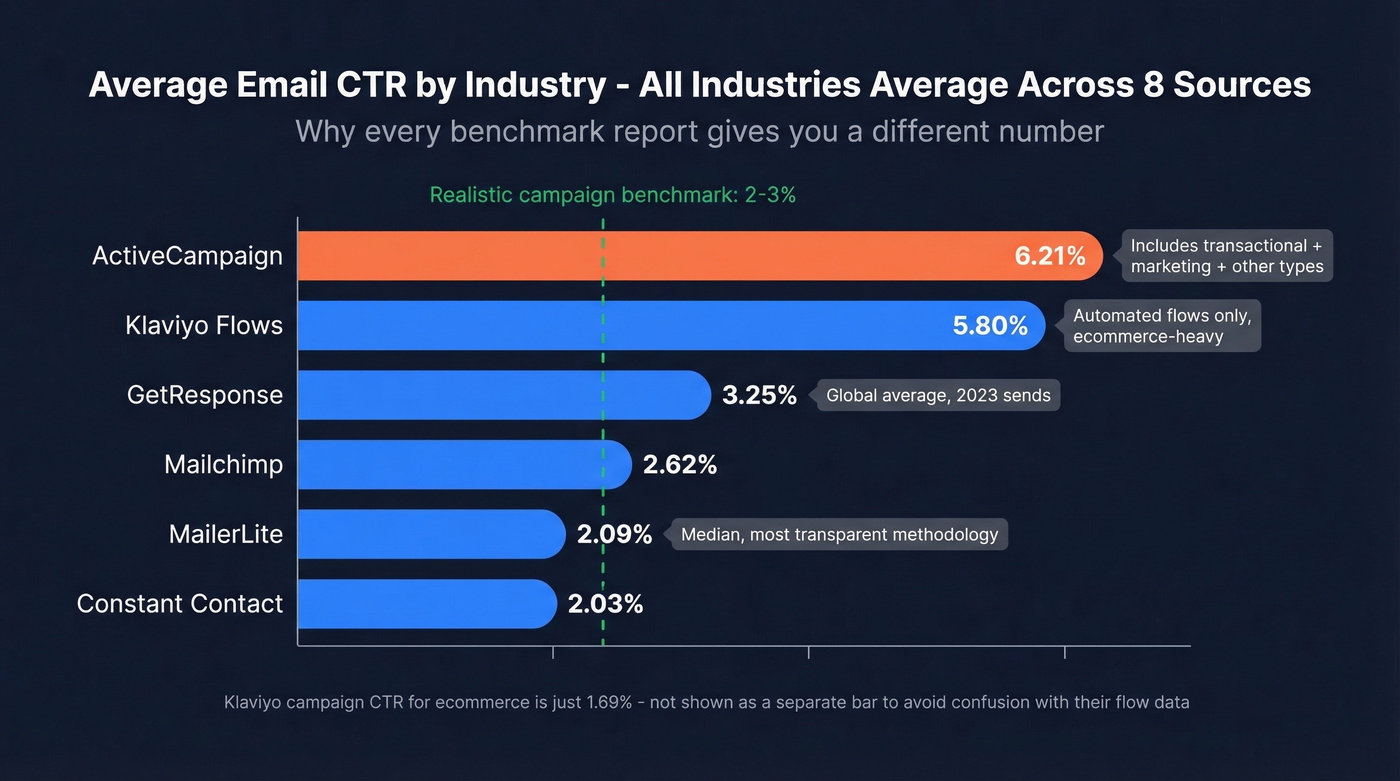
Every benchmark report gives you a different number. ActiveCampaign says 6.21%. Klaviyo says 1.69%. Constant Contact lands at 2.03%. So what's the actual average email CTR by industry? It depends entirely on who you ask - and they're all technically right, which is exactly the problem.
We pulled data from 8 sources to show you what the numbers actually mean, why they disagree, and which ones matter for your business.
The Quick Version
Campaign CTR across all industries sits around 2-3% based on Mailchimp, Constant Contact, MailerLite, and GetResponse data. Automated flow CTR jumps to 5-6% per Klaviyo's ecommerce-heavy dataset. Vendors that blend transactional and other non-newsletter email types into their averages - like ActiveCampaign at 6.21% and Dotdigital at 3.7% - report higher numbers that look great in headlines but don't reflect what your next newsletter will do.
The right benchmark depends on your email type, your audience, and which ESP's data you trust.
CTR vs. CTOR vs. Click Rate
These terms get used interchangeably, and they shouldn't.
- CTR (click-through rate): unique clicks / delivered emails x 100
- CTOR (click-to-open rate): unique clicks / unique opens x 100
The confusion gets worse because HubSpot's own reporting labels CTOR as "click-through rate." Quick example: you deliver 500 emails, 300 open, 200 click. Your CTR is 40%. Your CTOR is 66%. Same campaign, wildly different numbers. When comparing benchmarks across sources, always check which formula they're using - especially when a report cites an average click-to-open rate by industry, since that metric will always look higher than CTR for the same dataset.
Email Click-Through Rates by Industry (2026 Data)
This table synthesizes the most recent data from ActiveCampaign's 2026 benchmarks alongside ranges from Mailchimp, Constant Contact, MailerLite, and GetResponse. The gap between sources tells you as much as the numbers themselves.
| Industry | ActiveCampaign | Mailchimp / CC Range | Notes |
|---|---|---|---|
| Blogger / Author | 7.73% | 2.6-3.3% | AC includes transactional + other email types |
| Media / Publishing | 7.32% | 2.6-3.3% | AC includes transactional + other email types |
| Consulting / Agency | 7.05% | 2.6-3.3% | AC includes transactional + other email types |
| Software / Tech | 6.67% | 2.6-3.3% | B2B lists, smaller and curated |
| Online Education | 6.38% | 2.6-3.3% | Automated sequences boost this significantly |
| E-Commerce / Retail | 5.07% | 1.7-2.0% | Mailchimp ecommerce: 1.74%; Klaviyo campaigns: 1.69% |
| Accounting / Finance | 4.40% | 2.8-3.0% | Mailchimp business/finance: 2.78% |
| Nonprofits | - | ~2.0-3.3% | Mailchimp non-profits: 3.27% |
| All Industries | 6.21% | 2.0-3.3% | See below |
All-industries range: Constant Contact 2.03%, MailerLite 2.09%, Mailchimp 2.62%, GetResponse 3.25%. ActiveCampaign's dataset covers Jan 1-Dec 10, 2025; GetResponse benchmarks are based on 2023 sends; Klaviyo campaign/flow benchmarks are from its 2026 report.
ActiveCampaign's overall 6.21% average includes transactional, marketing, and other campaign types alongside standard marketing campaigns. Mailchimp's benchmarks and Constant Contact's 2.03% reflect broader campaign/newsletter performance for a wide SMB-heavy audience. GetResponse's 3.25% global average falls in the middle, and their regional splits reveal another layer of variation: North America at 4.77%, Europe at 3.58%, Asia at 4.06%.
None of these sources are wrong. They're measuring different things.

Why Every Benchmark Report Disagrees
Your CMO just asked why your CTR is "only" 2% when they read that the industry average is 6%. Here's what's actually happening.
ActiveCampaign's 6.21% includes transactional emails like order confirmations and password resets - messages that get clicked at much higher rates because the recipient is already expecting them. That inflates the average. Klaviyo's 1.69% is campaign data from ecommerce senders, meaning promotional blasts to large consumer lists that naturally underperform. Constant Contact's 2.03% reflects their SMB customer base, where list hygiene tends to be rougher; their bounce rate is 10.31%, about 4.4x GetResponse's 2.33%. MailerLite's 2.09% median is arguably the most transparent methodology, but it's still just their customer base.
In our analysis of these 8 benchmark reports, one pattern is clear: every benchmark is a snapshot of one vendor's customers. Dataset composition bias explains almost all the variation.
Benchmarks don't matter when your emails never land. Bad data inflates bounce rates and tanks CTR before your copy gets a chance. Prospeo's 5-step verification delivers 98% email accuracy - teams using it cut bounce rates from 35%+ to under 4%.
Stop benchmarking against ghost addresses. Start reaching real inboxes.
CTR by Email Type
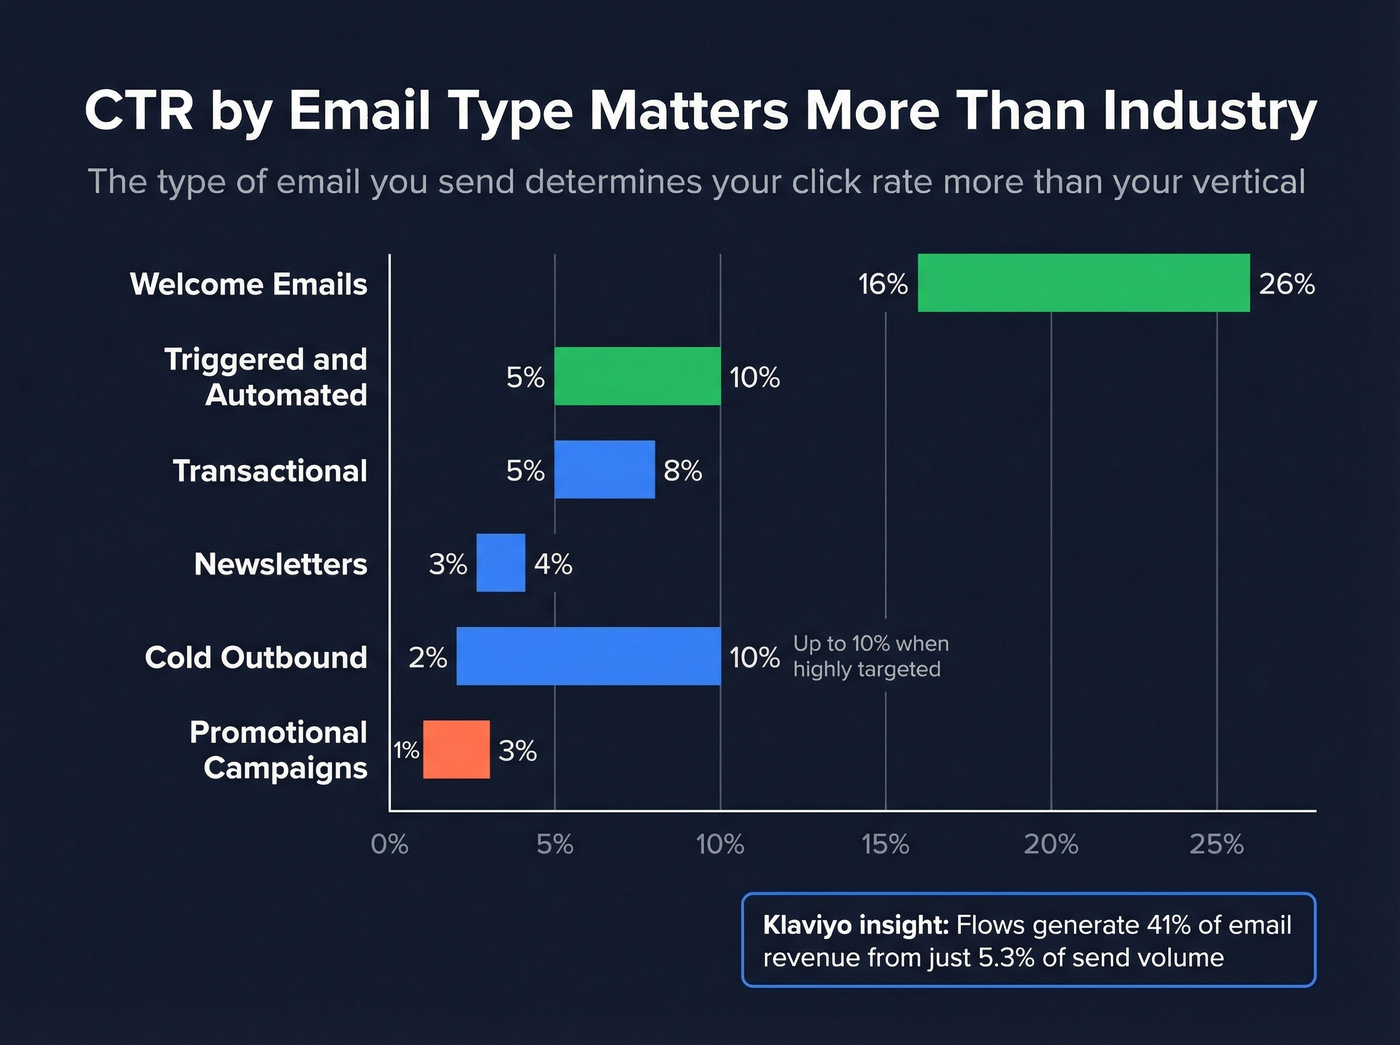
Here's the thing: the type of email matters more than the industry you're in.
| Email Type | Typical CTR Range |
|---|---|
| Welcome emails | 16-26% |
| Triggered / automated | 5-10%+ |
| Transactional | 5%+ |
| Newsletters | 3-4% |
| Promotional campaigns | 1-3% |
| Cold outbound | 2-2.5%, up to 10% when highly targeted |
Klaviyo's data makes this stark: flows generate 41% of total email revenue from just 5.3% of send volume. Campaigns account for 94.7% of sends but produce lower engagement across the board. AI-powered product recommendations within those flows lift click rates to 3.75% on average and 8.79% for top performers. If you're not using behavioral triggers and dynamic content in your automated sequences, you're leaving the highest-CTR emails on the table.
B2B vs. B2C Benchmarks
| Metric | B2B | B2C |
|---|---|---|
| CTR | 3.2% | ~2.6% |
| Open Rate | 20.8% | ~35.6% |
| List Size | Smaller, targeted | Larger, promotional |
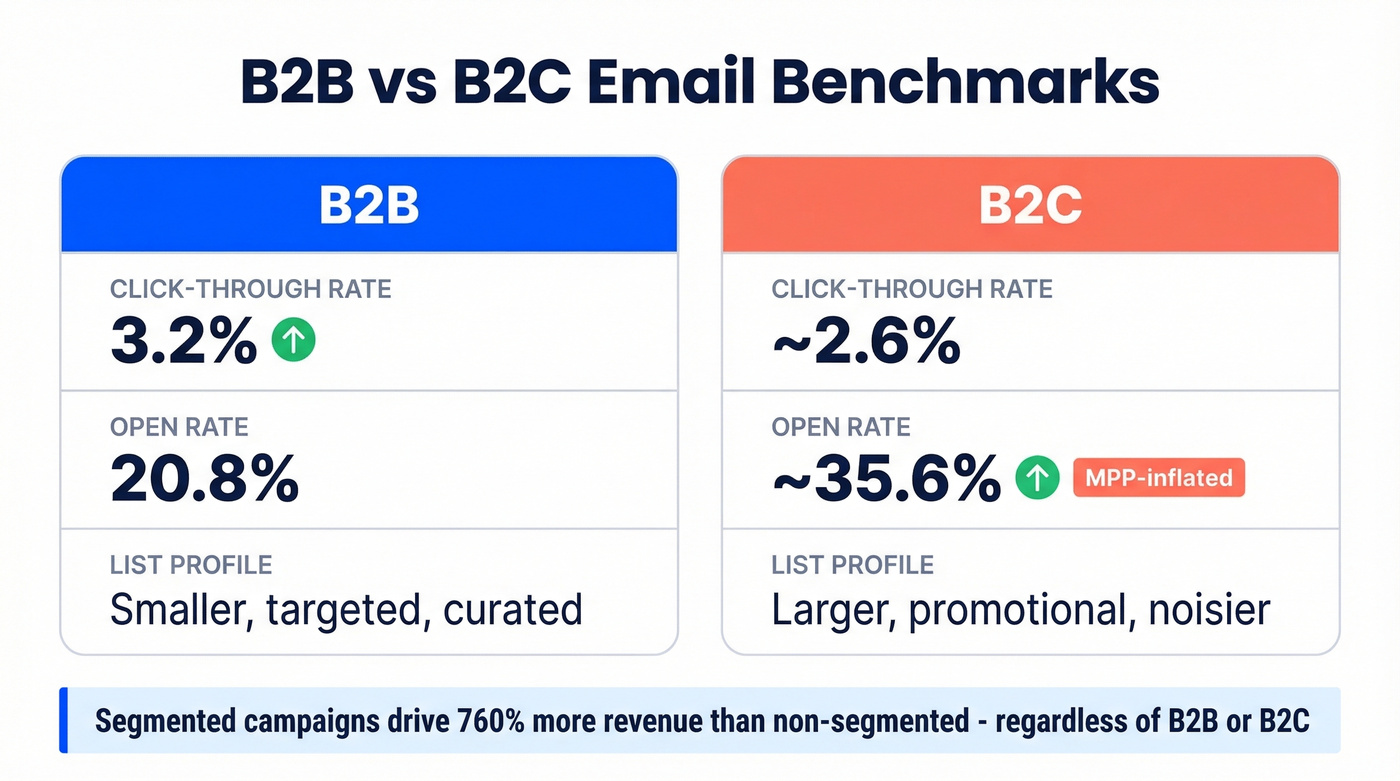
B2B lists are smaller and more curated, which drives higher click rates despite lower open rates. B2C lists are bigger and noisier. More opens - partly MPP-inflated - but fewer clicks per recipient. Segmented campaigns drive 760% more revenue than non-segmented, regardless of which side you're on.
When evaluating the average click-to-open rate in your vertical, keep in mind that B2B CTOR tends to run higher because recipients who do open are more intent-driven.
How MPP and Bot Clicks Distort CTR
Apple Mail Privacy Protection accounts for roughly 49% of email opens as of early 2025, inflating open rates by 15-20+ points. CTR is less affected - but it isn't clean either.
"Dark clicks" from Gmail, Outlook Safe Links, and Yahoo security scanning inflate click metrics by pre-fetching links before a human ever sees the email. One monitoring study found bot clicks peaked at 3M+ per day in early 2025. By late 2025, major ESPs began filtering known bot clicks, which means your CTR likely dropped recently - not because engagement fell, but because the measurement got more honest. The consensus on r/Emailmarketing confirms this: practitioners saw sudden drops after Gmail and Yahoo's 2024 security updates, even with consistent content.
Click-based metrics are now the gold standard. Opens are a deliverability pulse check at best.
Let's be honest about something: if your deal sizes are modest and your list is under 5,000 contacts, stop comparing yourself to industry benchmarks entirely. The sample sizes in these reports skew toward enterprise senders with dedicated email teams. Your 2.5% CTR on a well-segmented list of 800 buyers is outperforming most of the "4% average" crowd in revenue per send.
How to Improve Your Email CTR
Switch to automated flows. Klaviyo's data shows flows deliver about 3.3x higher click rates than campaigns. Welcome sequences, abandoned cart, post-purchase - these outperform every newsletter you'll ever write. If you're still sending batch-and-blast campaigns for everything, start here.
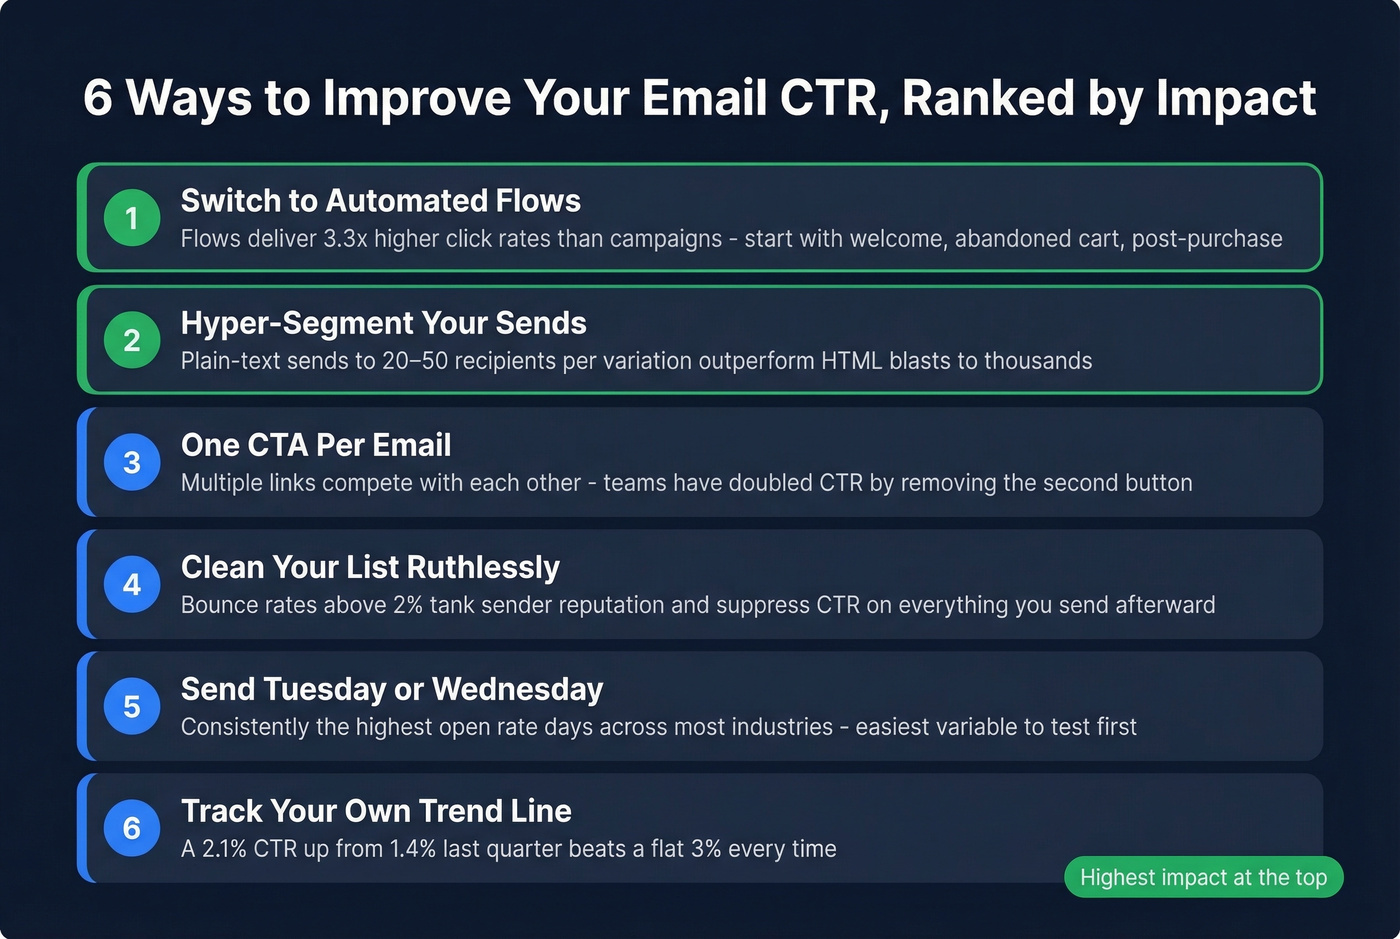
Hyper-segment your sends. The r/b2bmarketing consensus is clear: plain-text, highly segmented sends to 20-50 recipients per variation outperform designed HTML blasts to thousands. Relevance beats design every time, especially in B2B.
One CTA per email. Multiple links compete with each other. Pick the single action you want and build the email around it. We've seen teams double their CTR just by removing the second button.
Clean your list ruthlessly. Bounce rates above 2% tank sender reputation, which pushes future emails to spam, which suppresses CTR on everything you send afterward. It's a compounding problem. Bad data is the silent CTR killer most teams ignore - one of our customers, Snyk, saw bounce rates drop from 35-40% to under 5% after switching to verified contact data, and their AE-sourced pipeline jumped 180%. Use a verification tool like Prospeo's email finder to clean your list before major sends. A 7-day data refresh cycle means contacts don't go stale between campaigns.
Send on Tuesday or Wednesday. Day-of-week data consistently shows these two days produce the highest open rates across most industries. It's not a magic bullet, but it's the easiest variable to test first. If you're doing outbound, the best time to send cold emails is worth testing too.
Track your own trend line, not industry averages. A 2.1% CTR that's up from 1.4% last quarter tells a better story than a 3% CTR that's been flat for a year. Your quarter-over-quarter trajectory matters more than where you sit relative to some vendor's benchmark table.
If you want to sanity-check your math, use the same definition across tools (see our click rate formula breakdown).
If deliverability is the bottleneck, start with an email deliverability guide and then tighten your sender reputation over time.
Cold outbound CTR hits 10% when it's highly targeted - but only if you're reaching real buyers. Prospeo gives you 30+ filters including buyer intent, job changes, and technographics across 300M+ profiles, refreshed every 7 days.
Target the right people and your CTR benchmarks become irrelevant.
FAQ
What's a Good Email CTR?
For marketing campaigns, 2-3% is the cross-industry average. Above 3% is strong performance. Automated flows should target 5%+. Your own quarter-over-quarter trend matters more than any single benchmark number.
Why Did My CTR Drop Recently?
Major ESPs began filtering bot clicks in late 2025, removing inflated numbers from Gmail, Outlook Safe Links, and Yahoo security scans. Your real engagement likely didn't change - the measurement got more accurate.
Is CTR or CTOR More Useful?
CTR measures overall list engagement; CTOR measures content quality among openers. Track both, but CTR is more reliable post-Apple MPP since open rates are inflated. Make sure you're not accidentally comparing CTOR from one report against CTR from another - the average click-to-open rate by industry always looks higher.
What's the Average Email CTR for Ecommerce?
Klaviyo reports 1.69% for promotional campaigns. Automated flows like abandoned cart and browse abandonment hit 5-10%+. The gap between campaigns and flows is largest in ecommerce, making automation the single highest-impact investment you can make.
How Do I Keep Bounce Rates Under 2%?
Use a dedicated verification tool to remove invalid addresses, spam traps, and honeypots before every campaign. Run verification on a regular cycle - stale data degrades fast, especially in B2B where job turnover averages 11% annually.