B2B SaaS Funnel Conversion Benchmarks: The Numbers That Actually Apply to You
Your board deck says 1.8% visitor-to-customer. The VP of Marketing calls it "solid." The VP of Sales says it's "below benchmark." They're both right - and both wrong - because neither specified which benchmark they're comparing against.
The consensus on r/sales and r/SaaS threads is telling: people ask "what's a good SaaS conversion rate?" and get answers ranging from 0.04% to 0.25%, because nobody specifies their funnel model. The B2B SaaS average website conversion rate is 1.1% according to First Page Sage's multi-year dataset. That number tells you nothing useful without knowing your ACV tier, GTM motion, and primary channel. Here are the actual benchmarks that matter, segmented the way your revenue team needs them.
The Short Version
- Your benchmark set depends on ACV tier, GTM motion, and primary channel. A freemium DevTool and a demo-led enterprise platform don't share a single meaningful conversion number.
- MQL-to-SQL has the widest variance and the biggest revenue impact. It ranges from 25% to 55%. This is where most funnels quietly bleed out.
- Audit your denominators before benchmarking anything. Unique visitors vs. sessions and 30-day vs. 90-day cohort windows can swing the same funnel's numbers by multiples.
Conversion Benchmarks by Funnel Stage
The table below draws from Pixelswithin's analysis of 500+ SaaS businesses across multiple verticals. It's directional, not gospel - but it's the most segmented public dataset available right now.
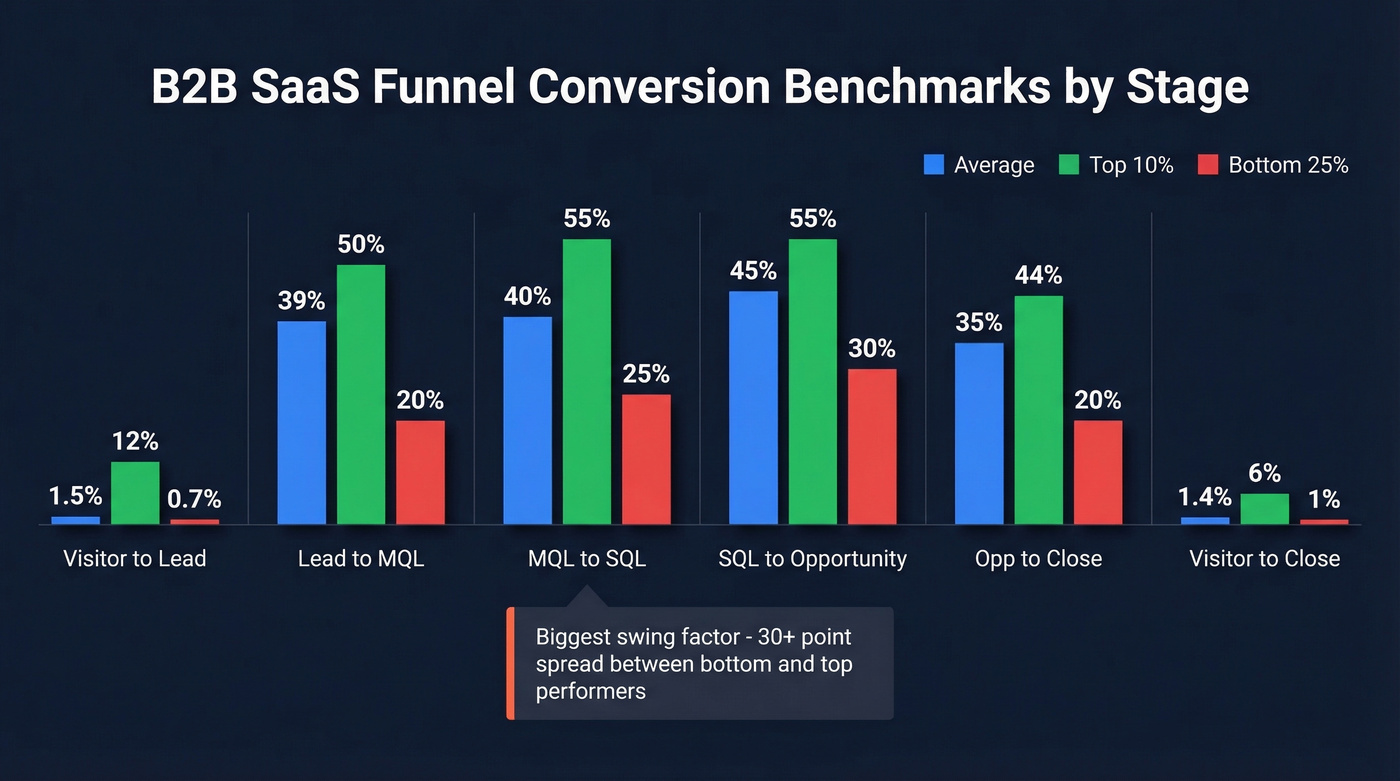
| Stage | Average | Top 10% | Bottom 25% |
|---|---|---|---|
| Visitor → Lead | 1.0-2.0% | 8-15% | <0.7% |
| Lead → MQL | 37-41% | 50%+ | <20% |
| MQL → SQL | 39-42% | 55% | <25% |
| SQL → Opportunity | 42-48% | 55% | <30% |
| Opp → Close | 31-39% | 44% | <20% |
| Visitor → Close | 1.0-1.8% | 6.0%+ | <1.0% |
The end-to-end gap is a 3-6x multiplier between average and top-10% performers. The single biggest swing factor? MQL-to-SQL - a 30+ point spread between bottom-25% and top-10%. That stage is where lead quality, SDR capacity, and data accuracy collide.
For enterprise teams at $1B+ ARR, the picture shifts: visitor-to-lead drops to roughly 0.7% and MQL-to-SQL compresses to about 31%, per Digital Bloom's pipeline data. Smaller teams with tighter ICPs consistently outperform on mid-funnel rates. And here's what matters: moving MQL-to-SQL from 30% to 45% is worth far more than doubling visitor-to-lead, because the lift compounds through every downstream stage.
Sales Funnel Rates by GTM Motion
Your conversion model isn't "B2B SaaS." It's freemium, or free trial, or demo-led. These are different businesses with different funnels.
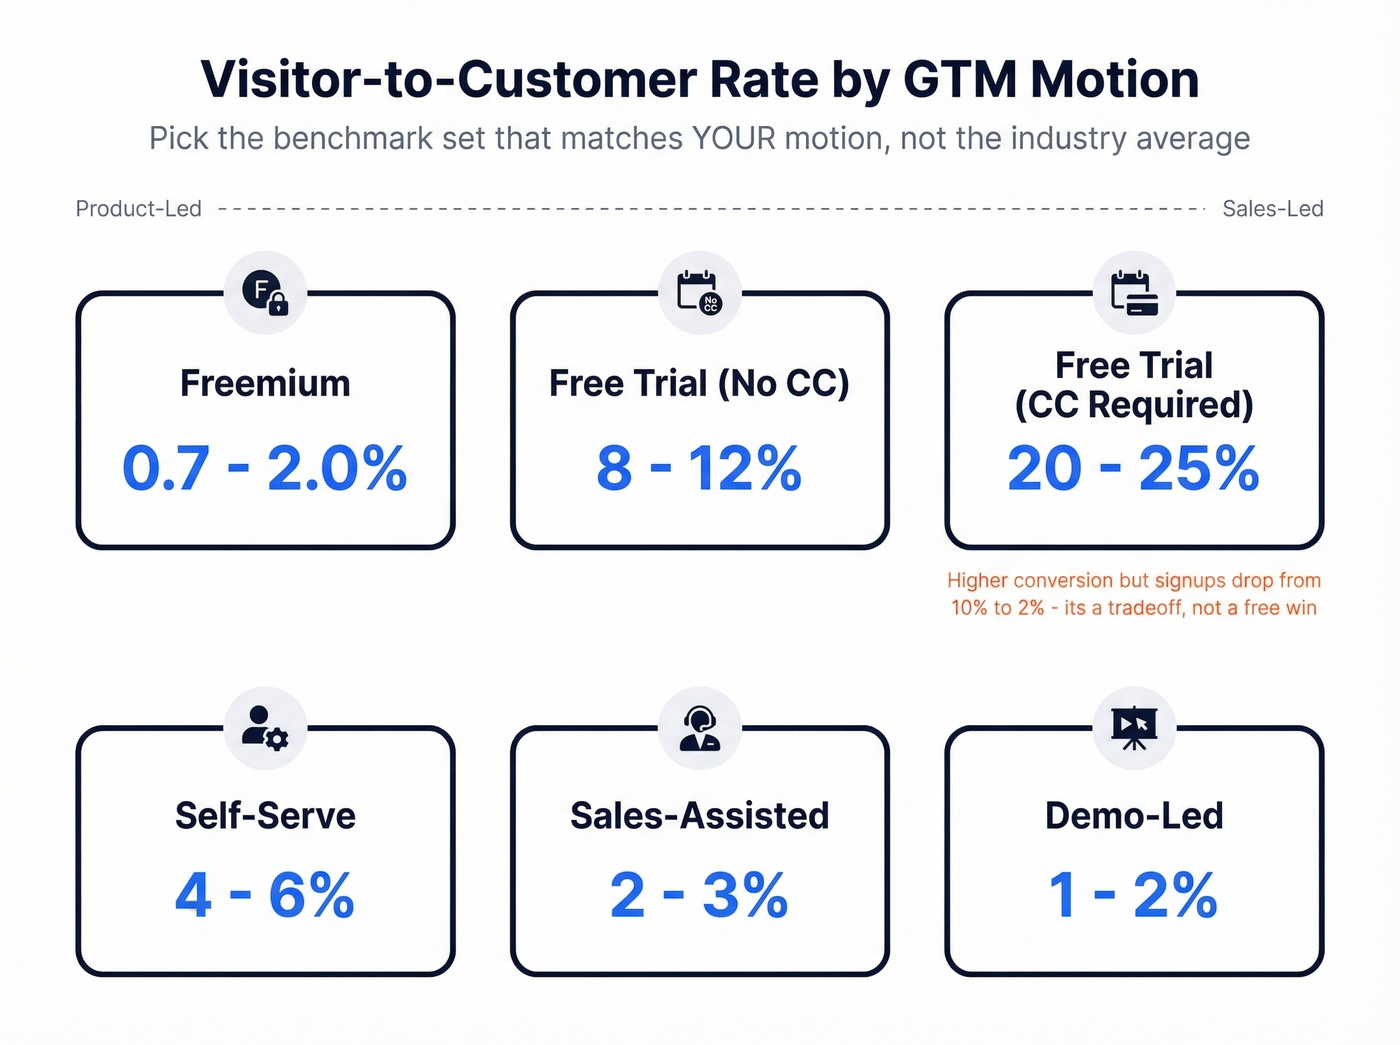
| GTM Motion | Visitor → Customer | Activation Rate |
|---|---|---|
| Freemium | 0.7-2.0% | 25-40% |
| Free trial (no CC) | 8-12% | 25-40% |
| Free trial (CC required) | 20-25% | - |
| Self-serve | 4-6% | - |
| Sales-assisted | 2-3% | - |
| Demo-led | 1-2% | - |
CC-required trials can drive up to 50% trial-to-paid conversion for users who actually enter their card and start, but they often cut signups from about 10% down to 2%. That's a tradeoff, not a free win. A healthy trial-to-paid range sits at 15-25% for no-CC B2B SaaS trials.
Here's the thing: PLG isn't as universal as the discourse suggests. Extruct AI's dataset of 474 Series A startups found only 39% use PLG or self-serve. In DevTools, that jumps to 50%. But in most B2B verticals, sales-assisted and demo-led motions still dominate, and their conversion rates look completely different from PLG funnels. Skip PLG benchmarks entirely if you're running a demo-led motion above $40K ACV - they'll mislead you.
Benchmarks by ACV Tier
This is the segmentation most benchmark articles skip entirely. It's also the most important one.
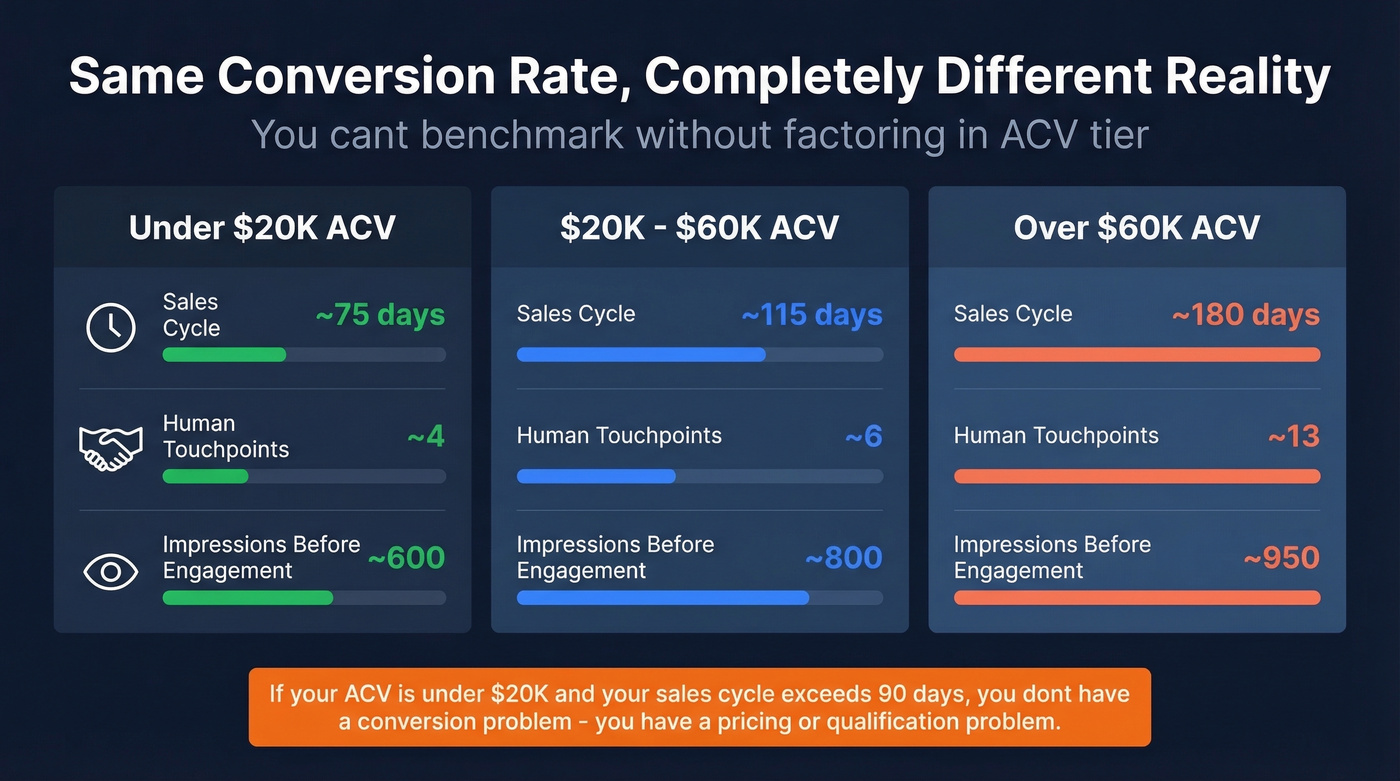
| Metric | <$20K ACV | $20K-$60K | >$60K |
|---|---|---|---|
| Sales cycle | ~75 days | ~115 days | ~180 days |
| Human touchpoints | ~4 | ~6 | ~13 |
| Impressions before engagement | ~600 | ~800 | ~950 |
Source: ThriveStack's ACV-tier analysis.
You can't evaluate MQL-to-SQL or SQL-to-Opp rates without factoring in ACV. A 35% MQL-to-SQL rate on a 180-day enterprise cycle with 13 touchpoints is a fundamentally different animal than 35% on a 75-day SMB cycle with 4 touchpoints. Same number, completely different operational reality.
Let's be blunt: if your ACV is under $20K and your sales cycle exceeds 90 days, you don't have a conversion problem. You have a pricing or qualification problem.
MQL-to-SQL is where most funnels bleed out - and bad contact data is the #1 cause. When 20% of your emails bounce, SDRs waste cycles chasing ghosts instead of converting qualified leads. Prospeo's 98% email accuracy and 7-day data refresh mean your reps reach real buyers, not dead inboxes.
Move your MQL-to-SQL from bottom-25% to top-10% - start with better data.
Marketing Funnel Rates by Channel
Channel source shifts both conversion rate and close rate by 2-3x across stages. The channel mix matters as much as the funnel itself.
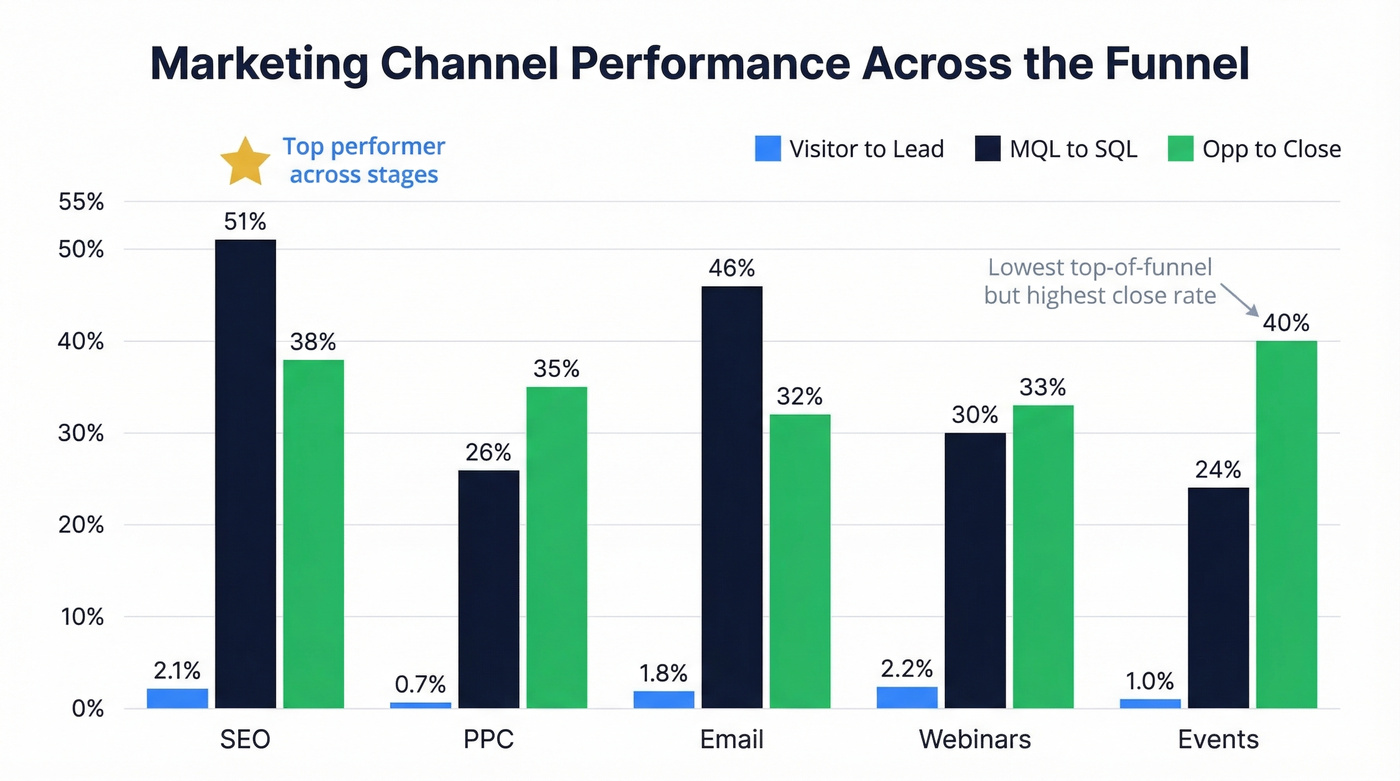
| Channel | Visitor → Lead | MQL → SQL | Opp → Close |
|---|---|---|---|
| SEO | 2.1% | 51% | 38% |
| PPC | 0.7% | 26% | 35% |
| 1.8% | 46% | 32% | |
| Webinars | 2.2% | 30% | 33% |
| Events | 1.0% | 24% | 40% |
SEO outperforms PPC across these stages. Organic visitors have higher intent and self-qualify before they ever hit your site. Events show the lowest top-of-funnel conversion but the highest close rate - in-person interactions build trust that accelerates late-stage deals. If your budget forces a choice between doubling PPC spend and investing in content, the data makes the answer obvious.
Time-to-Convert Benchmarks
| Stage | Median Time |
|---|---|
| Visitor → Lead | 1-3 days |
| Lead → MQL | 4-7 days |
| MQL → SQL | 8-15 days |
| Opp → Close | 30-90 days |
Enterprise SQL-to-close stretches to 120 days. SMB runs 30-45. If your pipeline model assumes a single velocity across all segments, your forecast is wrong by definition.
Why Your Numbers Are Probably Wrong
Before you benchmark against any of these tables, ask your team one question: "What's our denominator?"
Unique visitors vs. sessions can swing visitor-to-lead rates dramatically - we've seen the same site report 2.3% and 1.1% depending on which metric the dashboard uses. A 30-day vs. 90-day cohort windows produces a completely different MQL-to-SQL number than a 90-day window. We've worked with teams where the VP of Sales reports a 40% SQL rate and the VP of Marketing reports 28% - same quarter, same funnel, different attribution models.
There's also the dark funnel problem. A meaningful share of conversions come from channels you can't track - Slack communities, private podcasts, word-of-mouth referrals, that one thread in a niche Discord. If your attribution model doesn't account for dark funnel activity, you're overweighting the channels you can measure and underweighting the ones actually driving decisions.
Fix your definitions before you benchmark. Agree on cohort windows, attribution models, and stage definitions across marketing and sales. Otherwise you're comparing your apples to someone else's oranges.
Where to Fix First
Find the stage with the largest absolute drop-off, multiply by revenue impact, and start there.
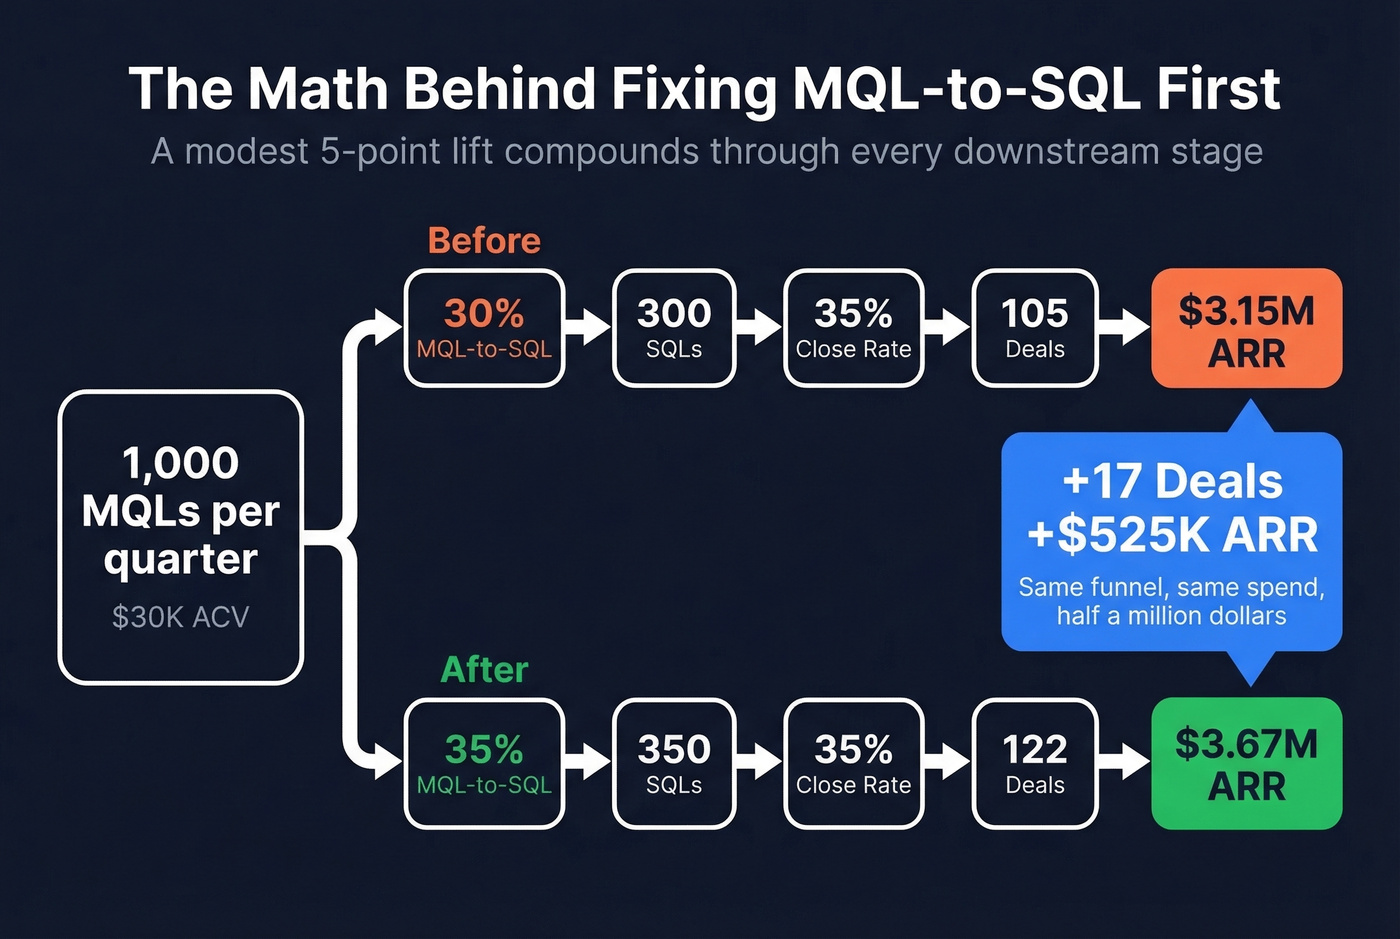
Say you generate 1,000 MQLs per quarter at $30K ACV, with a 30% MQL-to-SQL rate and 35% close rate downstream. That's 105 deals, or $3.15M. Improving MQL-to-SQL from 30% to 35% - a modest 5-point lift - adds 17 deals and $525K in ARR. Same funnel, same spend, half a million dollars.
On the tactical side, 80% of companies with 50%+ activation rates use multimedia onboarding. Keep your signup and demo pages under the 400ms Doherty Threshold - every millisecond of latency bleeds conversions.
But before you overhaul lead scoring or SDR scripts, check something simpler: your data. If 30%+ of outbound emails bounce, MQL-to-SQL will never hit benchmark regardless of process improvements. Bad contact data is the silent funnel killer that no benchmark article talks about. In our experience running pipeline audits, data quality is the root cause more often than anyone expects. If you're tightening your scoring model, start with a clear Ideal Customer Profile and align it with your lead scoring rules.

Prospeo fixes this at the source. Meritt saw their bounce rate drop from 35% to under 4% after switching, and their connect rate tripled to 20-25%. Snyk - with 50 AEs prospecting daily - went from 35-40% bounce rates to under 5%, generating 200+ new opportunities per month. With 98% email accuracy and a 7-day data refresh cycle, your SDRs actually reach the people in your pipeline instead of sending sequences into the void. If you're diagnosing bounces, use these email bounce rate benchmarks and an email deliverability guide to isolate whether it's data, domain health, or sending behavior.
You just saw that enterprise deals need ~13 human touchpoints to close. Every touchpoint that hits a wrong number or bounced email resets your momentum. Prospeo delivers 125M+ verified mobiles with a 30% pickup rate and emails at $0.01 each - so every touch actually lands.
Stop losing deals to bad data. Make every touchpoint count.
FAQ
What's a good visitor-to-customer rate for B2B SaaS?
The industry average is 1.0-1.8%; top-10% performers hit 6%+. Segment by GTM motion and ACV tier before comparing - a freemium DevTool and a demo-led enterprise platform have completely different funnels and benchmarks.
How often should I re-benchmark my funnel?
Quarterly at minimum. Compare against your own trailing quarter first, industry benchmarks second. Conversion rates shift with seasonality, product changes, and market conditions, so stale benchmarks lead to bad decisions.
Does outbound data quality affect funnel conversion?
It's one of the biggest hidden factors. If 30%+ of emails bounce, your MQL-to-SQL rate is artificially depressed - SDRs can't convert leads they can't reach. Teams that fix data quality first often see mid-funnel rates jump 10-15 points without changing anything else in their process.
Which funnel stage has the biggest revenue impact?
MQL-to-SQL delivers the highest ROI per percentage-point improvement. A 5-point lift at this stage on 1,000 MQLs at $30K ACV adds roughly $525K in ARR, because the gain compounds through every downstream stage.