Business Pipeline: Definition, Metrics & Benchmarks (2026)
Pipeline isn't "a sales thing." It's a management thing.
If you treat your business pipeline like a static report you glance at before a forecast call, you'll keep getting surprised at quarter-end.
Run it like an operating system: inputs, stage rules, weekly metrics, and hygiene. Then the quarter stops feeling like a coin flip.
The quick version (what actually matters)
- Pick one pipeline object and stick to it. For revenue, that's usually Opportunities/Deals. For delivery, it might be Projects. For support, Tickets.
- Use 6-8 stages max.
- Write buyer-verifiable exit criteria for every stage. If a buyer can't confirm it happened, it isn't an exit criterion.
- Set default stage probabilities once, then replace them with historical win rates.
- Track time-in-stage and slippage like you track revenue. Stalled deals are the earliest signal you're missing plan.
- Separate pipeline review from forecast. Pipeline review is health + movement; forecast is what you're willing to call.
- Automate hygiene. Push counters, past-due close date rules, and stale-stage auto-close save managers' sanity.
- Run a weekly cadence. First Page Sage (247 B2B orgs; Jan-Apr 2025 dataset; benchmarks published July 2025) found weekly tracking correlates with 87% forecast accuracy.
Three weekly numbers I'd bet on:
- Weighted coverage (weighted pipeline ÷ target)
- Slippage / push rate (% of deals that moved out of period or pushed close date)
- Stage velocity (median days in stage, by stage)
What is a business pipeline (and why it's not just sales)
A business pipeline is a staged view of future outcomes: work moving through defined steps toward a result you care about. Revenue is the obvious one, but it isn't the only one.
Pipelines do one job: they turn a process into stages with numbers attached. That's your pipeline process in business, made measurable.
In practice, a pipeline can exist for lots of objects, not just deals:
- Leads (pre-opportunity qualification)
- Deals/Opportunities (revenue)
- Tickets (support resolution)
- Projects (delivery milestones)
- Orders (fulfillment)
- Custom objects (anything your business runs on)
Here's the litmus test: if you can answer "what stage is this in, and what must be true to move it forward?" you can pipeline it.
Where teams get stuck is thinking pipeline equals "a list of deals." It doesn't. It's a control system: stage definitions, exit criteria, probabilities, aging, and governance. Without those, your pipeline process is just vibes in a CRM.
Pipeline vs funnel vs forecast (glossary + examples)
Here's the clean mental model: pipeline is the seller view, funnel is the buyer/prospect view, and forecast is the subset you expect to close.

| Concept | What it is | Primary owner | Example |
|---|---|---|---|
| Pipeline | Seller view of opps + actions | Sales/RevOps | "$800k in Discovery" |
| Funnel | Buyer journey + conversion rates | Marketing/Growth | "SEO->lead 2.1%" |
| Forecast | Expected revenue subset | Sales leadership/Finance | "Commit $420k (Q2)" |
The mistake I've seen constantly: teams argue about forecast accuracy when they don't even have pipeline definitions nailed down. Forecast is downstream.
Hygiene and stage discipline are upstream.
Pipeline stages that actually work (stop adding stages, add exit criteria)
Use this if: your stages feel squishy, reps skip steps, and managers can't coach because everything is "in Discovery."
Skip this if: you're about to add a ninth stage because "we need more detail." You don't. You need better rules.
A stage model that works in the real world:
- New / Triage
- Discovery
- Demo (Solution Fit)
- Proposal (Scoping)
- Negotiation (Business Case)
- Commit (Awaiting Signature)
- Closed (Won/Lost)
Stage names barely matter.
Exit criteria do.
The mini-framework: buyer-verifiable exit criteria
For each stage, write 2-4 criteria that are:
- Observable (a thing happened)
- Buyer-verifiable (the buyer would agree it's true)
- Artifact-backed (email, meeting, doc, mutual plan)

Examples that hold up:
- Discovery -> Demo: buyer confirmed the problem + agreed to a demo date with required attendees.
- Demo -> Proposal: buyer confirmed success criteria + shared buying process steps (or agreed to a mutual plan).
- Proposal -> Negotiation: buyer reviewed proposal live or in writing + identified legal/procurement path.
- Negotiation -> Commit: signature is the only remaining step + date is agreed + redlines are resolved.
Examples that don't hold up (and create fake pipeline):
- "Good call"
- "They liked it"
- "Sent follow-up"
- "Waiting to hear back"
I've watched teams waste months "improving pipeline" by adding stages like Security Review or Procurement when the real issue was they never defined what qualifies a deal to be there. Add criteria, not stages.
Pipeline coverage ratios mean nothing when 20-35% of your emails bounce. Prospeo's 98% email accuracy and 7-day data refresh turn your pipeline from a fantasy spreadsheet into a real operating system - with contacts that actually connect.
Stop managing ghost pipeline. Start with data that reaches real buyers.
Business pipeline metrics that run the week (with formulas)
Most pipeline dashboards are noise. These five metrics are the ones that change behavior, because they force clear conversations about sufficiency, movement, and risk instead of letting everyone hide behind a big top-line pipeline number.

| Metric | Formula | Why it matters | Practical default |
|---|---|---|---|
| Coverage ratio | Pipeline ÷ Target | Tells you sufficiency | Track weekly |
| Weighted coverage | Σ(Amount×Prob) ÷ Target | More predictive than raw | Use stage probs |
| Slippage / push rate | # pushed ÷ # expected | Reveals risk + sandbagging | Watch by rep |
| Stage velocity | Median days in stage | Finds bottlenecks | By stage + segment |
| Sales velocity | (Deals×Win%×Avg deal) ÷ Cycle days | Converts pipeline into $/day | Trend monthly |
Coverage ratio (unweighted) and why it lies
Coverage ratio is simple: total pipeline value ÷ total sales target value.
It's also easy to game. If reps stuff early-stage deals with fantasy close dates, unweighted coverage looks great right until it doesn't.
Practical unweighted coverage ranges by segment:
- SMB: 2-3x
- Mid-market: 2.5-4x
- Enterprise: 3-5x
Weighted vs unweighted pipeline (use both, trust weighted)
Unweighted treats every deal as 100% likely to close. Weighted multiplies each opportunity by a probability (stage-based at first, historical later).
- Unweighted pipeline answers: "How much stuff is in play?"
- Weighted pipeline answers: "How much is realistically likely?"
If you only track one, track weighted. Keep unweighted as a volume signal, especially for early-stage pipeline generation.
Slippage / push rate (the metric that exposes reality)
Slippage is the percent of deals that move out of the period (or push close date) after being expected to close.
High slippage means one of three things:
- close dates are fiction
- deals are under-qualified
- your cycle length assumptions are wrong
Look, push rate is also a management signal. If one rep's push rate is 2x the team, they either need coaching or they're sandbagging, and pretending it's "just how enterprise works" is how teams end up with a pipeline full of ghosts.
Stage velocity (time-in-stage) is your early warning system
Track median days in stage by stage, by segment, and by rep.
When Discovery time doubles, you don't have a forecast problem. You have a qualification or messaging problem.
Fix it upstream.
Sales velocity (the only metric that ties it all together)
Sales velocity combines four drivers:
- Deal volume
- Win rate
- Average deal size
- Sales cycle length
Formula:
Sales Velocity = (Number of Opportunities × Win Rate × Average Deal Size) ÷ Sales Cycle Length (days)
A useful benchmark for SaaS & Technology is about $1,847/day in sales velocity (based on a multi-company dataset). Don't worship the number; use it to sanity-check whether your changes are moving the needle.
Advanced metric: cohorted win rates (snapshots that stop forecast lies)
Average win rate is a trap because it mixes deals created last week with deals created nine months ago.
Cohorted win rate fixes that by measuring win rate by opportunity created month/quarter (your "cohort"), then tracking how that cohort converts over time. It's the cleanest way to answer: "Are the deals we're creating right now actually good?"
How to implement it without fancy tooling:
- Take a monthly pipeline snapshot (export open opps with created date, stage, amount, close date).
- Track outcomes by cohort: created in Jan -> won/lost by Apr/May/Jun.
- Use cohort curves to set expectations (example: "By day 45, this cohort should have 35% progressed past Demo").
This is operator-grade forecasting, and it catches quiet quality drops when you change ICP, messaging, or lead sources because the cohort curve bends before revenue does.
Business pipeline diagnostics: top-heavy vs bottom-heavy (and what to do Monday)
Most teams don't have a pipeline problem. They have an imbalance problem.

Top-heavy pipeline (lots of early stage, thin late stage)
What it looks like: big Discovery number, tiny Proposal/Negotiation number, and a forecast that depends on miracles.
Usually means: qualification is loose, exit criteria are weak, or Discovery isn't producing real next steps.
Do this:
- Tighten Discovery exit criteria (success criteria + buying process + next meeting scheduled).
- Measure Discovery->Demo and Demo->Proposal conversion weekly; coach the worst stage.
- Kill "maybe" deals fast. A smaller pipeline that moves beats a bloated one that rots.
Bottom-heavy pipeline (late stage heavy, not enough creation)
What it looks like: Negotiation/Commit looks healthy this month, but next month is empty.
Usually means: you're living off old pipeline and starving creation.
Do this:
- Set a weekly creation floor (new qualified opps or qualified meetings) by rep and by segment.
- Stop letting reps "work late stage all week." Protect prospecting time like it's a customer meeting.
- Audit sources: if inbound is down, outbound must be measured by qualified opps created, not activities.
Three fast "if you see X, do Y" rules
- If stage velocity spikes in Discovery: fix qualification + messaging before you touch forecasting.
- If slippage rises but pipeline stays flat: your close dates are fiction; enforce close-date rules and push counters.
- If Commit is full but next quarter is empty: you've got a pipeline generation problem, not a closing problem.
Business pipeline benchmarks (coverage, cycle length, conversion)
Benchmarks are uncomfortable because they force decisions. Good.
Use them to stop debating and start operating.
Coverage benchmarks (unweighted, by segment)
| Segment | Typical unweighted coverage |
|---|---|
| SMB | 2-3x |
| Mid-market | 2.5-4x |
| Enterprise | 3-5x |
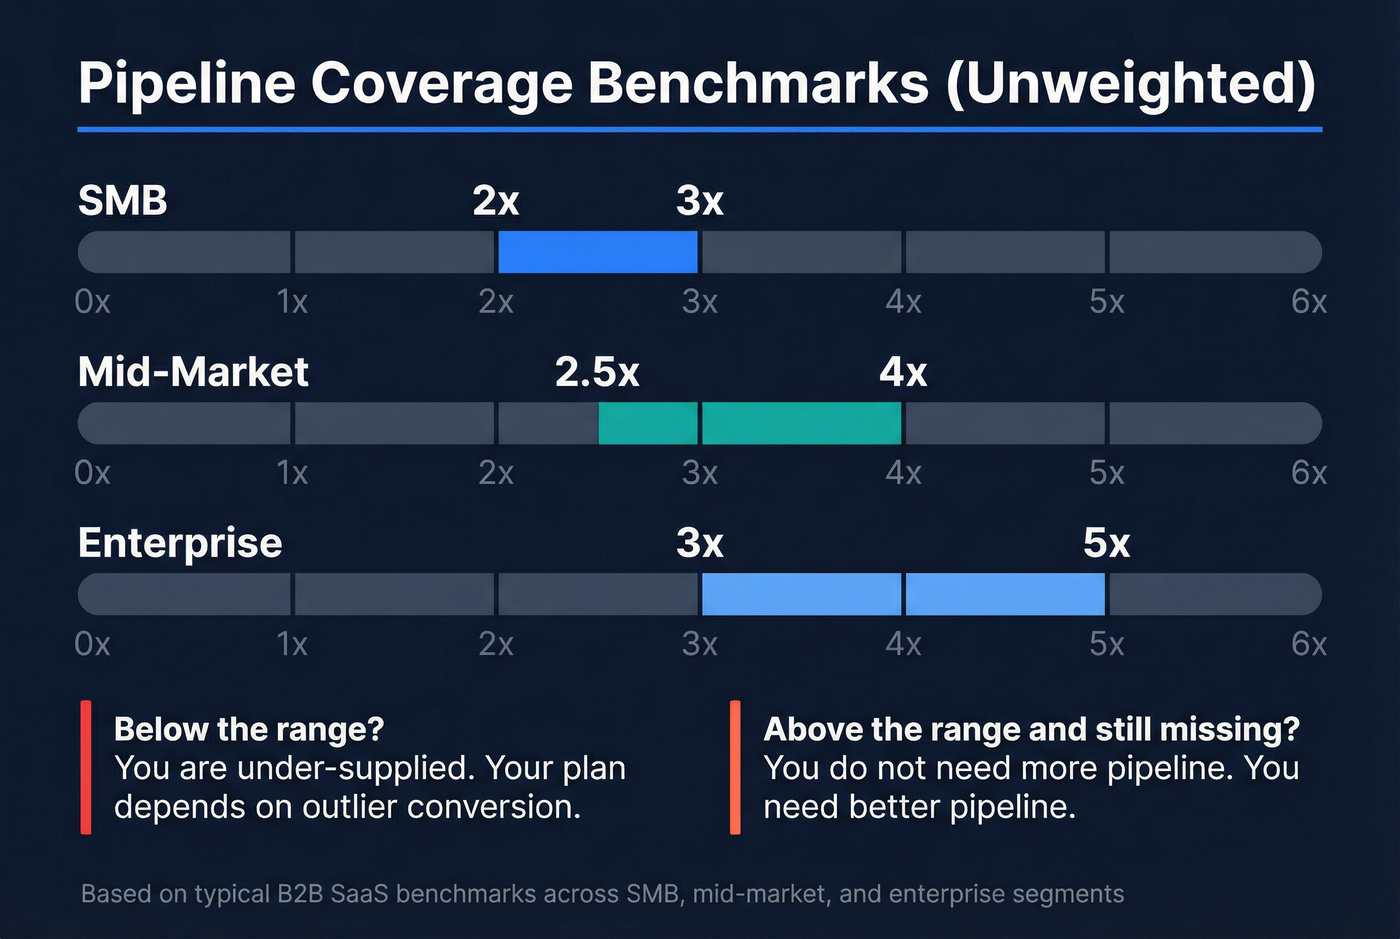
How to use this table:
- If you're below the range, you're under-supplied. Your plan depends on outlier conversion.
- If you're above the range and still missing, you don't need more pipeline. You need better pipeline (conversion, stage discipline, or cycle time).
Probability-weighted coverage benchmark (B2B tech, $5M-$50M ARR)
| Company band | Weighted coverage (hit plan) | Weighted coverage (top quartile) |
|---|---|---|
| B2B tech ($5M-$50M ARR) | 2.1x | 2.8x |
That 2.1x / 2.8x benchmark comes from a KeyBanc-derived cut summarized by TechGrowthInsights.
In that same KeyBanc-derived cut, teams using probability-weighted coverage forecast within +-10%, while teams leaning on raw/unweighted coverage land around +-25-35%.
Sales cycle length benchmarks by ACV
| ACV band | Avg cycle length |
|---|---|
| $50k-$100k | 120 days |
| >$500k | 270 days |
If you're selling bigger deals and still running a "close by end of month" culture, you're manufacturing slippage.
Mini funnel conversion benchmarks (sample rows)
| Channel | Visitor->Lead | Lead->MQL | MQL->SQL | Opp->Close |
|---|---|---|---|---|
| SEO | 2.1% | 41% | 51% | 36% |
| PPC | 0.7% | 41%* | 26% | 36%* |
| Webinar | 0.9% | 41%* | 51%* | 36%* |
*If you don't have channel-specific close rates yet, start with 36% as a temporary planning assumption and replace it with your cohort data.
Hot take: if your average deal is low and your cycle is under 30 days, keep this whole benchmark conversation simpler. Don't build an enterprise-grade pipeline bureaucracy for a transactional motion. Track creation, conversion, and slippage, and move on.
How much pipeline do you need? (worked example: quota -> pipeline -> SQLs -> leads)
"3x pipeline" is a myth. The right number depends on win rate, cycle length, deal size, and lead source quality.
Also: don't confuse pipeline coverage with forecast coverage.
- Pipeline coverage = all qualified pipeline you're working
- Forecast coverage = the subset you're willing to call (commit/best case)
Worked example (step-by-step)
Assume:
- Quarterly target: $500,000
- Average deal size: $25,000
- Win rate: 25%
- Sales cycle: 90 days
- You're measuring pipeline for the quarter (not the year)
Step 1) Break-even coverage from win rate If win rate is 25%, you need ~4x coverage to break even.
So required unweighted pipeline:
- $500,000 ÷ 0.25 = $2,000,000
- Coverage ratio = $2,000,000 ÷ $500,000 = 4.0x
Step 2) Convert pipeline dollars into opportunity count
- $2,000,000 pipeline ÷ $25,000 per deal = 80 opportunities
Step 3) Convert opportunities into SQLs (using a practical default) If your SQL->Opportunity rate is 50% (common when SQL is defined tightly), you need:
- 80 opps ÷ 0.50 = 160 SQLs
Step 4) Convert SQLs into leads (using funnel benchmarks as a starting point) If MQL->SQL is 51% (SEO benchmark), then:
- 160 SQLs ÷ 0.51 ≈ 314 MQLs
If Lead->MQL is 41% (SEO benchmark), then:
- 314 MQLs ÷ 0.41 ≈ 766 leads
Now you can finally have an adult conversation about inputs:
- Do we have enough traffic?
- Are we converting?
- Is outbound producing real SQLs or just activity?
I've run this math with teams where the "pipeline problem" was actually a definition problem: they were calling things SQLs that were really just leads. Fix the definitions, and the coverage target stops feeling random.
Pipeline operating cadence (pipeline review != forecast call)
A pipeline review is where you improve the machine. A forecast call is where you call the number.
If you blend them, you get the worst of both: reps defend deals instead of inspecting them, and managers stop coaching because they're busy negotiating the forecast.
A cadence worth copying:
Weekly: Rep + Manager (30-45 min)
- Inspect deals added / advanced / stalled / slipped / lost
- Check next step quality (is it scheduled and buyer-owned?)
- Review push rate and repeat pushers
- Coach one stage bottleneck (pick one, not five)
Biweekly: Manager + Director (45-60 min)
- Stage velocity by segment (where deals die)
- Sufficiency: early-stage creation vs late-stage dependence
- Enablement gaps (objection themes, competitive losses)
- Pipeline waterfall: are we replenishing what we're closing?
Monthly: VP + RevOps (60-90 min)
- Segment trends (SMB vs mid-market vs enterprise)
- Pipeline pacing vs plan (are we building early enough?)
- Cross-functional blockers (pricing, product gaps, legal/security)
- Governance: are definitions and probabilities still accurate?
I've seen the "weekly rep/manager, biweekly director, monthly exec" rhythm take forecast accuracy from chaos to boring.
Boring is the goal.
Pipeline governance: the council that keeps definitions from drifting
Pipeline breaks when every team "slightly" redefines stages and qualification. The fix is governance, not another dashboard.
Set up a pipeline council with Sales, Marketing, CS, Finance, and Product (RevOps owns the system of record). Keep it short and strict:
- One set of stage definitions and exit criteria. No side quests.
- One probability model (stage-based until you have enough history; then cohort it).
- One hygiene SLA: pipeline is clean by the 5th business day of the new quarter (close dates, stages, next steps, owners, and zombie deals handled).
Enterprise note: if legal/procurement is real in your motion, start it 60-90 days before quarter end. Waiting until the last two weeks is how "Commit" turns into "Oops."
Business pipeline hygiene system (automations + zombie-deal policy)
Pipeline hygiene is where good intentions go to die unless you automate it and enforce rules.
And yes, this is the part everyone hates. That's exactly why it needs rules.
Automations that actually stick
Checklist:
- Auto-push past-due close dates: if close date is in the past and opp is still open, push it out 30 days.
- Push Counter field: increment every time close date is pushed.
- Auto-close stagnant Stage 0: if an early-stage opp has no recent activity, close it out (with a reason).
- Manager override checkbox: let managers keep an exception open without breaking the system.
- Hygiene dashboard:
- opps owned by inactive users
- past-due open opps
- push counter leaderboard
- oldest Stage 0 opps
- oldest qualified+ opps
The push counter is the secret weapon. It turns "I think this deal is real" into "this deal has slipped 4 times."
Zombie-deal policy (thresholds that stop pipeline rot)
A deal is a zombie when it's consuming attention but has stopped behaving like a real buying process.
Use any of these as automatic zombie flags:
- 1.5x stage duration (stuck too long in the same stage)
- 30+ days with no meaningful two-way communication
- 3+ slips (close date pushed three times)
Monthly scrub ritual:
- Filter opps with no activity in the last 21-30 days
- Require a scheduled next step tied to a buyer milestone
- Move "not now" into nurture (don't let it rot in active pipeline)
UnifiedPipeline has a clear walkthrough of stale-opportunity handling and a refreshingly straightforward price point ($499/mo): stale opportunities in Salesforce.
Build a pipeline template in Sheets/CRM in 30 minutes (fields + formulas)
If your CRM reporting is a mess, build the template in Sheets first. Then mirror the fields in your CRM.
A workbook structure that works:
Workbook structure (4 sheets)
- Pipeline working board (the rep view)
- Stage rules (definitions + entry/exit criteria + required artifacts)
- Forecast & health (coverage, weighted pipeline, win rate, cycle length, slippage)
- Admin (lookup tables: stage probabilities, SLA targets)
Required columns (working board)
| Column | What it's for |
|---|---|
| Opportunity | Unique deal name |
| Owner | Accountability |
| Amount | Unweighted value |
| Stage | Current stage |
| Stage Entered | Aging anchor |
| Next Step | Scheduled buyer action |
| Close Date | Period alignment |
| Push Count | Slippage tracking |
| Forecast Category | Pipeline vs Commit |
| Probability | Stage/historical |
| Weighted Amount | Realistic value |
| Stage Aging | Time-in-stage |
Formulas (copy/paste level)
- Weighted Amount =
Amount * Probability - Stage Aging =
TODAY() - Stage Entered - Coverage =
Total Pipeline / Target
Two implementation notes from experience:
- Don't let reps type probabilities. Use a locked lookup table by stage (then replace with historical later).
- Make "Next Step" required and specific. "Follow up" isn't a next step. "Security review scheduled for Feb 28" is.
Create pipeline faster (the input lever most teams ignore: contactability)
When pipeline's dry, teams usually blame messaging, pricing, or "the market." Sometimes that's true.
But the most common, least glamorous cause is contactability: you're aiming at the right accounts and still not reaching real humans. Emails bounce, numbers don't connect, and your domain reputation gets quietly cooked. Then outbound "isn't biting," and everyone spirals.
Here's a scenario I've seen too many times: a manager asks for "more activity," reps crank volume, bounce rates climb, and two weeks later inbox placement tanks across the whole team, so even the good accounts stop replying and the pipeline drought gets worse right when you needed momentum.
We've tested this across outbound teams, and the pattern's boring: better data quality shows up first as fewer bounces, then more conversations, then more qualified meetings, and only after that does it show up as pipeline.
Pricing reality: enterprise data platforms often land around $10k-$50k/year once you add seats and modules. Self-serve data tools are usually monthly or usage-based, which is easier when you're iterating.
If you want the fastest fix, start with verified contacts. Prospeo is the B2B data platform built for accuracy, and it's the one we point teams to when they care about data freshness and self-serve execution: 98% email accuracy, a 7-day refresh (industry average: 6 weeks), and 125M+ verified mobile numbers with a 30% pickup rate. It also covers 300M+ professional profiles and 143M+ verified emails, so you can build lists without stitching together three tools and praying the records match.
Do this next:
- tighten your ICP filters (role + company signals)
- refresh your target list weekly (not quarterly)
- verify emails and prioritize verified mobiles for your top accounts

Stage velocity stalls when reps spend hours hunting for valid contact data instead of selling. Prospeo gives your team 300M+ verified profiles with 30+ filters - intent signals, job changes, technographics - so pipeline moves forward instead of sitting in Discovery forever.
Fill every pipeline stage with buyers you can actually reach.
Summary: make the business pipeline boring (that's the win)
A business pipeline gets predictable when inputs are measurable, stages are enforceable, and hygiene is automated.
Do that, and the forecast stops being a debate because you can see what's real, what's stalled, and what's been typed into a CRM.
FAQ
What's the difference between a business pipeline and a sales pipeline?
A business pipeline is any staged process that tracks work toward a future outcome (revenue, delivery, support, hiring). A sales pipeline is one specific version focused on opportunities moving from qualification to closed-won/lost in a CRM.
What is a good pipeline coverage ratio in 2026?
A good target is segment-dependent: SMB 2-3x, mid-market 2.5-4x, enterprise 3-5x unweighted coverage. For B2B tech companies in the $5M-$50M ARR band, probability-weighted coverage of 2.1x is a strong "hit plan" benchmark, and 2.8x is top quartile.
What counts as a "zombie deal" in a pipeline?
A zombie deal is an opportunity that stays open but stops behaving like an active buying process, typically 1.5x longer than normal in a stage, 30+ days with no two-way communication, or a close date that's slipped 3+ times. Zombies inflate coverage and destroy forecast trust.
What's the difference between pipeline coverage and forecast coverage?
Pipeline coverage is all qualified pipeline you're actively working (the full set of deals that meet your stage rules). Forecast coverage is the smaller subset you're willing to call: what you'd put in commit/best case for the period. Pipeline is about sufficiency and health; forecast is about what you're prepared to be held to.
How can I generate pipeline faster without hurting deliverability?
Generate pipeline faster by improving contactability: target tighter lists, refresh data weekly, and verify emails before sequencing so bounces don't damage your domain. Prospeo helps by providing verified emails and mobiles with 98% accuracy and a 7-day refresh.