CAC and LTV Meaning: What the Textbook Definitions Leave Out
You just pulled up your unit economics for the board deck. CAC looks great - $40 per customer. Then your VP of Finance adds salaries, tools, and event costs, and suddenly it's $130. The ratio you were proud of just got cut by more than half.
Understanding the real meaning of CAC and LTV is the difference between a confident growth plan and a slow cash bleed. We've seen teams undercount CAC by 2-3x, and it quietly wrecks every downstream metric that depends on it.
TL;DR - What You Need
CAC is everything you spend to win a customer - not just ad dollars. LTV is the total revenue a customer generates over their lifetime with you. The standard benchmark for a healthy LTV:CAC ratio is 3:1 or better, but that number is meaningless without knowing your CAC payback period. A 5:1 ratio with 18-month payback can kill your cash flow faster than a 2.5:1 ratio with 6-month payback. Below: how to calculate both correctly, what benchmarks actually look like by industry, and the five mistakes that make your ratio lie.
The Formulas Behind CAC and LTV
Understanding these metrics starts with honest math - and the honesty part is where most teams fall short.
What Is CAC?
Customer acquisition cost is the total cost of converting a stranger into a paying customer. Simple concept. Deceptively hard to calculate without fooling yourself.
CAC = Total Acquisition Costs / New Customers Acquired
One fraction. The problem isn't the math - it's the numerator. What counts as an "acquisition cost" is where teams diverge wildly, and where most of the errors live.
Working CAC vs Fully Loaded CAC
There are two versions of CAC, and they serve different purposes.
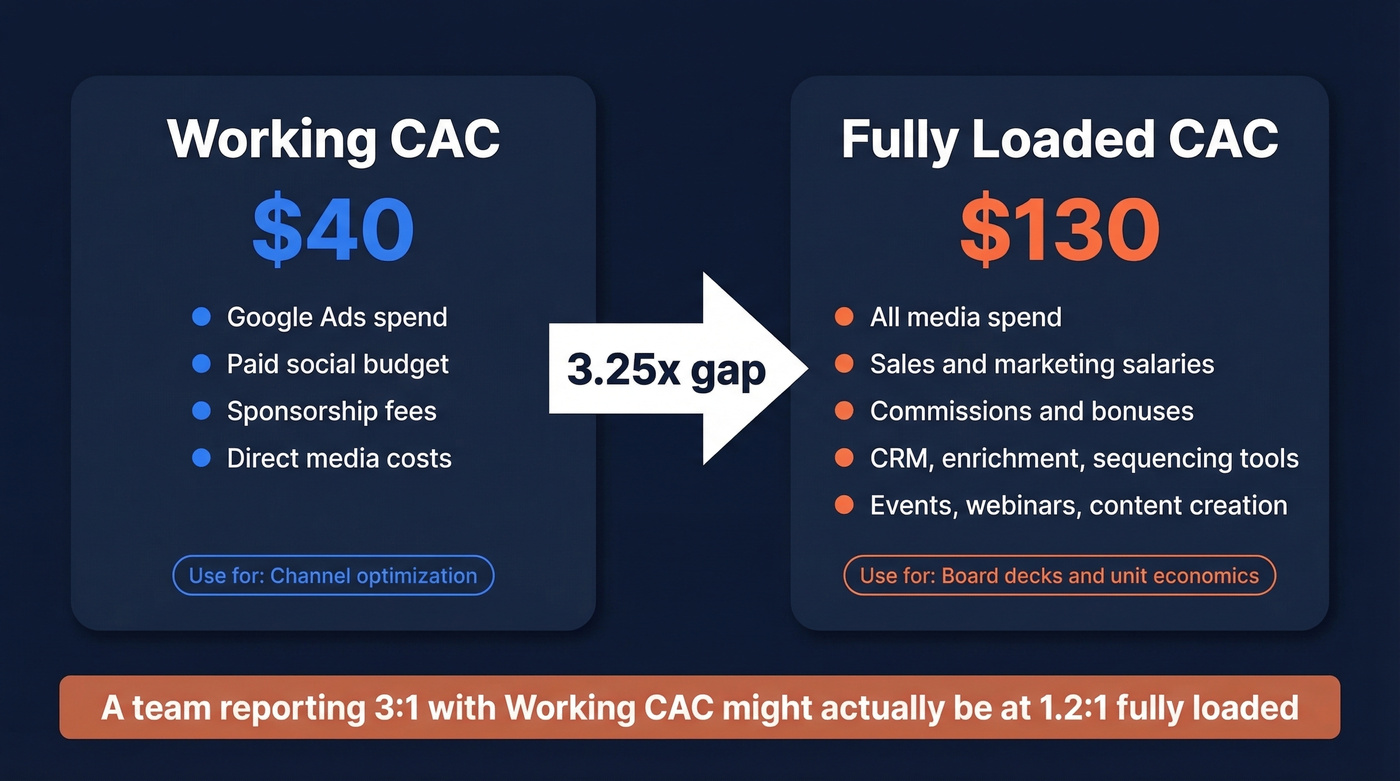
Working CAC includes only direct media spend - your Google Ads budget, paid social, sponsorships. It's useful for channel-level optimization because it isolates variable spend. Quick test: if this cost doubled overnight, would you see an immediate change in lead volume?
Fully loaded CAC includes everything: salaries, commissions, tools, events, overhead allocated to acquisition. This is the number that belongs in board decks and unit economics models. It reflects what you're actually spending to acquire customers.
The gap between these two numbers is often enormous. A real example from Phoenix Strategy Group: $45,000 in salaries plus $20,000 in marketing spend across 500 customers gives you a fully loaded CAC of $130. If you only count the marketing spend, your CAC looks like $40. Same business, same quarter, wildly different story. We've seen teams report 3:1 ratios that collapse to 1.2:1 once salaries are included.
One trap to watch for as you scale: including fixed costs in your CAC can mask deterioration. If your media CAC jumps 50% but your all-in CAC only rises 30% because fixed costs are spread across more customers, you might miss the signal that paid channels are getting more expensive.
| Include in Fully Loaded CAC | Exclude |
|---|---|
| Paid media spend | COGS / delivery costs |
| Sales & marketing salaries | R&D expenses |
| Commissions & bonuses | General admin overhead |
| CRM, enrichment, sequencing tools | Customer support costs |
| Events, webinars, sponsorships | Product development |
| Content creation costs | Post-sale onboarding |
Every tool in your sales stack is a CAC line item - your CRM, your sequencer, your enrichment platform. Accurate contact data reduces the wasted outreach that silently inflates the rest of your fully loaded cost.
What Is LTV?
Lifetime value is the total revenue - or gross profit, more on that distinction shortly - a customer generates from their first purchase to their last. It's the other half of the ratio, and it's just as easy to miscalculate.
Three Ways to Calculate LTV
Historical LTV sums up actual revenue from past customers. Backward-looking and useless for forecasting.
Cohort LTV groups customers by acquisition month and tracks revenue per cohort over time. This is the one most operators should use - it captures how customer behavior changes across different acquisition periods and gives you a trendline you can actually act on.
Predictive LTV uses statistical models to forecast future revenue. Powerful when your assumptions hold, misleading when they don't.
For most teams without a dedicated data science function, cohort-based LTV hits the sweet spot between accuracy and practicality.
SaaS LTV Formula
If you're running a subscription business, here's the formula your CFO wants:
LTV = (Cohort ACV x Subscription Gross Margin) / (1 - GRR)
Use your most recent cohort's ACV, not a blended average across all customers. Blended averages mask whether your newer customers are more or less valuable than older ones. For gross margin, use the trailing three-to-six months. GRR (gross revenue retention) goes in the denominator - 1 minus GRR equals your dollar churn rate.
Worked example: $12,000 cohort ACV x 75% gross margin / (1 - 0.90 GRR) = $90,000 LTV. Change that GRR to 85% and LTV drops to $60,000. Churn is the most sensitive variable in this formula by far.
LTV Without Subscriptions
Not every business has recurring revenue. Agencies, ecommerce companies, and service businesses need a different approach: estimate purchase frequency, then average customer lifespan, then multiply by average revenue per transaction.
Worked example: customers purchase roughly every 209 days, with an average lifespan of 3.5 purchases and $225 average order value. Revenue-based LTV = 3.5 x $225 = $787.50. But this is revenue LTV, not gross-profit LTV - if your delivery costs eat 40% of that, your margin-based LTV is closer to $472. Pair the revenue figure with a $150 CAC and you've got a 5.25:1 ratio. Pair the margin figure with that same CAC and it's 3.15:1. Same business, very different story depending on which number you use.
How to Read the LTV:CAC Ratio
LTV:CAC = Customer Lifetime Value / Customer Acquisition Cost
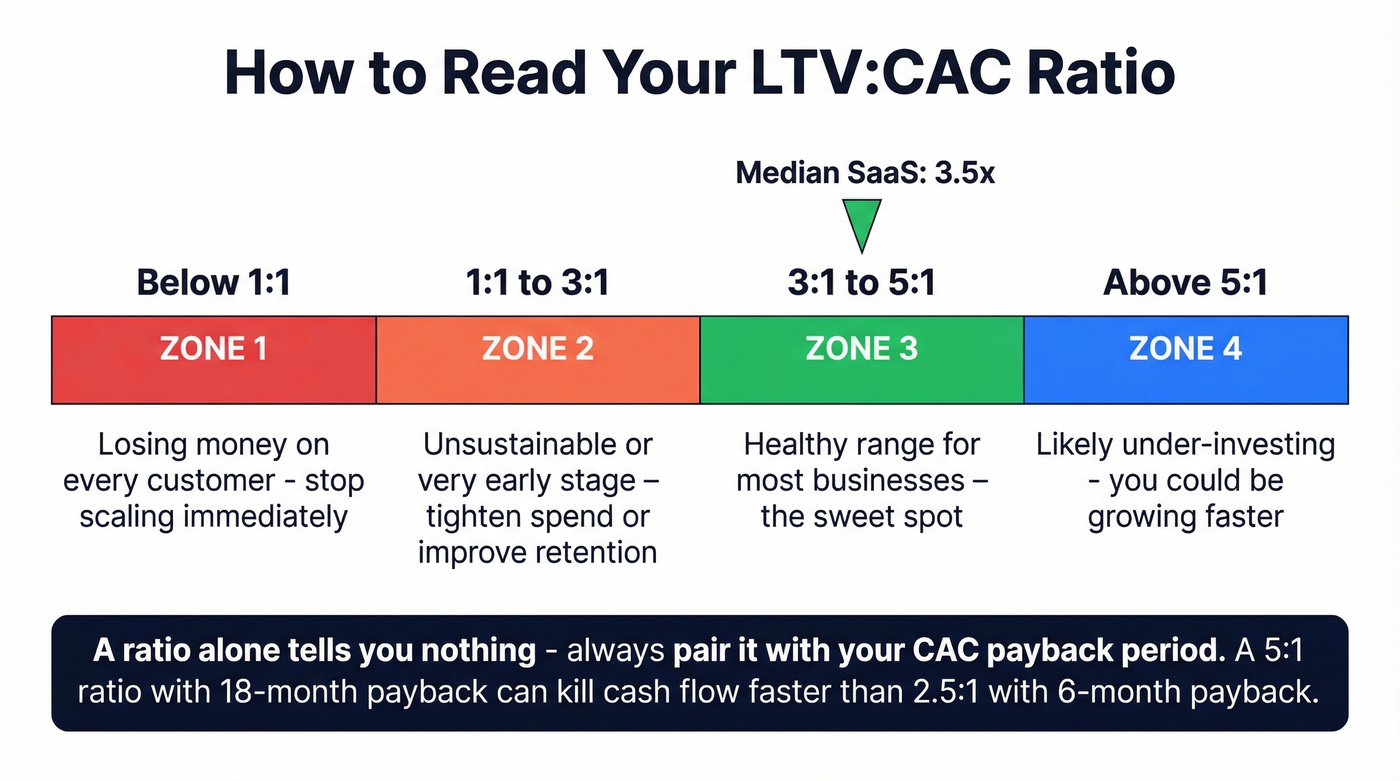
The standard benchmark is 3:1 - for every dollar you spend acquiring a customer, you should get three dollars back over their lifetime. Median SaaS LTV:CAC sits around 3.5x per Chargebee's benchmarks. Investors use this ratio as a quick health check on whether a business model can sustain itself - it's one of the first numbers a VC will ask for.
Here's how to read the number:
- Below 1:1 - You're losing money on every customer. Stop scaling.
- 1:1 to 3:1 - Unsustainable or very early-stage. Tighten spend or improve retention.
- 3:1 to 5:1 - Healthy range for most businesses.
- Above 5:1 - Sounds great, but it often signals under-investment. You could be growing faster. If your ratio is 8:1, you're leaving pipeline on the table.
A ratio in isolation tells you almost nothing. You need the payback period alongside it.
Same Company, Three Lenses
Here's something most guides skip: how the same company's unit economics shift dramatically depending on methodology. This is the exercise that separates operators who understand their numbers from those who just report them.
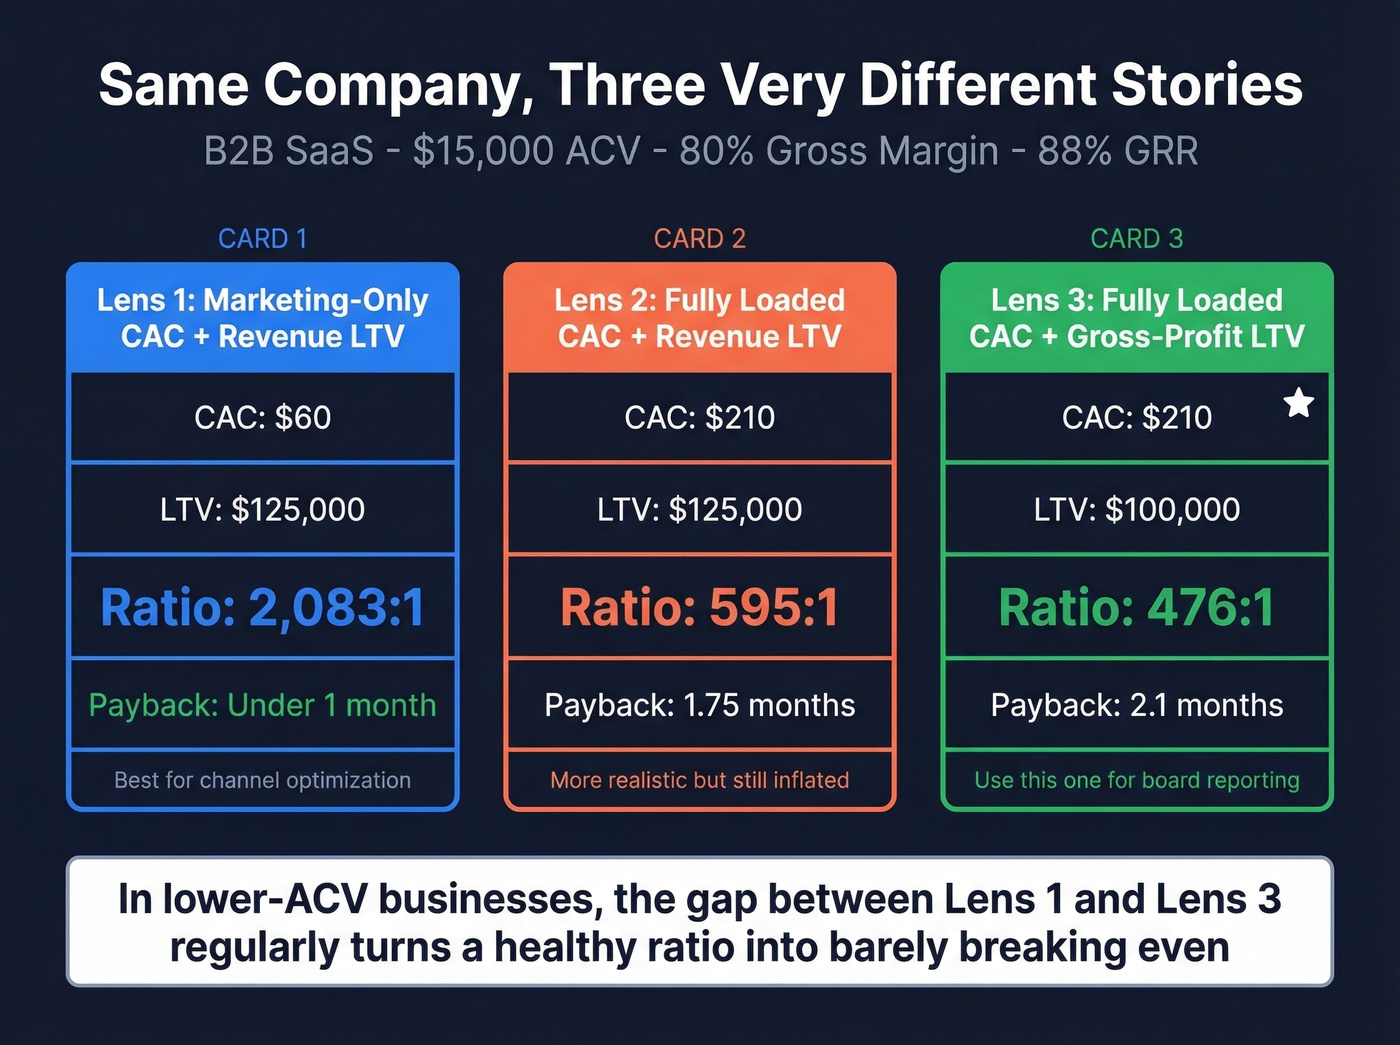
Company X: B2B SaaS, $15,000 ACV, 80% gross margin, 88% GRR, 500 new customers last year.
| Metric | Lens 1: Marketing-Only CAC + Revenue LTV | Lens 2: Fully Loaded CAC + Revenue LTV | Lens 3: Fully Loaded CAC + Gross-Profit LTV |
|---|---|---|---|
| CAC | $60 (ad spend only) | $210 (salaries, tools, events included) | $210 |
| LTV | $125,000 | $125,000 | $100,000 (80% margin applied) |
| LTV:CAC | 2,083:1 | 595:1 | 476:1 |
| Payback Period | < 1 month | 1.75 months | 2.1 months |
Those ratios are absurdly high because the ACV is large relative to the cost base - but the point stands. In lower-ACV businesses, the swing between Lens 1 and Lens 3 regularly turns a "healthy" ratio into a "we're barely breaking even" ratio. In our experience, the gap between working and fully loaded CAC surprises even seasoned operators.
Pick Lens 3 for board reporting. Use Lens 1 for channel optimization. Never confuse the two.
Here's the thing: if your ACV is under $5,000 and you're only tracking marketing-spend CAC, you almost certainly don't have the unit economics you think you do. Run the fully loaded, gross-profit version before your next board meeting.
Every wasted email, bad phone number, and bounced sequence inflates your fully loaded CAC. Prospeo delivers 98% email accuracy and 30% mobile pickup rates - so your sales spend actually converts. At $0.01 per verified email, your enrichment line item shrinks while your denominator grows.
Stop padding your CAC with bad data. Fix the numerator.
Benchmarks by Industry
These benchmarks draw from Chargebee's industry data and First Page Sage's B2B CAC benchmarks based on client data from January 2022 through August 2025.
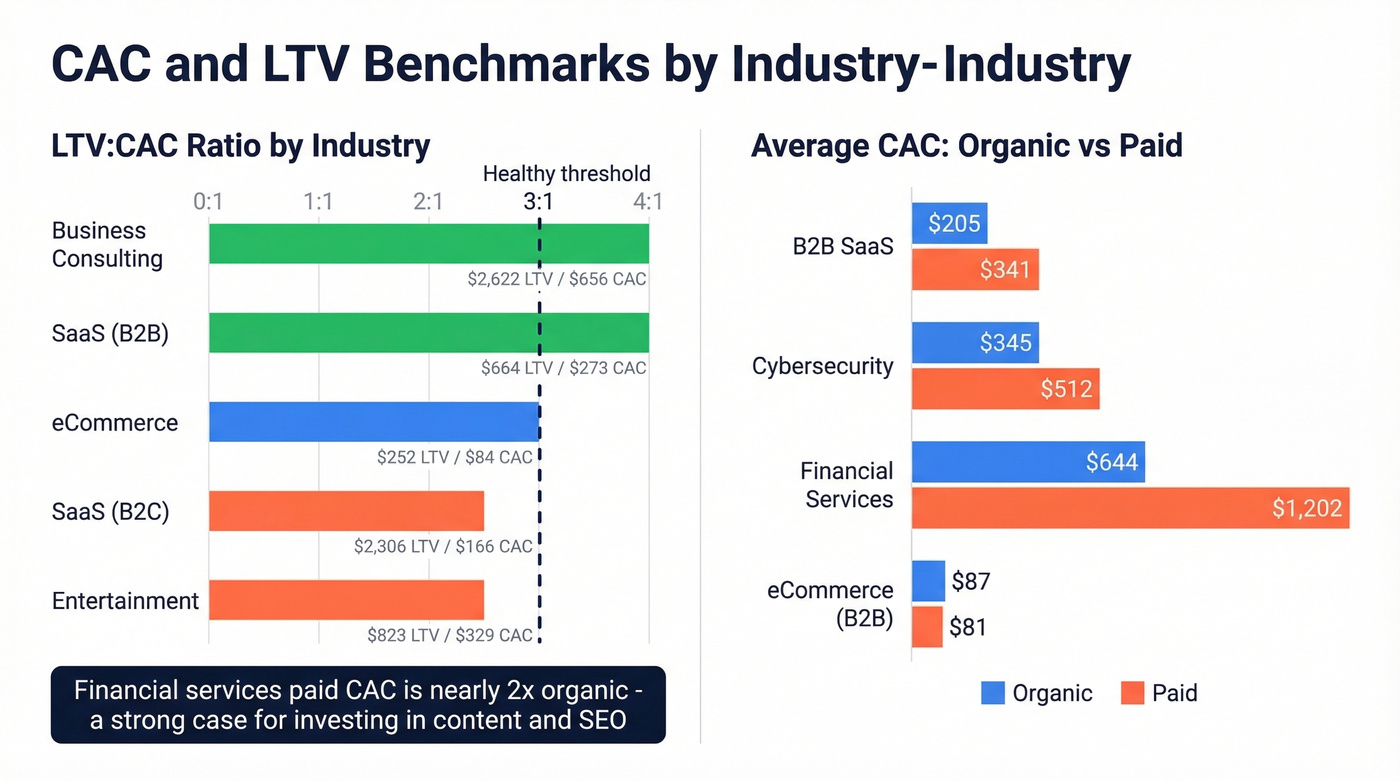
LTV:CAC by Industry
| Industry | LTV | CAC | Ratio |
|---|---|---|---|
| Business Consulting | $2,622 | $656 | 4:1 |
| SaaS (B2B) | $664 | $273 | 4:1 |
| eCommerce | $252 | $84 | 3:1 |
| SaaS (B2C) | $2,306 | $166 | 2.5:1 |
| Entertainment | $823 | $329 | 2.5:1 |
Average CAC: Organic vs Inorganic
| Industry | Organic | Inorganic | Combined |
|---|---|---|---|
| B2B SaaS | $205 | $341 | $239 |
| Cybersecurity | $345 | $512 | $387 |
| Financial Services | $644 | $1,202 | $784 |
| eCommerce (B2B) | $87 | $81 | $86 |
The gap between organic and inorganic CAC is striking in high-trust industries like financial services - nearly 2x. That alone should tell you where to invest in content and SEO.
A 3:1 ratio is a starting point, not a universal target. A 3:1 ratio with 18-month payback is worse than 2.5:1 with 6-month payback. Context always wins.
CAC Payback Period
You just presented a 5:1 LTV:CAC to your board, and the CFO asked about payback period. You don't have an answer. This is the metric that separates theoretical unit economics from actual cash flow reality.
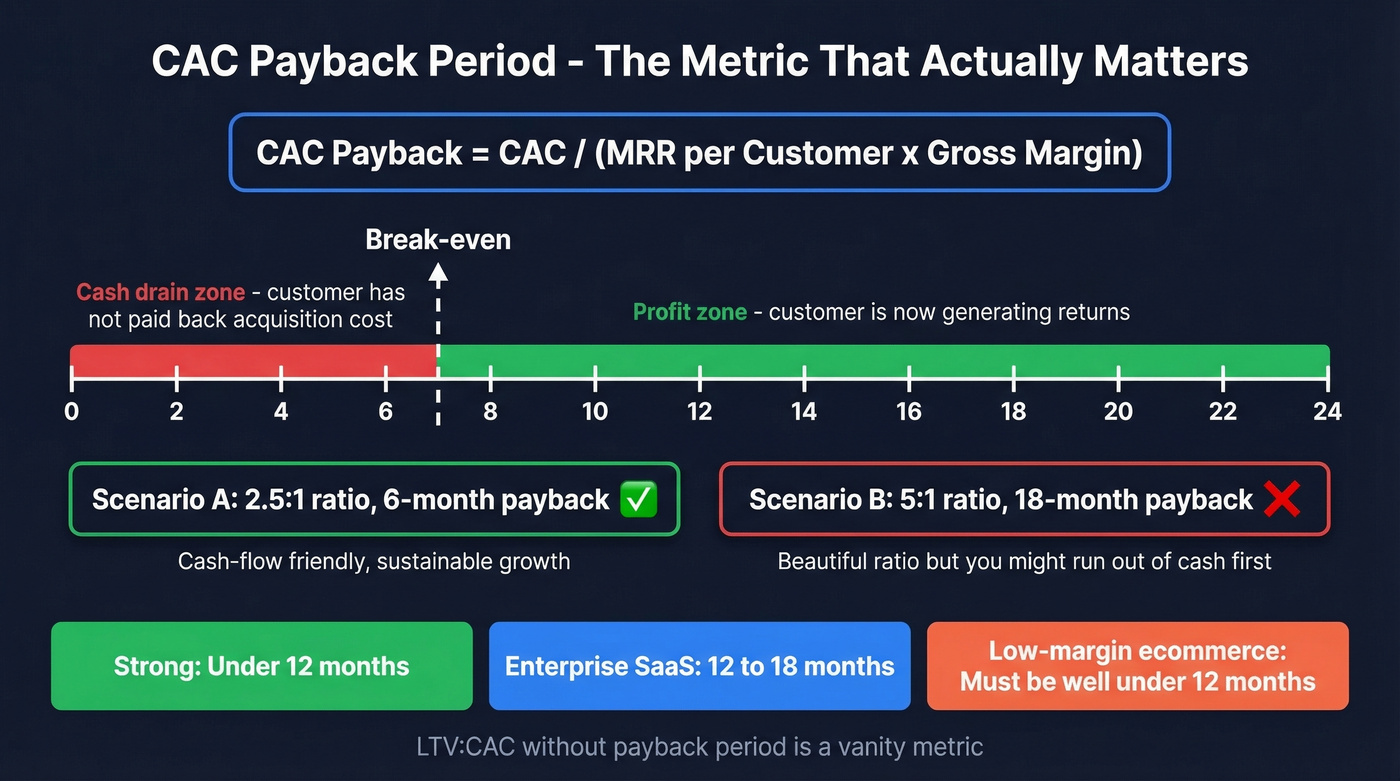
CAC payback period = CAC / (MRR per Customer x Gross Margin)
Payback measures how many months it takes for a customer's revenue to cover their acquisition cost. Until that break-even point, every new customer is a cash drain. As The SaaS CFO frames it, CAC ties up working capital - and longer payback means you need more capital to fund growth.
Benchmarks: under 12 months is strong for most models. Enterprise SaaS can tolerate longer payback, often 12-18 months. Low-margin ecommerce typically needs payback well under 12 months or cash flow becomes a real problem.
LTV:CAC without payback period is a vanity metric. A beautiful ratio means nothing if you run out of cash before customers pay back their acquisition cost.
Common LTV:CAC Mistakes
Five mistakes we see repeatedly - and every one of them makes your ratio lie to you.
1. Calculating too early. LTV:CAC is meaningless pre-product-market-fit. Your early channels - inbound, founder-led sales, warm referrals - are artificially cheap. The ratio compresses hard once you scale into paid acquisition and SDR-led outbound. Don't fool yourself with early data.
2. Counting only ad spend as CAC. The $40 vs $130 problem. Excluding salaries, tools, commissions, and events understates CAC by 2-3x. The consensus on r/startups is clear: CAC includes more than just ad spend, and most founders learn this the hard way.
3. Confusing LTV:CAC with LTGP:CAC. A 3:1 LTV:CAC at 50% gross margin is actually 1.5:1 on a gross-profit basis. These are wildly different numbers that lead to wildly different decisions. Pick one definition, label it clearly, and stick with it.
4. Definition drift. Changing what's included in CAC month-to-month makes trend analysis useless. If you added event costs in March but not February, your "CAC increase" is an artifact, not a signal. Lock the formula in a shared doc so finance and marketing stay aligned.
5. Ignoring payback period. A 5:1 ratio with 24-month payback can bankrupt a company faster than a 2:1 ratio with 4-month payback. Always pair the ratio with payback.
How to Improve Your Ratio
Most teams only pull one or two of these four levers. Pull all four.
Retain longer. Onboarding programs, customer health scores, proactive support. Every extra month of retention compounds LTV. A 5% improvement in retention can increase LTV by 25-95% depending on your margin structure - a finding that's held up since Bain & Company's original research on the economics of loyalty.
Expand accounts. Upsell, cross-sell, add-ons. Net revenue retention above 100% means LTV grows without acquiring new customers. This is the most capital-efficient lever you have. (If you need a clean framework for this lever, see Upsell vs Cross-Sell in SaaS.)
Optimize channels. Content marketing, referral programs, conversion rate optimization. Shift spend toward lower-CAC channels. The First Page Sage data shows organic CAC coming in lower than inorganic in most B2B industries, including SaaS, cybersecurity, and financial services. If you're rebuilding your outbound motion, start with proven sales prospecting techniques and a tighter lead generation workflow.
Fix your data. Your SDR team burns through 500 dials a week, but half the numbers are disconnected. Every dead dial is acquisition cost with zero return. Prospeo's 98% email accuracy cuts wasted outreach cycles and compresses fully loaded CAC - at roughly $0.01 per verified email, it pays for itself if it prevents even a handful of wasted rep hours per month. If you're auditing your stack, compare your SDR tools and consider dedicated email reputation tools to protect deliverability.
Your LTV:CAC ratio is only as honest as your acquisition costs. Teams using stale data burn budget on bounces, kill domain reputation, and watch CAC climb silently. Prospeo refreshes 300M+ profiles every 7 days - not every 6 weeks - so every dollar in your numerator works harder.
Accurate data means fewer wasted touches and a CAC you can defend to your board.
FAQ
What's a good LTV:CAC ratio for startups?
Most investors look for 3:1 or higher. Early-stage companies with fewer than 100 customers shouldn't optimize for this ratio yet - focus on product-market fit first. Once you have a repeatable acquisition process, 3:1 to 5:1 is healthy. Above 5:1 often means you're under-investing in growth.
Should I use revenue or gross profit for LTV?
Either works, but be consistent and label clearly. Revenue-based LTV:CAC uses a 3:1 benchmark. Gross-profit-based LTGP:CAC produces lower numbers - a 3:1 revenue ratio at 50% margin becomes 1.5:1 on gross profit. Most CFOs prefer the gross-profit version for board reporting because it reflects actual dollars available to cover operating costs.
How do enrichment tools affect CAC?
Every prospecting tool - CRM, email finder, intent data platform - is a CAC line item. But accurate tools reduce wasted outreach, which is also CAC. The math is straightforward: if your SDRs spend 30% of their time chasing bad data, that's 30% of their salary contributing to CAC with zero return. Fixing the data source is often the highest-ROI move you can make.
How often should I recalculate LTV:CAC?
Quarterly for most businesses, monthly if you're scaling aggressively or testing new channels. Keep your CAC definition identical each period - definition drift makes trend analysis useless. Lock the formula in a shared doc so finance and marketing stay aligned.