CAC for Ecommerce in 2026: Benchmarks & How to Reduce It
Your Meta CPMs just jumped 20% and your CFO is asking why acquisition costs are up again. You pull up your dashboard and see a $75 blended CAC. Looks fine. But when you filter for new customers only, it's $180. That's the number that matters, and understanding CAC for ecommerce starts with getting that distinction right.
Across First Page Sage's benchmark set, ecommerce customer acquisition cost ranges from $53 to $91 depending on vertical - see the tables below. Your blended CAC is probably lying to you, so filter for new customers only (NCAC). And the fastest lever isn't lowering spend. It's fixing your payback period.
The CAC Formula
CAC = Total Marketing & Sales Spend / New Customers Acquired
"Total spend" means everything: ad spend, agency fees, creative production, tools, salaries of anyone touching acquisition. Most brands only count ad dollars, which makes their CAC look artificially low.
A worked example: you spend $50,000/month across Meta ads ($35K), Google Shopping ($10K), agency retainer ($3K), and creative production ($2K). You acquire 600 new customers. Your CAC is $83.33 - not the $58 your ad platform reports by dividing ad spend alone. That gap between $58 and $83 is where most ecommerce operators fool themselves, and it compounds every month you don't account for it.
2026 Ecommerce CAC Benchmarks
Every CAC benchmark article gives you a single number - "$70 average" - as if a jewelry brand and a food brand have the same economics. They don't.
Benchmarks by Industry
These benchmarks draw from First Page Sage's analysis of 80+ clients across 2020-2025, supplemented with extended ranges from EightX:
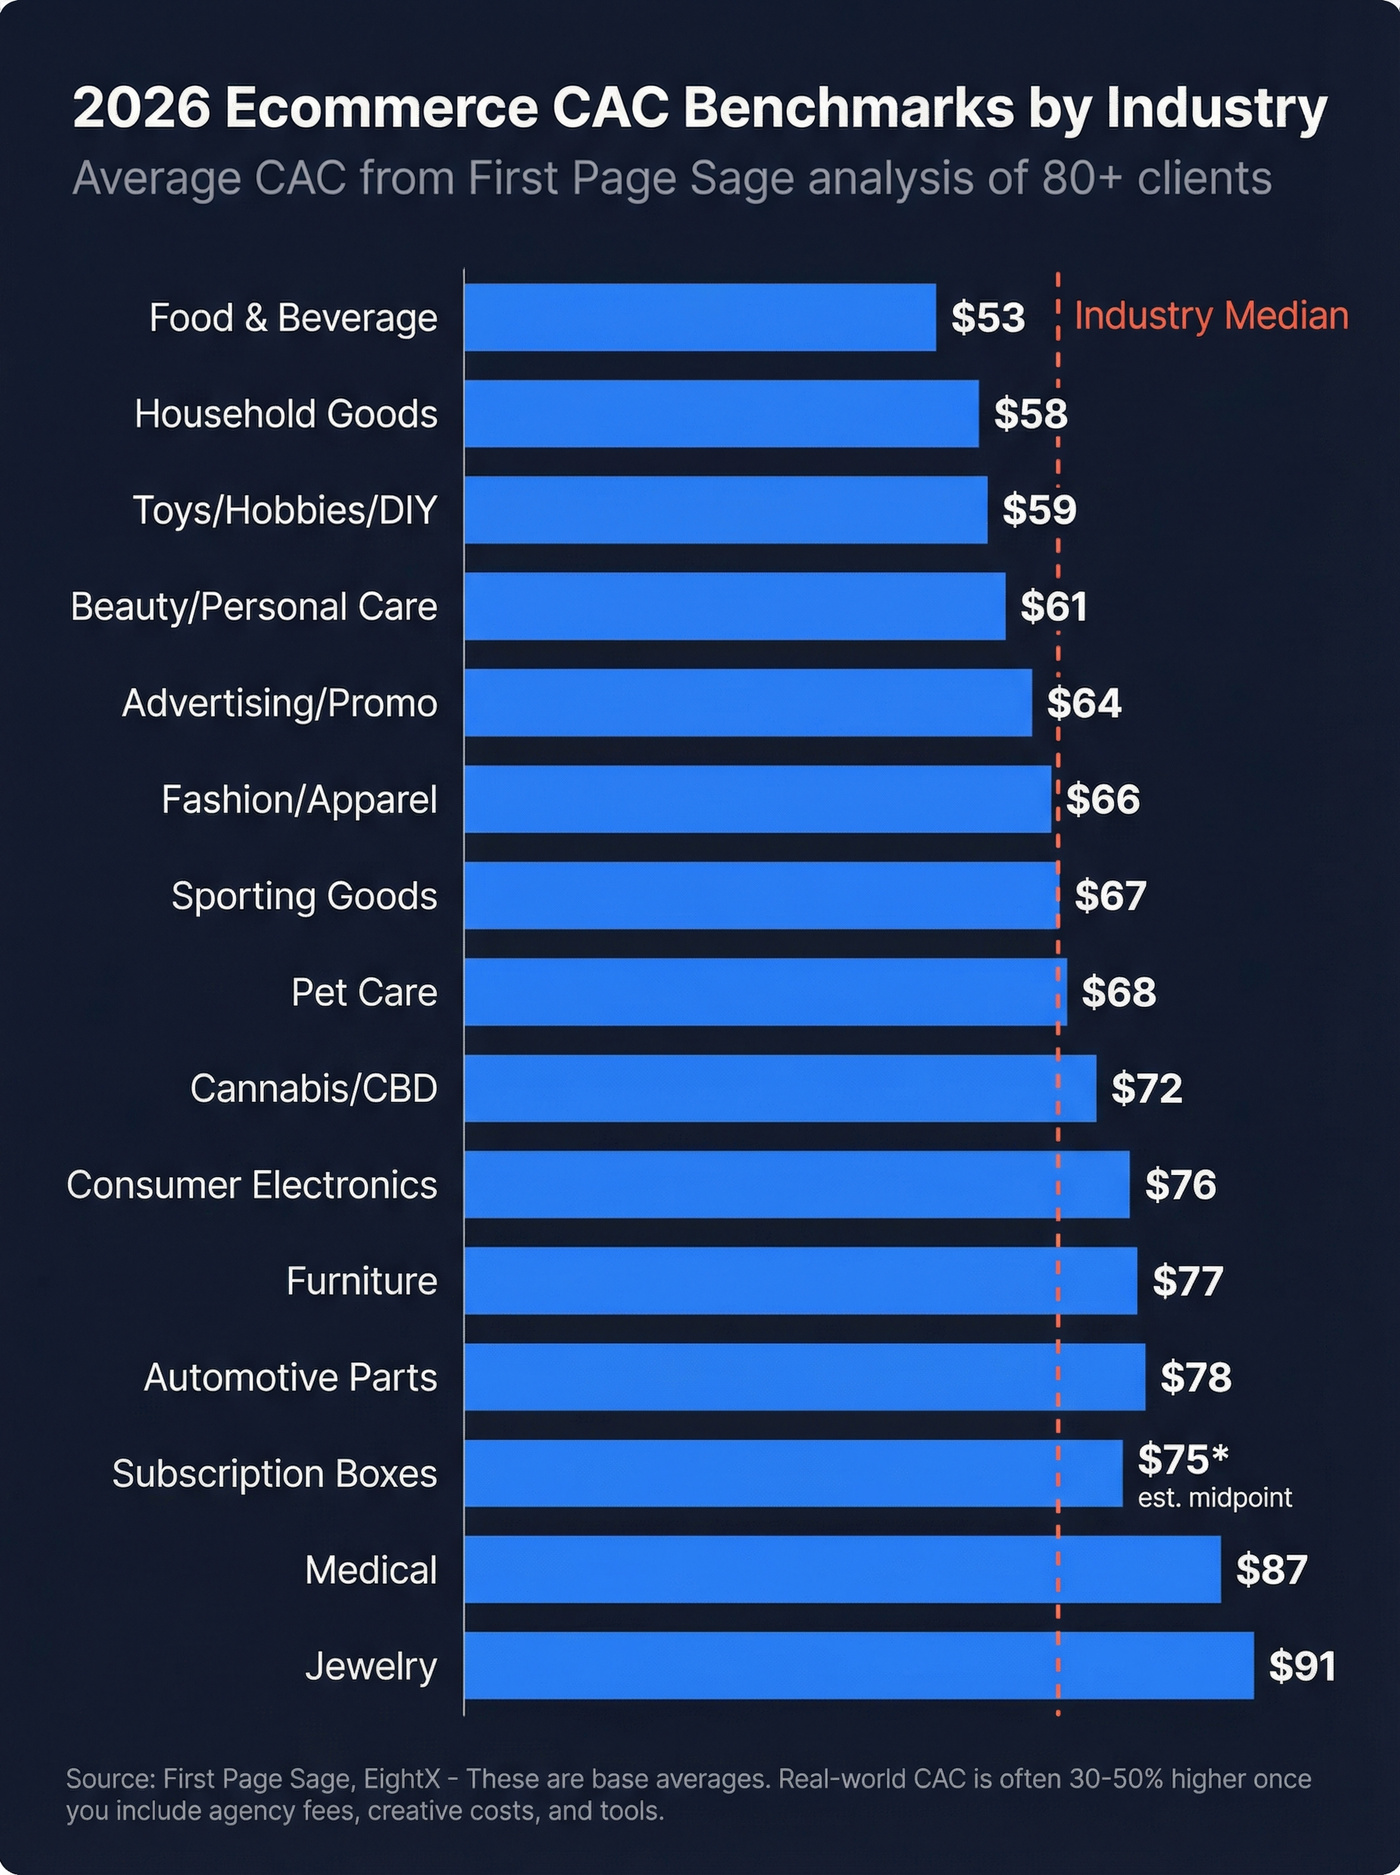
| Industry | Avg CAC | Extended Range |
|---|---|---|
| Food & Beverage | $53 | $53-$100 |
| Household Goods | $58 | $58-$90 |
| Toys/Hobbies/DIY | $59 | $59-$95 |
| Beauty/Personal Care | $61 | $90-$130 |
| Advertising/Promo | $64 | $64-$100 |
| Fashion/Apparel | $66 | $90-$120 |
| Sporting Goods | $67 | $67-$100 |
| Pet Care | $68 | $68-$90 |
| Cannabis/CBD | $72 | $72-$110 |
| Consumer Electronics | $76 | $100-$377+ |
| Furniture | $77 | $77-$120 |
| Automotive Parts | $78 | $78-$115 |
| Subscription Boxes | - | $50-$100 |
| Medical | $87 | $87-$130 |
| Jewelry | $91 | $91-$140 |
The "Avg CAC" figures are the First Page Sage benchmarks. The "Extended Range" column reflects what brands often experience once you factor in creative costs, agency fees, and channel mix - not just ad spend.
Geography matters too. In the US, West Coast brands tend to pay 15-25% higher than average, while the Midwest runs about 10-20% lower. Internationally, Germany's average is about 30% higher than Spain's, and Australia runs 20-35% above the US average.
Benchmarks by Channel
| Channel | Metric | Cost Signal |
|---|---|---|
| Paid Search | CAC | $30-$130 |
| Meta (FB/IG) | CPA (all conversions) | $38.19 avg |
| Meta (FB/IG) | CAC (new customers only) | $212-$230 |
| TikTok | CAC | $90-$129 |
| Referral Programs | CAC | $40-$65 |
| Email/SMS | Marginal CAC | Near-zero |
| Amazon PPC | ACoS | 15-40% |
Here's the critical distinction: the Meta CPA comes from Triple Whale's 35,000-brand dataset and includes repeat purchasers. The Meta CAC from EightX isolates new customers only - and it's about 6x higher. This is exactly the blended-vs-new problem we'll break down next. Email marketing can deliver $36-$45 ROI per $1 spent, which is why it's one of the most efficient channels in the mix.
Why Acquisition Costs Keep Rising
Ecommerce acquisition costs jumped 40-60% between 2023 and 2025. The drivers aren't mysterious - they're structural.
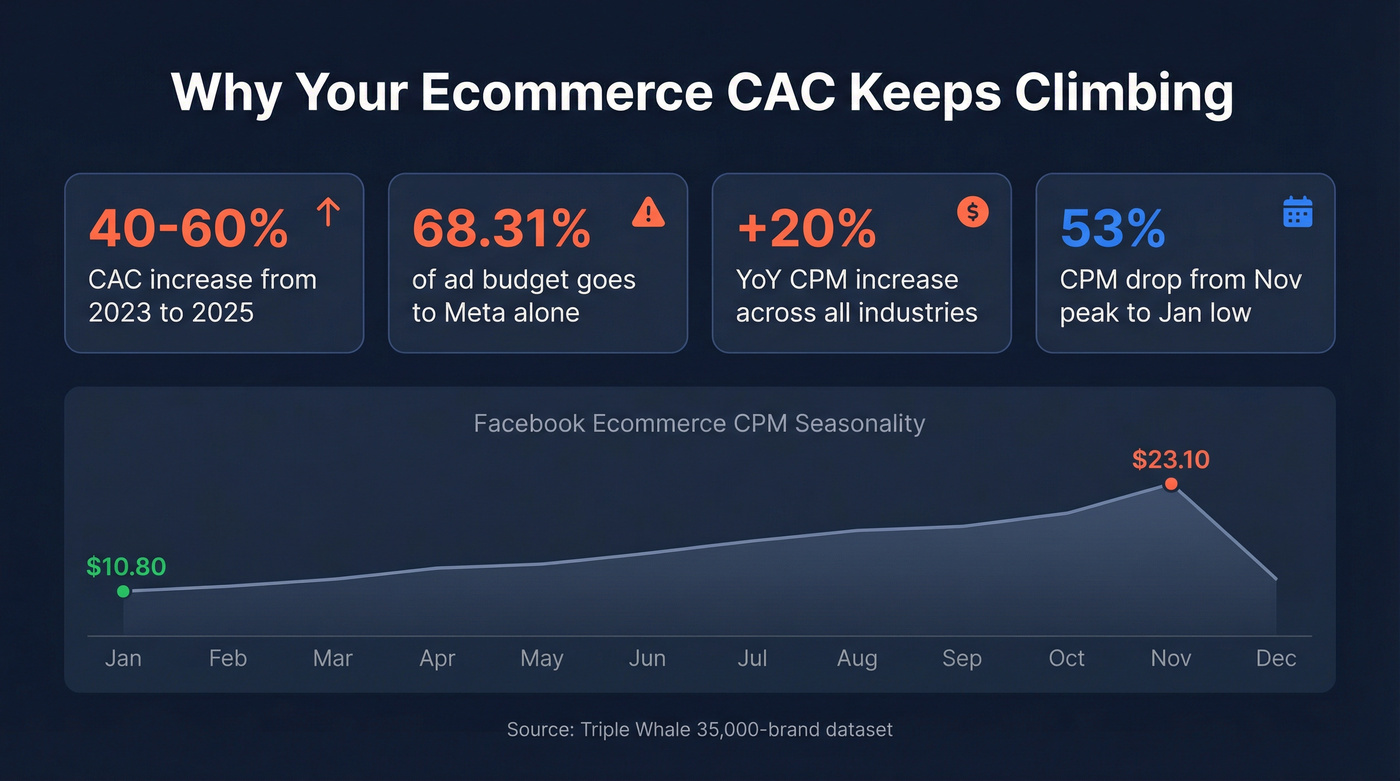
Meta is eating 68.31% of the average brand's ad budget and charging 20% more for it. That's not a strategy. That's a dependency.
Median CPMs rose from $11.82 to $14.19 YoY across Triple Whale's dataset, with every single industry seeing increases. Health & Wellness got hit hardest at +38% CPM inflation. Seasonality makes it worse - Facebook ecommerce CPMs swing from $23.10 in November to $10.80 in January, roughly a 53% drop from the peak. If you're not planning spend around that cycle, you're overpaying for Q4 traffic and under-investing in Q1 when attention is cheapest. Layer on iOS privacy changes eroding attribution accuracy, and you've got a perfect storm: costs up, visibility down.
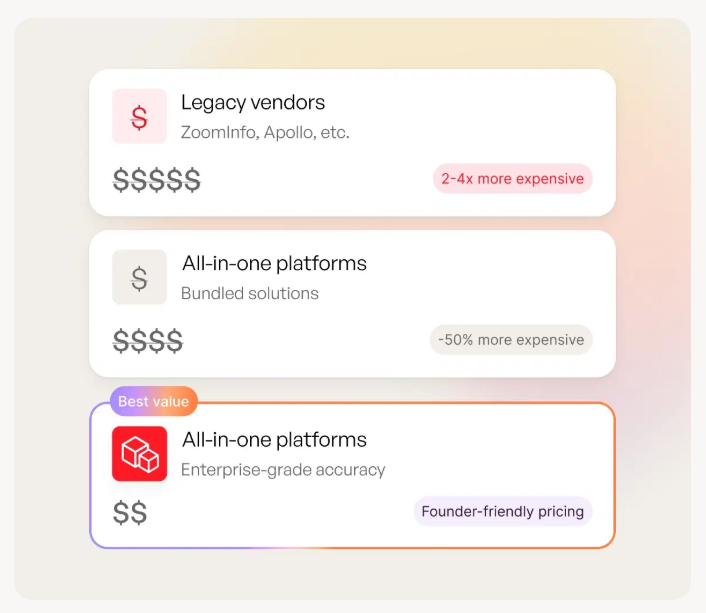
Rising CPMs and shrinking attribution are inflating your CAC. The fix isn't spending less - it's reaching decision-makers directly. Prospeo gives you 300M+ verified contacts at $0.01/email with 98% accuracy, so every dollar goes to real buyers, not bounced emails.
Stop paying $212 per Meta acquisition when direct outreach costs pennies.
The Metric Most Brands Get Wrong
Blended CAC vs. NCAC
Use NCAC when making acquisition decisions. Skip blended CAC for anything strategic.
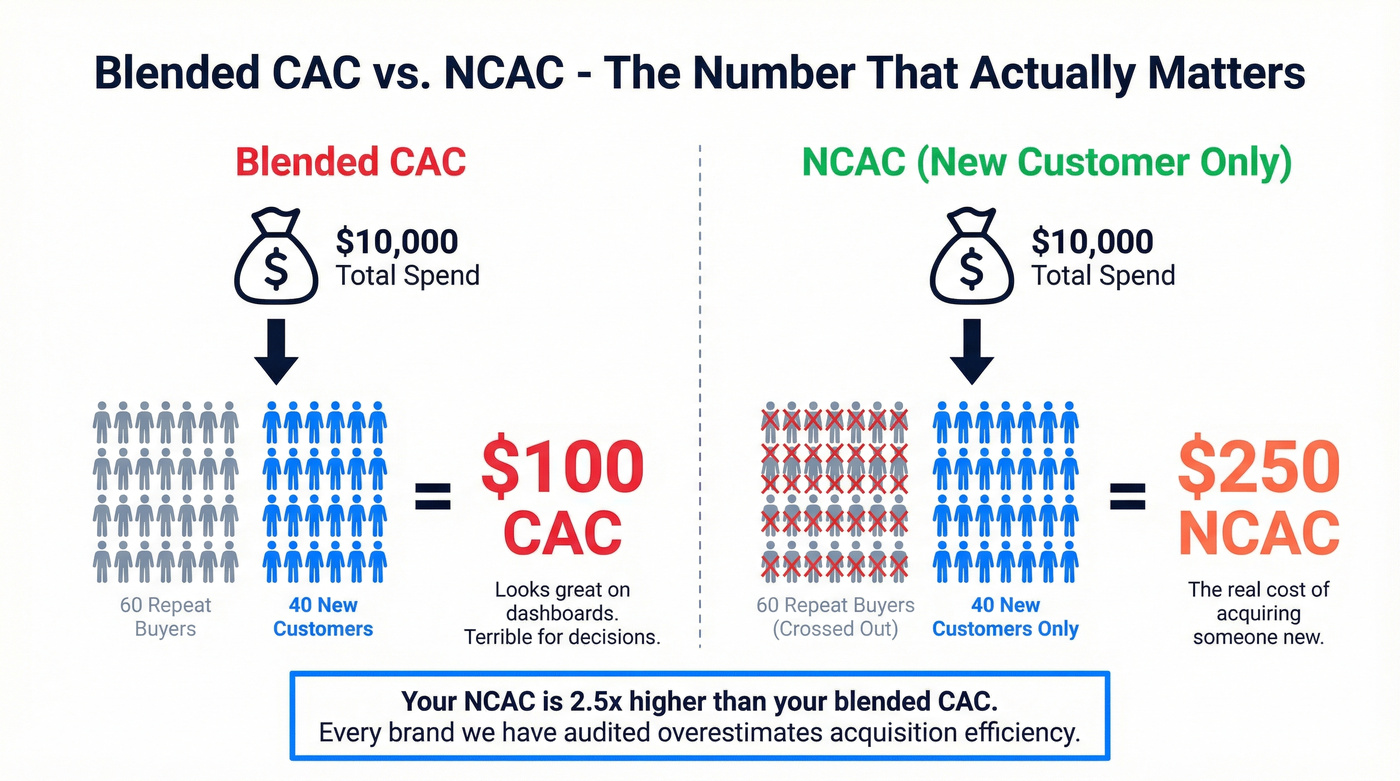
You spend $10,000 and get 100 orders. Your dashboard says $100 CAC. But 60 of those orders are repeat customers who would've bought anyway. Only 40 are new. Your real New Customer Acquisition Cost is $250 - two and a half times what you thought.
NCAC = Total Marketing & Sales Spend / First-Time Buyers Only
Platform-reported conversions mix new and repeat purchasers. Every brand we've audited overestimates acquisition efficiency because of this. Segment your data or you're flying blind.
Three CAC Lenses
Saras Analytics frames it well - you need three views, not one:
- Blended CAC - total spend divided by total customers (new + returning). Good for board decks, bad for decisions.
- Channel CAC - spend per channel divided by new customers from that channel. Essential for budget allocation.
- Cohort CAC - factors in repeat behavior, returns, and discounts over time. The most honest number.
Then there's Acquisition Efficiency: CAC divided by First-Order Contribution Margin. This ties your acquisition cost to actual margin, not just revenue. An $80 CAC on a product with $40 margin is a very different story than $80 on $120 margin.
What's a "Good" CAC?
The standard answer is a 3:1 LTV:CAC ratio. That's a floor, not a target - aim for 4:1 or higher. If your ratio exceeds 5:1, you're probably under-investing in acquisition and leaving growth on the table.
Here's the thing: stop trying to lower your CAC. Fix your payback period instead.
A $120 CAC with 45-day payback beats a $60 CAC with 6-month payback every time, because cash flow is what kills ecommerce brands - not unit economics on a spreadsheet. In our experience, brands that obsess over ratios while ignoring payback period end up cash-strapped by Q3. We've seen it happen to well-funded DTC brands with "great" LTV:CAC numbers that still couldn't make payroll because their money was locked up in a 5-month recovery cycle.
Business model matters enormously. A mattress brand with $1,000 AOV and 50% margin has a $500 ceiling before first-order loss. A subscription box at $30/month needs 3+ months of retention before the acquisition cost pays back - and if churn hits at month two, that "low" $50 CAC is actually a loss. (If you want a deeper framework, see our guide to cost to acquire customer.)
How to Actually Reduce CAC
Six tactical plays that move the number, ranked by impact-to-effort ratio.
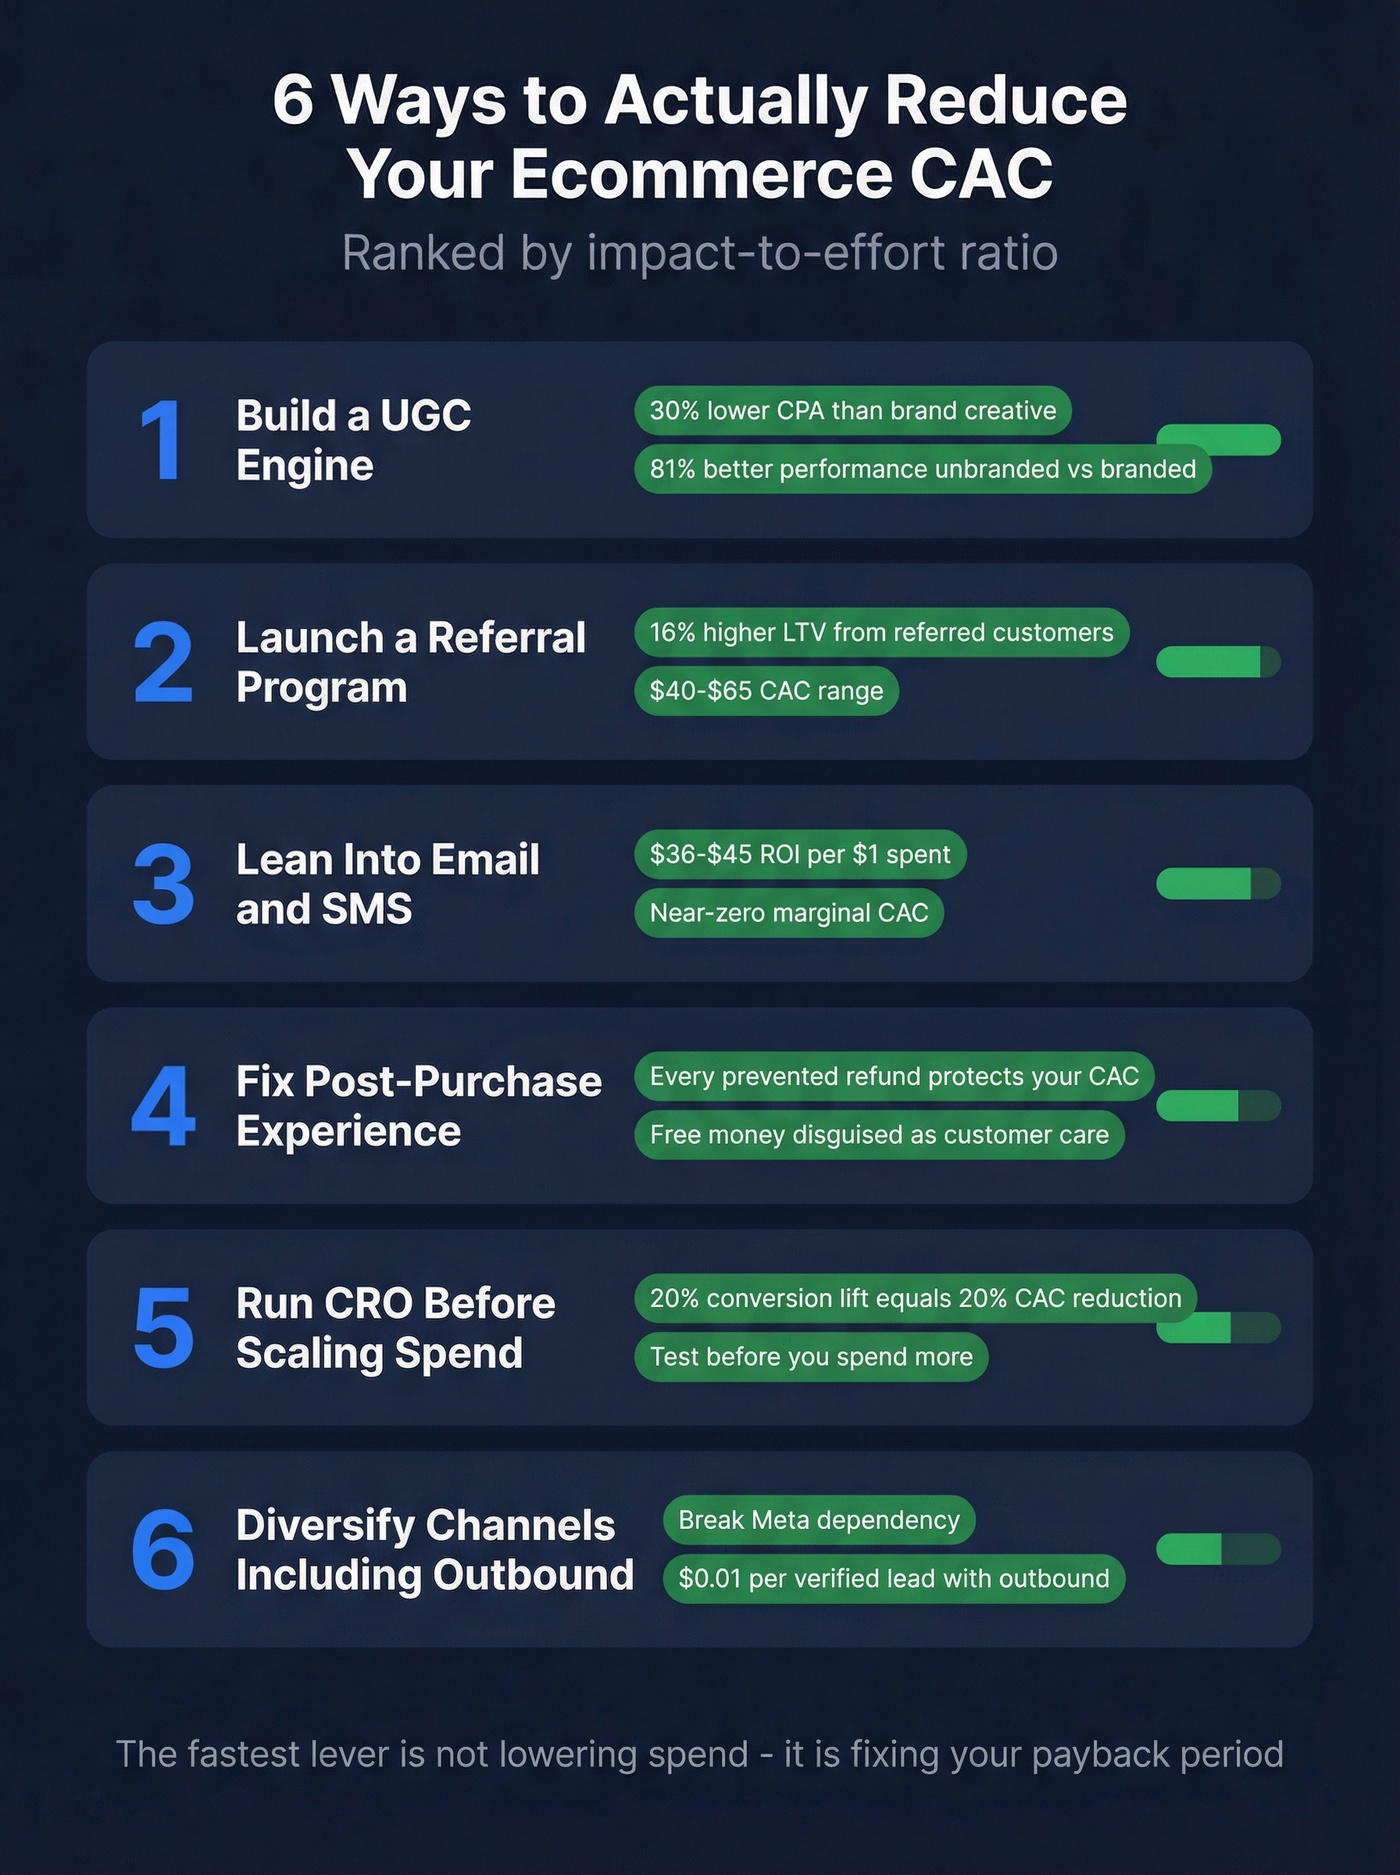
1. Build a UGC engine. Influencer-generated content delivers roughly 30% lower CPA than brand-produced creative, and unbranded UGC outperforms branded content by 81%. This is the single fastest way to improve creative efficiency on paid social. Don't overthink it - even raw iPhone testimonials from real customers outperform polished studio ads in most split tests we've seen.
2. Launch a referral program. Referred customers have 16% higher LTV and are 4x more likely to refer others. Even a simple "give $20, get $20" mechanic compounds quickly. The $40-$65 CAC range for referral programs makes them one of the cheapest acquisition channels available, and the customers they bring in tend to stick around longer than paid-channel acquisitions.
3. Lean hard into email and SMS. Marginal cost per acquisition approaches zero, with $36-$45 ROI per dollar spent. If you're not running abandoned cart, browse abandonment, and win-back flows, you're leaving the cheapest acquisition channel on the table. Skip this if you don't have at least 5,000 email subscribers - build the list first, then optimize the flows.
4. Fix your post-purchase experience. The consensus on r/ecommerce is that brands "lose" LTV right after checkout through poor onboarding, buyer's remorse, and preventable refunds. Post-purchase education flows are free money disguised as customer care. Every refund you prevent protects the acquisition cost you already paid.
5. Run CRO before scaling spend. A 20% conversion rate improvement on your landing pages has the same effect as a 20% CAC reduction - without touching your ad budget. Personalized landing pages and product recommendations alone can lift conversion rates 10-15%. Test pricing pages, checkout flows, and product pages before throwing more money at Meta. And before scaling any channel, run geo-holdout tests to measure true incrementality - not just platform-reported conversions. (If you need a KPI stack, start with funnel metrics.)
6. Diversify channels - including outbound. DTC operators on Reddit are actively hunting for alternatives to Meta and TikTok dependency. For brands with any B2B component - wholesale, retail partnerships, influencer outreach - bad contact data silently inflates acquisition costs. Every bounced email is a wasted touch. Tools like Prospeo find verified emails from 300M+ professional profiles at roughly $0.01/lead with 98% accuracy, so outbound touches actually reach someone. If your acquisition mix includes any outreach beyond paid ads, data quality is the invisible lever most brands ignore. (For more options, compare outbound lead generation tools and data enrichment services.)

Channel diversification is the fastest way to break your Meta dependency and lower blended CAC. Prospeo's B2B database with 30+ filters - including buyer intent, technographics, and headcount growth - lets you build hyper-targeted outbound lists that convert at a fraction of paid social costs.
Brands using Prospeo book 35% more meetings than Apollo users. Same team, better data.
FAQ
What's a good CAC for ecommerce?
Across First Page Sage's benchmark set, averages range from $53 to $91 depending on vertical. Target a 3:1 to 4:1 LTV:CAC ratio as a baseline, but prioritize payback period - recouping acquisition costs within 90 days matters more than the ratio itself.
What's the difference between CAC and CPA?
CPA measures the cost of any conversion, including repeat purchases. CAC isolates new customers only. Your CPA will always look lower because it blends new and returning buyers - most dashboards default to CPA reporting, which masks true acquisition costs.
How do I calculate CAC for new customers only?
Divide total marketing and sales spend by first-time buyers only. If you spent $10,000 and got 100 orders but only 40 were new, your NCAC is $250 - not the $100 your dashboard shows. Use a customer data platform or tag first-purchase events in your analytics to segment accurately.
How can I lower ecommerce CAC without cutting ad spend?
Focus on conversion rate optimization and channel diversification first. A 20% lift in landing page conversion has the same effect as a 20% reduction in acquisition cost. Layer in referral programs ($40-$65 CAC) and email/SMS flows (near-zero marginal cost) to shift your channel mix away from paid-social dependency.