CAC SaaS: The Data-Driven Guide for 2026
SaaS customer acquisition costs have increased 60% over the past five years. That's not a rounding error - it's a structural shift. A common refrain on r/SaaS captures it well: "Google Ads is a rich person's game." The numbers agree. The median SaaS company now spends $2.00 to acquire $1 of new ARR, up 14% from the prior year. If you're not calculating CAC correctly and benchmarking against the right numbers, you're flying blind with an increasingly expensive engine.
The Short Version
- Your CAC formula is probably wrong. Use fully-loaded costs - salaries, commissions, overhead, software - and gross-margin-adjusted payback. Not the oversimplified CAC / MRR shortcut.
- Stop benchmarking against "CAC payback period under 12 months." CAC payback period under 12 months is the metric that actually drives operating decisions. LTV:CAC is an investor slide, not an operating dashboard.
- The fastest CAC lever most teams ignore: data quality. If 15% of your outbound list bounces, that's 15% of your sales budget producing zero customers. Fix the inputs before optimizing the funnel.
What Is Customer Acquisition Cost?
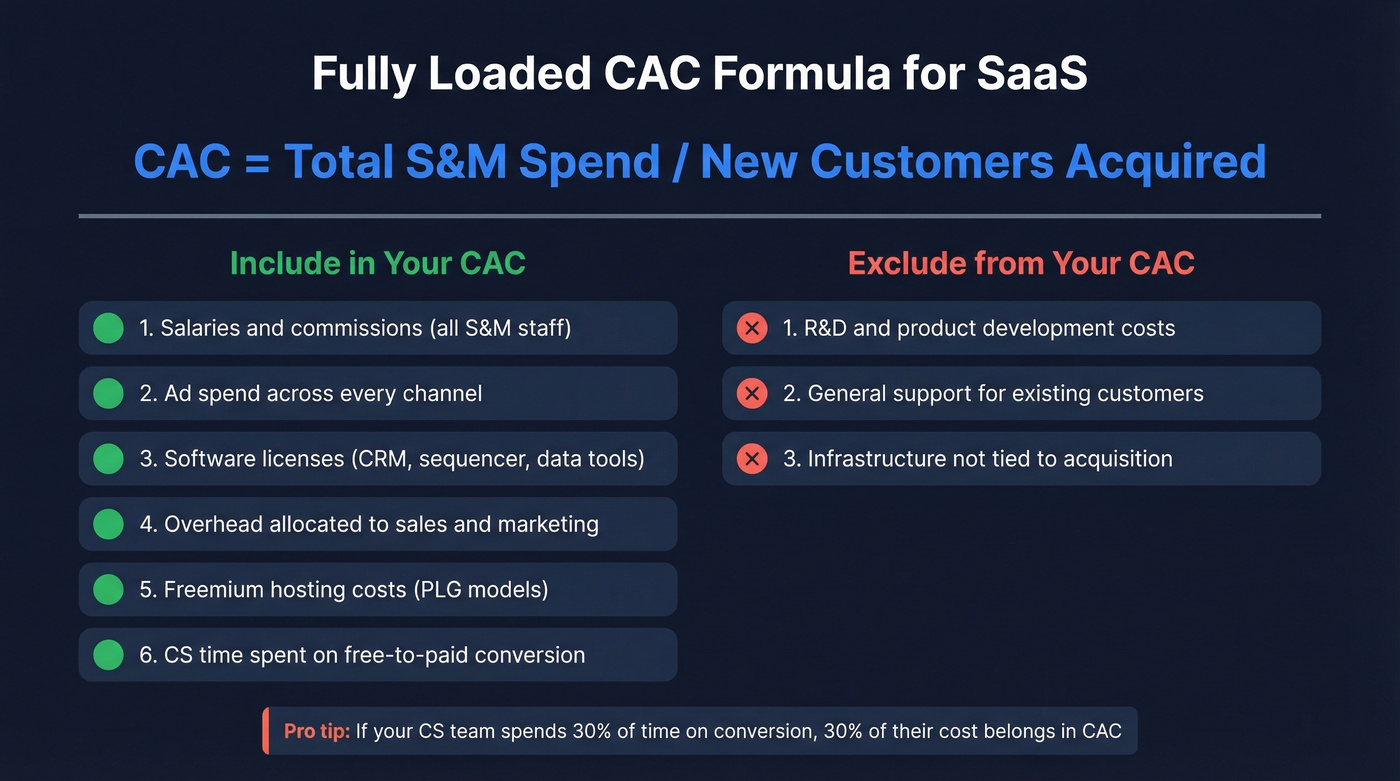
Customer acquisition cost is the total sales and marketing spend required to acquire one new customer. The basic formula:
CAC = Total Sales & Marketing Spend / Number of New Customers Acquired
What makes this metric different for subscription businesses is the revenue structure. You don't recoup your acquisition investment in a single transaction - you earn it back over months or years of recurring revenue. A $1,500 CAC on a $100/mo product isn't inherently bad or good until you know how long that customer sticks around and what margin you earn on each dollar.
The number in isolation is almost useless. It only becomes meaningful when paired with payback period, gross margin, and retention.
How to Calculate CAC for SaaS
Most teams undercount their acquisition cost. They divide ad spend by new customers and call it a day, which produces an artificially low number that leads to bad budgeting and overconfident growth plans.
What to Include
A fully-loaded CAC calculation includes everything that touches acquisition:
- Salaries and commissions for all sales and marketing staff - yes, the marketing ops person too
- Advertising and campaign spend across every channel
- Software licenses for your CRM, sequencer, data tools, and analytics stack
- Overhead allocated to S&M: office space, utilities, equipment
- Freemium hosting costs - if you run a PLG model, the infrastructure serving free users is an acquisition cost
- Customer success effort spent converting free users to paid, when CS is part of the conversion motion
That last one catches people off guard. If your CS team spends 30% of their time on free-to-paid conversion, 30% of their cost belongs in your CAC numerator.
What to Exclude
R&D costs, general customer support for existing accounts, and infrastructure not tied to acquisition don't belong in the calculation. Including them inflates the number and muddies your channel-level analysis. Also, align your measurement window to your actual sales cycle - if enterprise deals take 90 days to close, measuring monthly will whipsaw between artificially high and low numbers.
Blended vs. New vs. Expansion
Blended CAC - all S&M spend divided by all new customers - is the most common calculation, but it hides important dynamics. Expansion revenue from existing customers is cheaper to generate than net-new logos. Lumping them together makes your cost of acquisition look better than your actual cost to acquire a stranger.
Track three numbers: blended, new-logo, and expansion. New-logo CAC matters most for growth planning. Expansion tells you how efficiently your install base compounds.
Real-World Example
A SaaS founder shared their 16-month acquisition data on r/SaaS - and the contrast between channels is striking.
| Channel | Spend | Customers | CAC | Avg Lifetime | Payback (pre-margin) |
|---|---|---|---|---|---|
| Paid | $44,640 | 96 | $465 | 10 months | 6.4 months |
| Organic | $1,180 | 142 | $8.31 | 13 months | ~0 months |
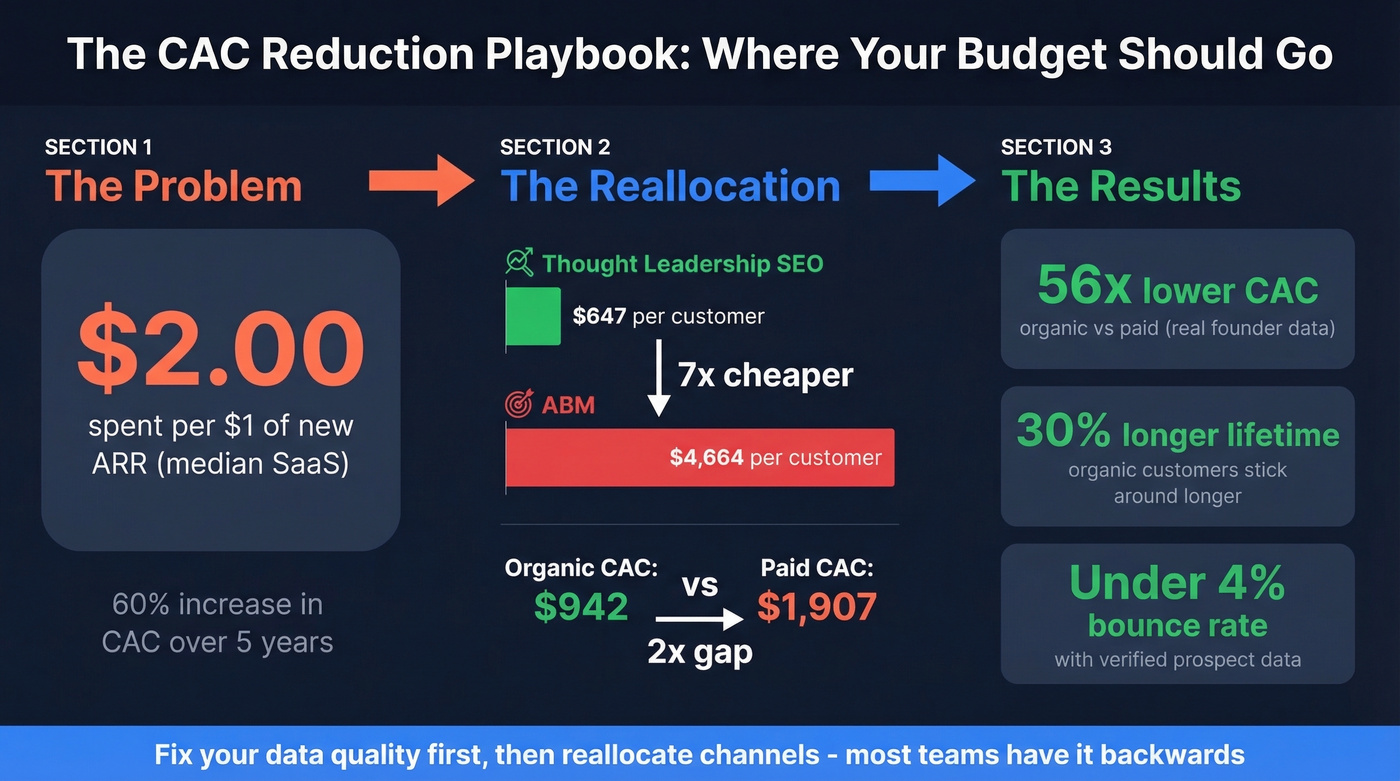
The organic channel produced more customers, at 56x lower cost, with roughly 30% longer average lifetime. We've seen this pattern repeatedly: organic channels take longer to build but produce structurally better unit economics. The founder's tactics were straightforward - comparison content, buyer-intent keywords, and email nurture sequences. Nothing exotic. Just consistent execution on the right channels.
That 15% bounce rate isn't just wasted sends - it's 15% of your sales budget producing zero customers, inflating your CAC with every campaign. Prospeo's 98% email accuracy and 7-day data refresh cut bounce rates below 4%, so every dollar you spend on outbound actually reaches a real buyer.
Stop paying to acquire bounces. Pay $0.01 per verified email instead.
SaaS CAC Benchmarks for 2026
Averages are useful as guardrails, not gospel. Your acquisition cost depends on your ICP, your channels, and your sales motion. But you need a reference point.
By Industry and Segment
These benchmarks come from First Page Sage's benchmark report based on client data from 2019-2024:
| Industry | SMB | Mid-Market | Enterprise |
|---|---|---|---|
| Fintech | $1,461 | $4,923 | $14,774 |
| Security | $833 | $5,330 | $10,226 |
| eCommerce | $299 | $1,407 | $2,206 |
| Legaltech | $321 | $2,652 | $6,477 |
| Telecom | $708 | $5,278 | $10,983 |
The efficiency gap between top and bottom performers is massive: top-quartile SaaS companies spend $1.00 to acquire $1 of new ARR, while bottom-quartile companies spend $2.82. Same market, nearly 3x the cost. That gap is almost entirely explained by channel mix, conversion rates, and data quality - not product or pricing.
By Acquisition Channel
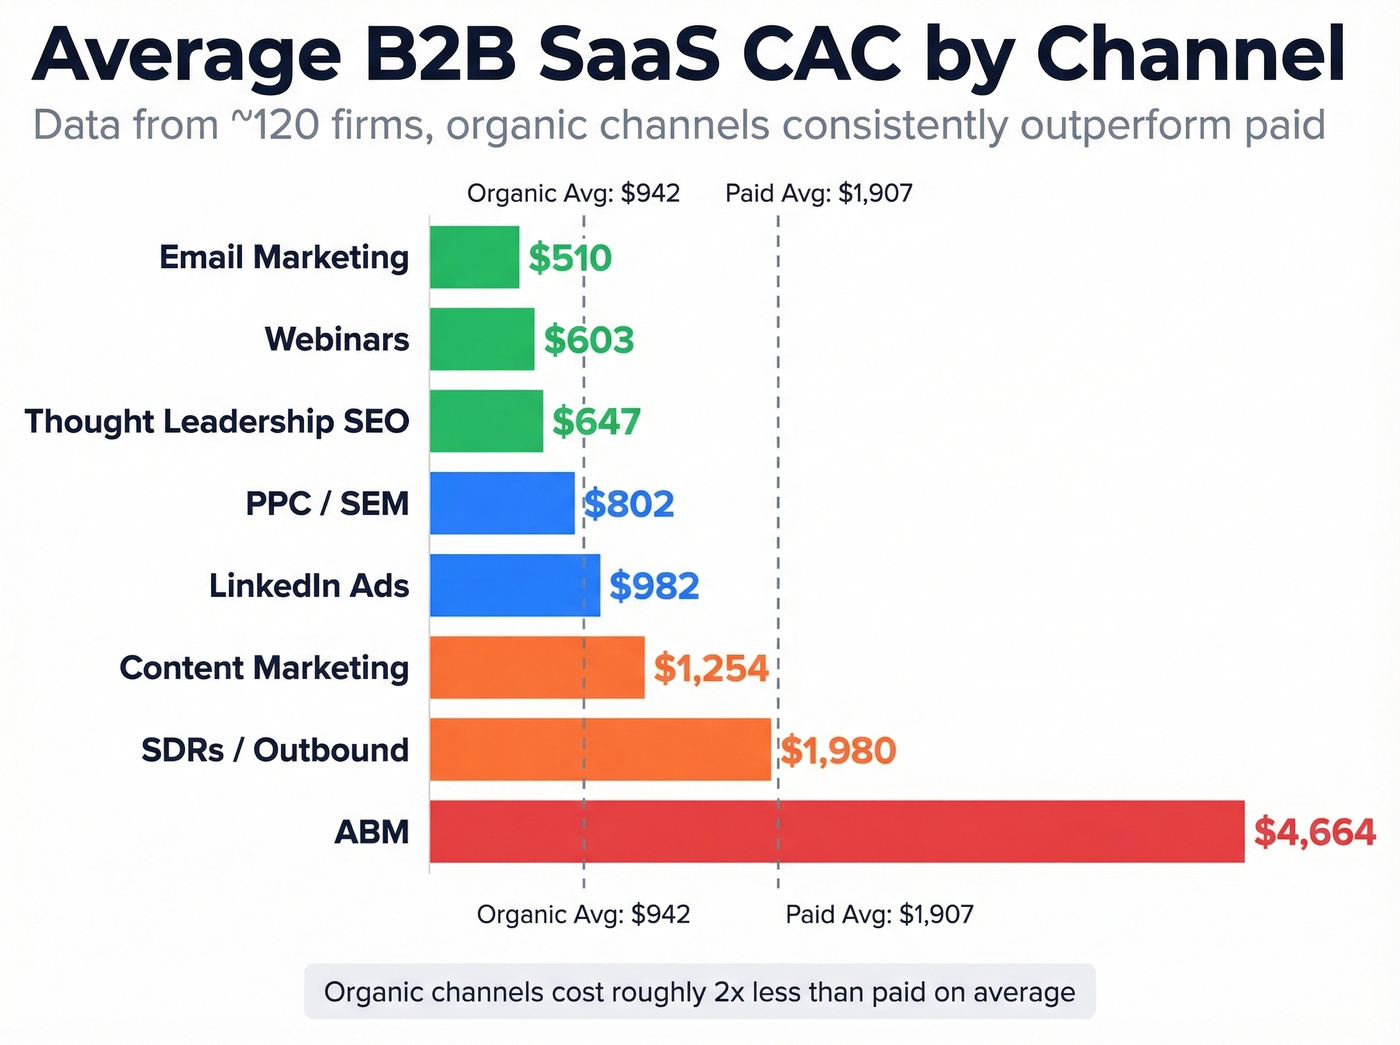
Not all channels are created equal. Channel-level data from roughly 120 firms shows dramatic differences:
| Channel | Avg B2B CAC |
|---|---|
| Email Marketing | $510 |
| Webinars | $603 |
| Thought Leadership SEO | $647 |
| PPC / SEM | $802 |
| LinkedIn Ads | $982 |
| Content Marketing | $1,254 |
| SDRs / Outbound | $1,980 |
| ABM | $4,664 |
The average organic B2B CAC runs $942 versus $1,907 for paid - roughly 2x the cost. Content marketing here includes non-SEO content like case studies, whitepapers, and gated assets with higher production costs and lower organic distribution, which explains the gap with thought leadership SEO.
ABM at $4,664 isn't inherently bad if you're closing six-figure enterprise deals. But for teams selling sub-$20k contracts? It's a disaster.
Here's the thing: if your average deal size is under $15k, you probably shouldn't be running account-based selling or heavy outbound motions at all. The math doesn't work. Invest that budget in SEO and email - channels where the unit economics actually compound over time.
CAC Payback Period (Done Right)
CAC payback is the metric that actually drives operating decisions. It answers one question: how many months until a customer pays back their acquisition cost?
Most teams use the wrong formula.
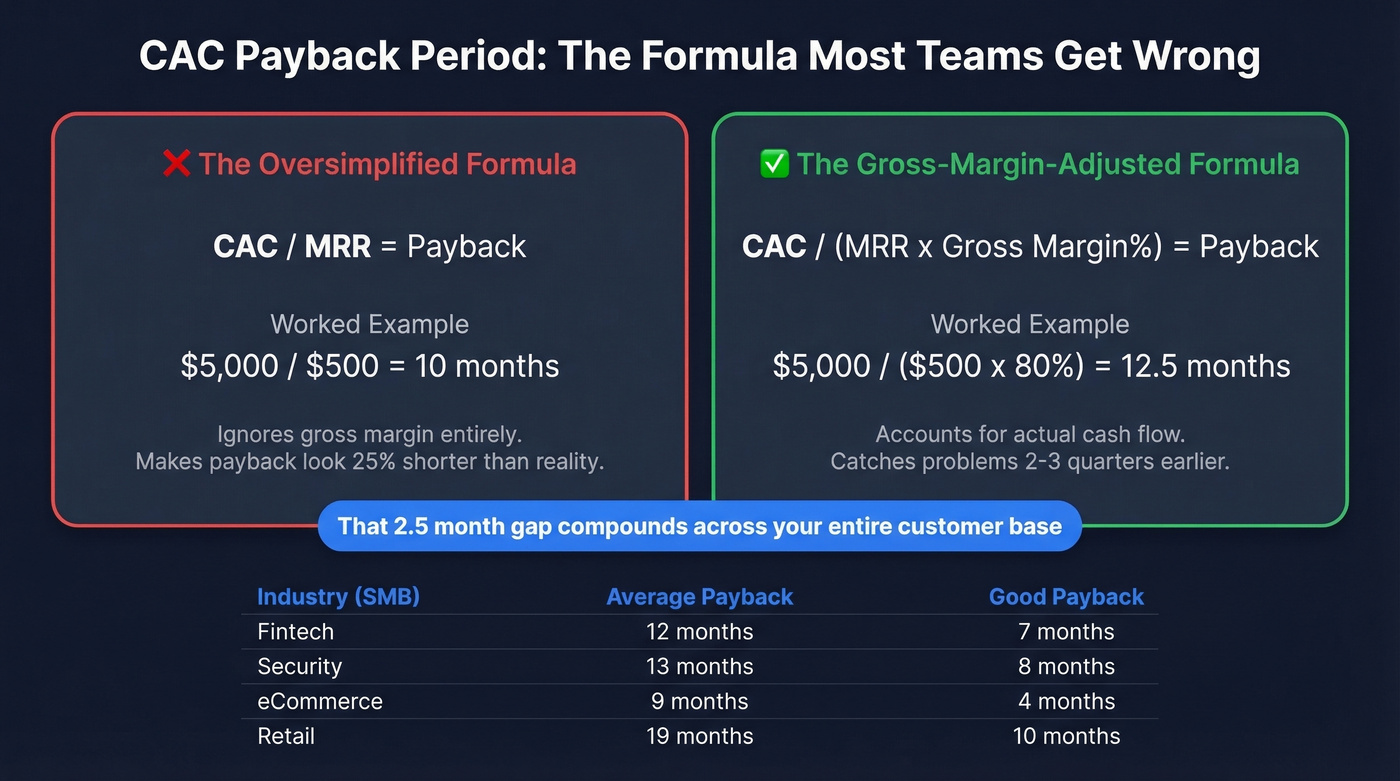
Oversimplified (wrong): CAC / MRR = Payback Months
Gross-margin-adjusted (right): CAC / (MRR x Gross Margin %) = Payback Months
The difference matters more than you'd think. Take a $5,000 acquisition cost, $500 MRR, and 80% gross margin. The simple formula says 10 months. The correct formula says 12.5 months. That 25% gap compounds across your entire customer base, and in our experience, teams that switch to gross-margin-adjusted payback catch cash-flow problems two to three quarters earlier than those using the simplified version.
Payback benchmarks from First Page Sage:
| Industry (SMB) | Average | Good |
|---|---|---|
| Fintech | 12 months | 7 months |
| Security | 13 months | 8 months |
| eCommerce | 9 months | 4 months |
| Retail | 19 months | 10 months |
If your SMB payback is under 12 months, you're in solid shape. Under 7 months and you're top tier. Enterprise payback naturally runs longer - 18-31 months is typical.
Why the 3:1 LTV:CAC Rule Is Overrated
Every pitch deck has a "3:1 LTV:CAC" slide. Most of them are misleading.
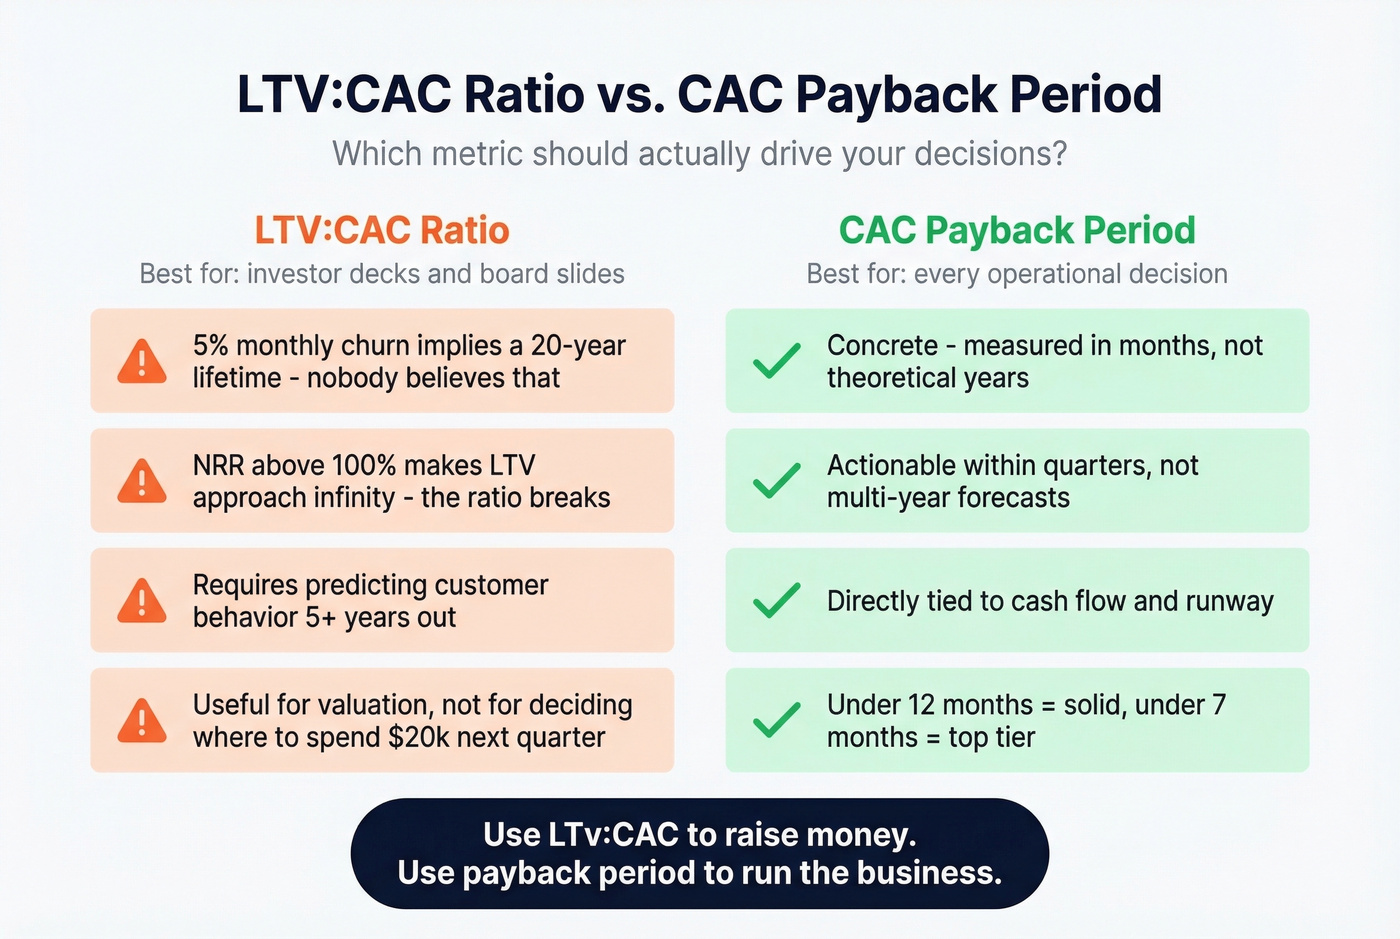
LTV calculations based on churn rates imply absurdly long time horizons. A 5% monthly churn rate implies a 20-year customer lifetime. Nobody's forecasting 20 years with a straight face. And if your NRR exceeds 100% - meaning existing customers expand faster than they churn - your naive LTV approaches infinity. The ratio becomes meaningless.
Even a16z's analysis across 60+ public consumer internet companies shows that improving LTV:CAC from 2x to 3x can nearly triple valuation. That's useful for investors evaluating public equities. It's not useful for a RevOps lead deciding whether to shift $20k from LinkedIn Ads to SEO content.
Let's be honest: use LTV:CAC for investor conversations and board decks. Use CAC payback period for every operational decision. Payback is concrete, measurable within quarters, and doesn't require you to predict customer behavior five years from now.
How to Reduce CAC in SaaS
Reducing acquisition cost isn't about cutting spend. It's about reallocating it and eliminating waste.
Reallocate Channel Spend
The data is clear: thought leadership SEO at $647 per customer is 7x cheaper than ABM at $4,664. If you're running a heavy paid mix and your payback exceeds 15 months, the first move is shifting budget toward organic channels. Yes, SEO takes 6-12 months to compound. But the Reddit founder data above shows what happens when it does - 56x lower cost and roughly 30% longer average lifetime.
Look at your channel-level numbers, not just blended. Most teams we've worked with discover that one or two channels are subsidizing the rest.
Fix Your Prospect Data
Here's what most guides won't tell you: your SDR team sent 5,000 emails last month and 800 bounced. That's 16% of your outbound budget producing zero pipeline - and it's actively damaging your domain reputation, which makes the next 5,000 emails perform even worse. Bad prospect data is a hidden cost multiplier that doesn't show up in any dashboard until you look for it.

Cleaning your list before sending often cuts bounce rates to under 4%, and that directly reduces your numerator. One of our customers, Snyk, had 50 AEs prospecting 4-6 hours per week with bounce rates between 35-40%. After switching to verified data with a 7-day refresh cycle, their bounce rate dropped below 5% and AE-sourced pipeline jumped 180%. That's the kind of CAC reduction that doesn't require a single dollar of new spend.
Invest in PLG and Referrals
Product-led growth structurally reduces acquisition cost by letting the product do the selling. Free tiers, self-serve onboarding, and in-app upgrade prompts replace expensive sales touches with automated conversion paths.
Referral programs are the most underused lever in SaaS. A referred customer has near-zero acquisition cost and typically higher retention. If you don't have a referral program, that's the easiest win on this list. Skip the complex incentive structures - even a simple "give $50, get $50" credit program outperforms having nothing at all.
The gap between top-quartile ($1.00 per $1 ARR) and bottom-quartile ($2.82) CAC comes down to conversion rates, channel mix, and data quality. Prospeo gives you 300M+ verified profiles with 30+ filters - buyer intent, technographics, funding, headcount growth - so your outbound hits decision-makers, not dead ends.
Teams using Prospeo book 35% more meetings than Apollo users. Same budget, better CAC.
FAQ
What is a good CAC for SaaS companies?
SMB averages range from $800-$1,500, mid-market $2,500-$5,500, and enterprise $10,000+. The better benchmark is CAC payback period - under 12 months is solid, under 7 months is top-quartile across most verticals.
What costs should I include in the calculation?
Include all sales and marketing salaries, commissions, ad spend, software tools, and allocated overhead. Exclude R&D, general support, and non-acquisition infrastructure to keep the number actionable.
Is the 3:1 LTV:CAC ratio still relevant in 2026?
It's a rough investor heuristic, not an operating metric. LTV calculations based on churn imply unrealistic 10-20 year time horizons. Use gross-margin-adjusted CAC payback period for day-to-day decisions - it's measurable within quarters and doesn't require long-range forecasting.
How can I lower acquisition costs without cutting budget?
Shift spend to lower-cost channels like SEO ($647 avg) and email ($510 avg), improve funnel conversion rates, and verify prospect data before sending. Eliminating bounced-email waste alone can reduce your effective outbound CAC by 15-20%.