Common Sales Metrics: What to Track, What to Skip, and What "Good" Looks Like
84% of reps missed quota last year, per Salesforce data cited in Kondo's benchmark report. Ebsta and Pavilion's analysis put it at 69% falling short. The gap between those numbers is interesting, but the takeaway is identical: most sales teams are underperforming, and most of them are measuring the wrong things. They're tracking common sales metrics that look good on a slide but don't drive action. The teams that consistently hit their numbers don't track more metrics - they track fewer, better ones.
Start Here: Five Metrics That Move the Needle
If you're building a sales dashboard from scratch, begin with win rate, pipeline coverage, CAC, average sales cycle length, and lead response time. For SaaS teams, add NRR and LTV:CAC. Everything else is a layer on top. The rest of this article gives you formulas, benchmarks, and the role-by-role breakdown - plus the one upstream problem that silently wrecks every metric on the list.
Metrics vs. KPIs: Leading vs. Lagging
Sales metrics and sales KPIs aren't the same thing, even though most teams use the terms interchangeably. NetSuite frames it well: metrics show what's happening; KPIs show what matters. Every KPI is a metric, but not every metric deserves a spot on your reporting. If you're tracking 30 numbers, you're acting on none of them.
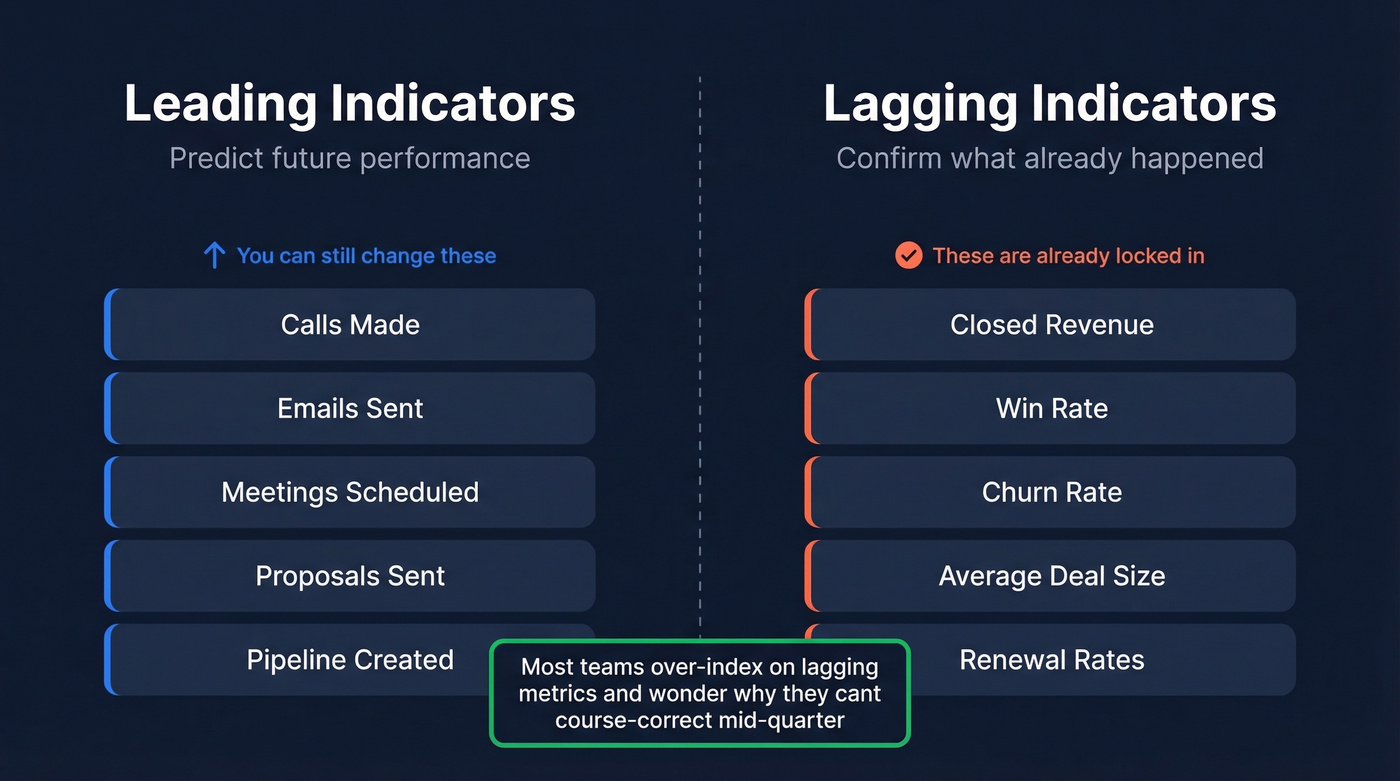
The more useful distinction is leading vs. lagging. Leading indicators - calls made, demos booked, pipeline created - predict future performance. Lagging indicators - revenue, win rate, churn - confirm what already happened. You need both, but most teams over-index on lagging metrics and then wonder why they can't course-correct mid-quarter.
- Leading (predictive): calls, emails, meetings scheduled, proposals sent, pipeline created
- Lagging (confirmatory): closed revenue, win rate, churn rate, average deal size, renewal rates
It takes roughly 8 touches to make a real connection with a prospect. If your reps are averaging 3 touches before moving on, you don't need to wait for the lagging data to know the quarter's in trouble.
Sales Metrics That Actually Matter
Revenue Metrics
Three numbers anchor every revenue conversation: ARR (annual recurring revenue), MRR (monthly recurring revenue), and average deal size. ARR is the annualized value of your recurring contracts. MRR is the monthly slice. Average deal size tells you whether you're moving upmarket or down - and when tracked alongside volume, it reveals whether pricing changes or segment shifts are actually landing.
Median SaaS revenue growth has dropped to around 26% in 2026, down from 47% in 2024. If your growth rate is above that median, you're outperforming. If it's below, the metrics in the next few sections will tell you where the leak is.
Pipeline Metrics
Pipeline coverage is the ratio of total pipeline value to your quota target. The standard benchmark is 3x coverage - meaning $3M in pipeline for every $1M in quota. Here's the thing: a $3M pipeline full of stale, unqualified deals is worse than a $1.5M pipeline of deals that are actively progressing.
We've seen teams celebrate a Monday-morning pipeline report showing 4x coverage, only to miss the quarter by 30%. The deals were aging, stages were inflated, and half the "opportunities" hadn't had a real exchange in weeks. Track pipeline velocity, deal aging, and slippage alongside raw coverage. These tell you whether your pipeline is real or just a comforting fiction.
Buying committees now average 13 decision-makers, which partly explains why Ebsta's benchmarks show sales cycles lengthened 38% vs. 2021 before stabilizing. More people means more friction, longer timelines, and more deals that stall in mid-stage limbo.
Conversion Metrics
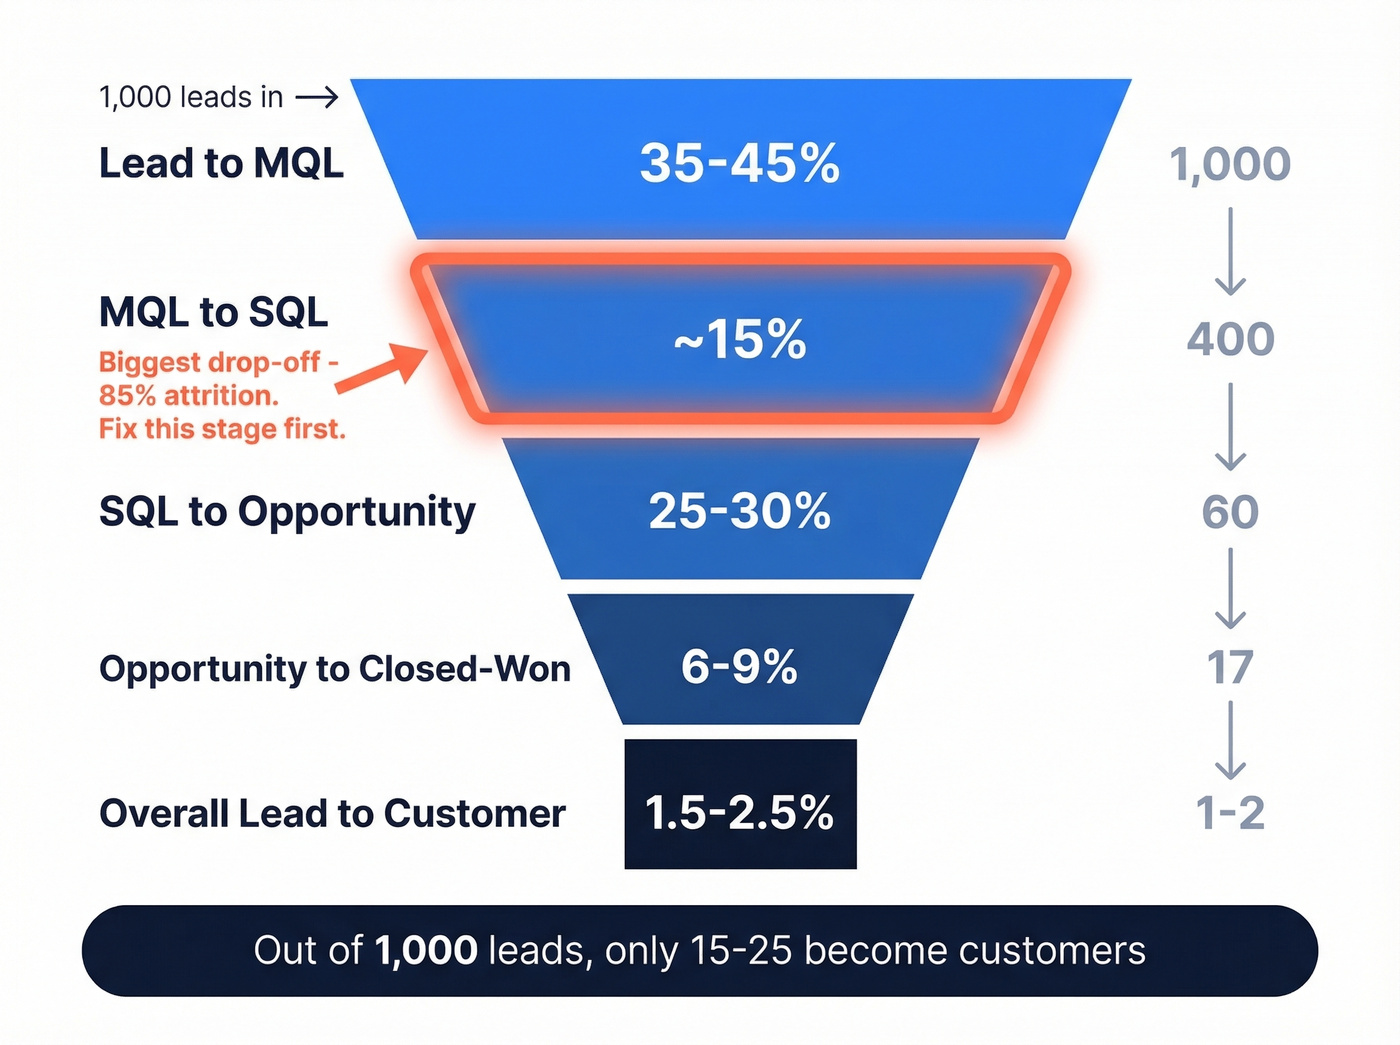
The full-funnel waterfall is where most teams find their biggest leak. Here are the stage-by-stage benchmarks:
| Stage | Benchmark |
|---|---|
| Lead to MQL | 35-45% |
| MQL to SQL | ~15% |
| SQL to Opportunity | 25-30% |
| Opportunity to Closed-Won | 6-9% |
| Overall Lead to Customer | 1.5-2.5% |
MQL to SQL is the biggest drop-off in almost every B2B funnel. Put it in real numbers: if marketing sends 1,000 MQLs, only 150 make it to sales. That 85% attrition rate means your biggest conversion lever isn't closing technique - it's qualification criteria and the handoff process between marketing and sales. If you're only going to fix one stage, fix that one.
Activity and Productivity Metrics
Reps spend roughly 30% of their time actually selling. The other 70% goes to CRM updates, internal meetings, admin, and searching for contact data. That ratio alone should make every sales leader uncomfortable.
The performance indicators that matter here are calls made, emails sent, meetings booked, and - critically - lead response time. A widely cited HBR speed-to-lead study found that responding within 5 minutes yields a 21% qualification rate. Wait 30 minutes and that drops to 1%. The average B2B team takes 42 hours to respond. Not a typo.
Activity counts without conversion context are meaningless - we'll get to that in the mistakes section. But one thing that silently kills activity metrics is bad contact data. If a third of your phone numbers are wrong, your reps are burning call blocks dialing dead lines. If you're tightening outbound execution, start with your sales activities and the systems that support them. An emerging metric worth watching: buyer sentiment scoring, which tracks engagement signals beyond opens and clicks to gauge actual prospect interest.
Efficiency Metrics
These are the metrics your CFO cares about most.
CAC is your total sales and marketing spend divided by new customers acquired - track it monthly and quarterly. LTV is average revenue per customer multiplied by average customer lifespan; for subscription businesses, that's ARPU x gross margin x (1 / churn rate). The ratio between them tells the real story. (If you want a deeper breakdown, use this cost to acquire customer guide as a reference.)
A healthy LTV:CAC ratio falls between 3:1 and 5:1. Below 3:1 means you're spending too much to acquire customers. Above 5:1 might mean you're underinvesting in growth. Top companies run above 4:1. CAC payback - how many months it takes to recoup acquisition cost - sits at a median of 15-18 months. Elite teams get under 12.
NRR (Net Revenue Retention) deserves its own callout. This is revenue from existing customers including expansion, minus churn and contraction. Top performers hit 120%+, which drives 2.3x higher valuations. If your NRR is below 100%, you're shrinking even if you're adding new logos. One more to consider: tool utilization rate. If your team uses 30% of the sales analytics platform you're paying for, that's a hidden drag on CAC that nobody's tracking.
Bad contact data silently destroys every metric on this page - activity rates, conversion rates, CAC, pipeline velocity. If a third of your phone numbers are wrong, your reps are burning hours dialing dead lines. Prospeo delivers 98% email accuracy and 125M+ verified mobile numbers with a 30% pickup rate, refreshed every 7 days. That's how teams like Snyk cut bounce rates from 35% to under 5% and grew AE-sourced pipeline 180%.
Stop optimizing metrics built on bad data. Start with contacts that connect.
2026 Sales Metric Benchmarks
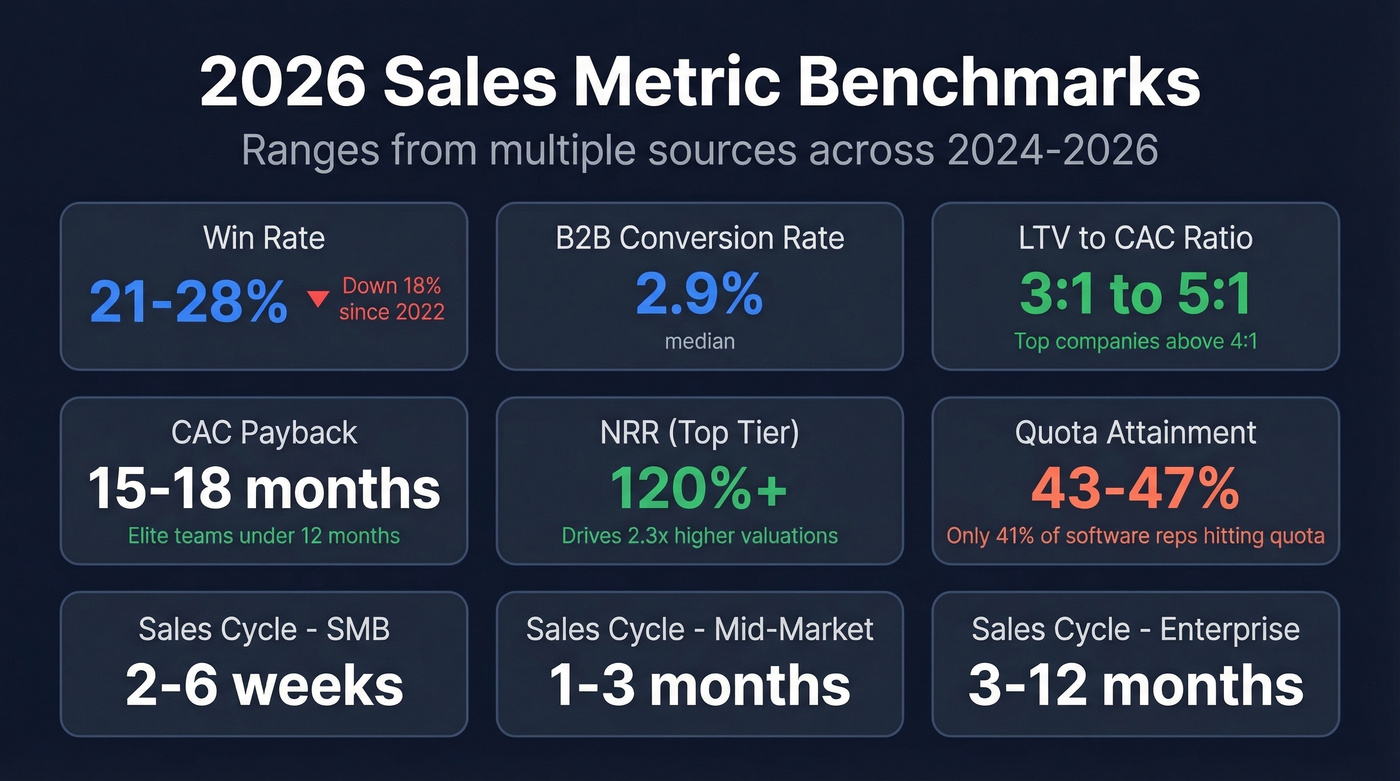
Here's the benchmark table you actually need. These numbers come from multiple sources across 2024-2026 - treat them as ranges, not gospel.
| Metric | Benchmark |
|---|---|
| Win rate | 21-28% |
| B2B conversion rate | 2.9% median |
| LTV:CAC | 3:1 to 5:1 |
| CAC payback | 15-18 months |
| NRR (top tier) | 120%+ |
| Quota attainment | 43-47% (43.5% per RepVue) |
| Sales cycle (SMB) | 2-6 weeks |
| Sales cycle (mid-market) | 1-3 months |
| Sales cycle (enterprise) | 3-12 months |
Win rates have dropped 18% since 2022 and 27% since 2021. And 41.2% of software reps are hitting quota - compared to 64.2% in medical devices and 60% in pharma/biotech. The consensus on r/sales is that software quotas are set based on 2021 pipeline dynamics that no longer exist, which tracks with what we're hearing from customers too.
Let's be honest: if your average deal is under $15k and your team is under 10 reps, you probably don't need a 30-metric dashboard. Five metrics tracked weekly with honest data will outperform a sprawling dashboard built on stale CRM records every single time.
Which Metrics Matter by Role
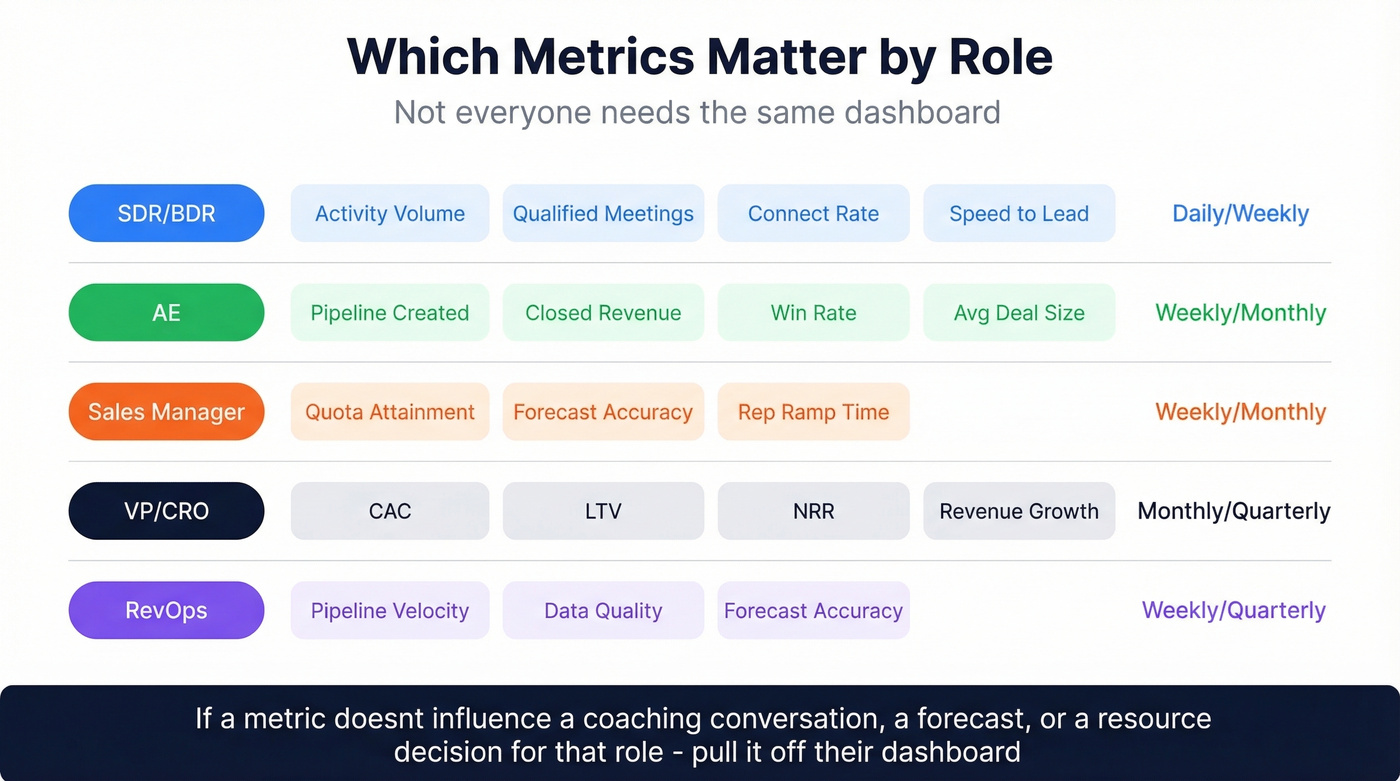
Not everyone needs the same dashboard. Here's the breakdown with recommended tracking cadence:
| Role | Priority Metrics | Cadence |
|---|---|---|
| SDR/BDR | Activity volume, qualified meetings, connect rate, speed-to-lead | Daily/Weekly |
| AE | Pipeline created, closed revenue, win rate, avg deal size | Weekly/Monthly |
| Sales Manager | Quota attainment, forecast accuracy, rep ramp time | Weekly/Monthly |
| VP/CRO | CAC, LTV, NRR, revenue growth rate | Monthly/Quarterly |
| RevOps | Pipeline velocity, data quality, forecast accuracy | Weekly/Quarterly |
The mistake most orgs make is giving everyone the same report. Your SDRs don't need to see NRR. Your CRO doesn't need to see individual call counts. Highspot's guidance is solid here: if a metric doesn't influence a coaching conversation, a forecast, or a resource decision for that role, pull it off their dashboard. If you're building the operating rhythm around this, align it with your sales operations metrics so RevOps and leadership are looking at the same definitions. For teams that already have too many dashboards, start by asking each role which three numbers they actually check before their Monday standup. Everything else is noise.
Common Measurement Mistakes
Track this, not that:
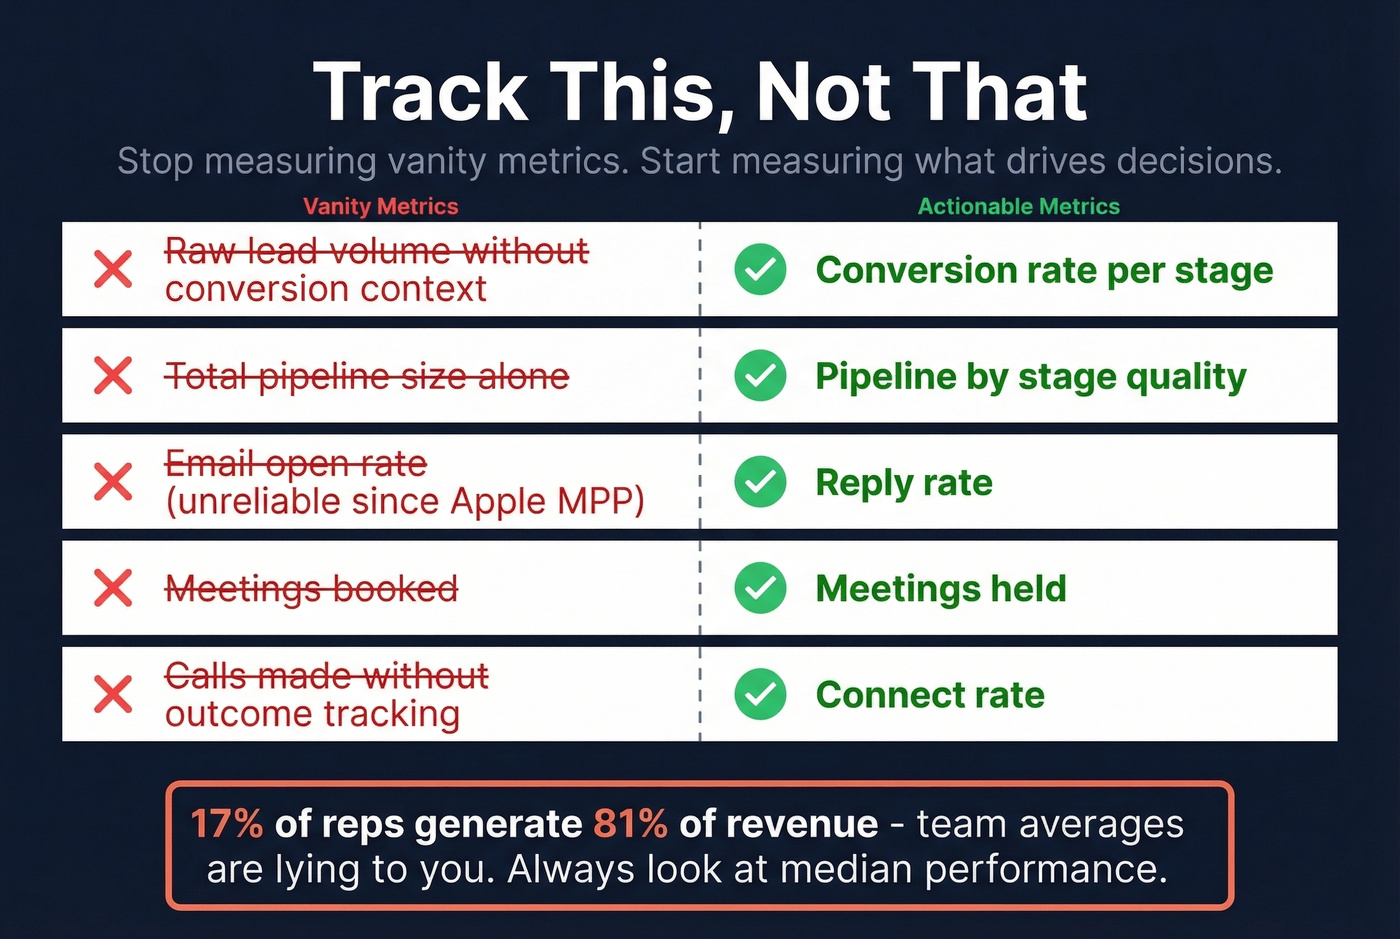
- Conversion rate per stage, not raw lead volume without conversion context
- Pipeline by stage quality, not total pipeline size alone
- Reply rate, not email open rate (opens are unreliable since Apple's MPP)
- Meetings held, not meetings booked
- Connect rate, not "calls made" without outcome tracking
Vanity metrics feel productive. A dashboard showing 500 calls this week looks great until you realize the connect rate was 4% and zero of those conversations converted. Raw activity counts without conversion context are the most common metric trap we see across our customer base.
One more pattern worth flagging: 17% of reps generate 81% of revenue. That "hero rep" skew means team averages are lying to you - a few top performers mask systemic problems across the rest of the org. Always look at median performance alongside averages, and segment by tenure, territory, and deal type. Skip the average entirely if your team is under 15 reps; it's statistically useless at that size.
The Data Quality Problem Nobody Talks About
Every metric on this list depends on one thing nobody wants to audit: the quality of the underlying contact data.
Bad data inflates CAC because reps waste cycles on unreachable contacts. It deflates conversion rates because sequences bounce instead of landing. It tanks productivity because that 30% selling time shrinks further when reps spend half their call block dialing disconnected numbers. In our experience, this is the single most common root cause when a team's metrics look inexplicably bad despite solid process and good reps. If you're diagnosing the downstream impact, start with email bounce rate and work backward to list sources and enrichment.

Before you optimize any metric on this list, audit your contact data. If your bounce rate is above 5%, your metrics are lying to you. Meritt saw this firsthand - their bounce rate was 35% before switching to Prospeo, which dropped it under 4%. Their pipeline tripled from $100K to $300K per week. Snyk's AE-sourced pipeline jumped 180% after fixing the same upstream problem. The difference between a 7-day data refresh cycle and the 6-week industry average is the difference between metrics that reflect reality and metrics that reflect last month's reality. If you need a process for cleaning and filling gaps, use a lead enrichment workflow and standardize it in RevOps.
Your LTV:CAC ratio tanks when reps waste 70% of their time on admin and dead-end dials. Prospeo gives your team verified emails and direct dials at $0.01 per lead - 90% cheaper than ZoomInfo - so every activity metric actually converts. Teams using Prospeo book 26% more meetings and triple pipeline output without adding headcount.
Cut CAC and boost conversion rates with data that actually picks up.
FAQ
What's the difference between sales metrics and sales KPIs?
Metrics measure any sales activity or outcome - calls made, emails sent, deals in pipeline. KPIs are the subset tied to strategic goals that you use to make decisions. Every KPI is a metric, but not every metric earns KPI status. Focus your core dashboard on 8-12 KPIs rather than 30 numbers nobody acts on.
How many metrics should I track?
Eight to twelve for your core dashboard, split between leading indicators and lagging outcomes. If you can't explain what action you'd take when a metric moves 10% in either direction, cut it.
Why are my sales metrics inaccurate?
Usually bad underlying data. If a third of your contact records are stale or wrong, every downstream number - CAC, conversion rate, productivity - is distorted. Audit your CRM quarterly, enforce data hygiene standards, and use verified contact sources so the numbers reflect reality.
What are the most important metrics for B2B teams?
The five most tracked across B2B organizations are win rate, pipeline coverage, CAC, average sales cycle length, and quota attainment. SaaS teams typically add NRR and LTV:CAC to that core set. The specific mix depends on your role - SDRs focus on activity and speed-to-lead, while CROs care about unit economics and retention.