Competitive Landscape Examples: 3 You Can Copy (2026)
You need a competitive landscape with real companies in it - not another definition rehashing Porter's Five Forces. Here are three filled-in examples, plus the frameworks and tools to build your own this week.
A competitive landscape is a visual snapshot of where competitors sit relative to each other on the dimensions that matter to buyers. 95% of the time, the winning vendor is already on the buyer's Day One shortlist. If you're not positioned clearly in your landscape, you're invisible before the conversation starts.
3 Filled-In Examples to Copy
Each example below uses a different visualization format so you can match the right one to your market.
Project Management SaaS (2x2 Map)
The 2x2 is the go-to format for exec presentations. Project management SaaS is a perfect test case because the market is brutally crowded - over 16,000 SaaS startups compete for attention, and most buyers can't tell them apart without a visual anchor.
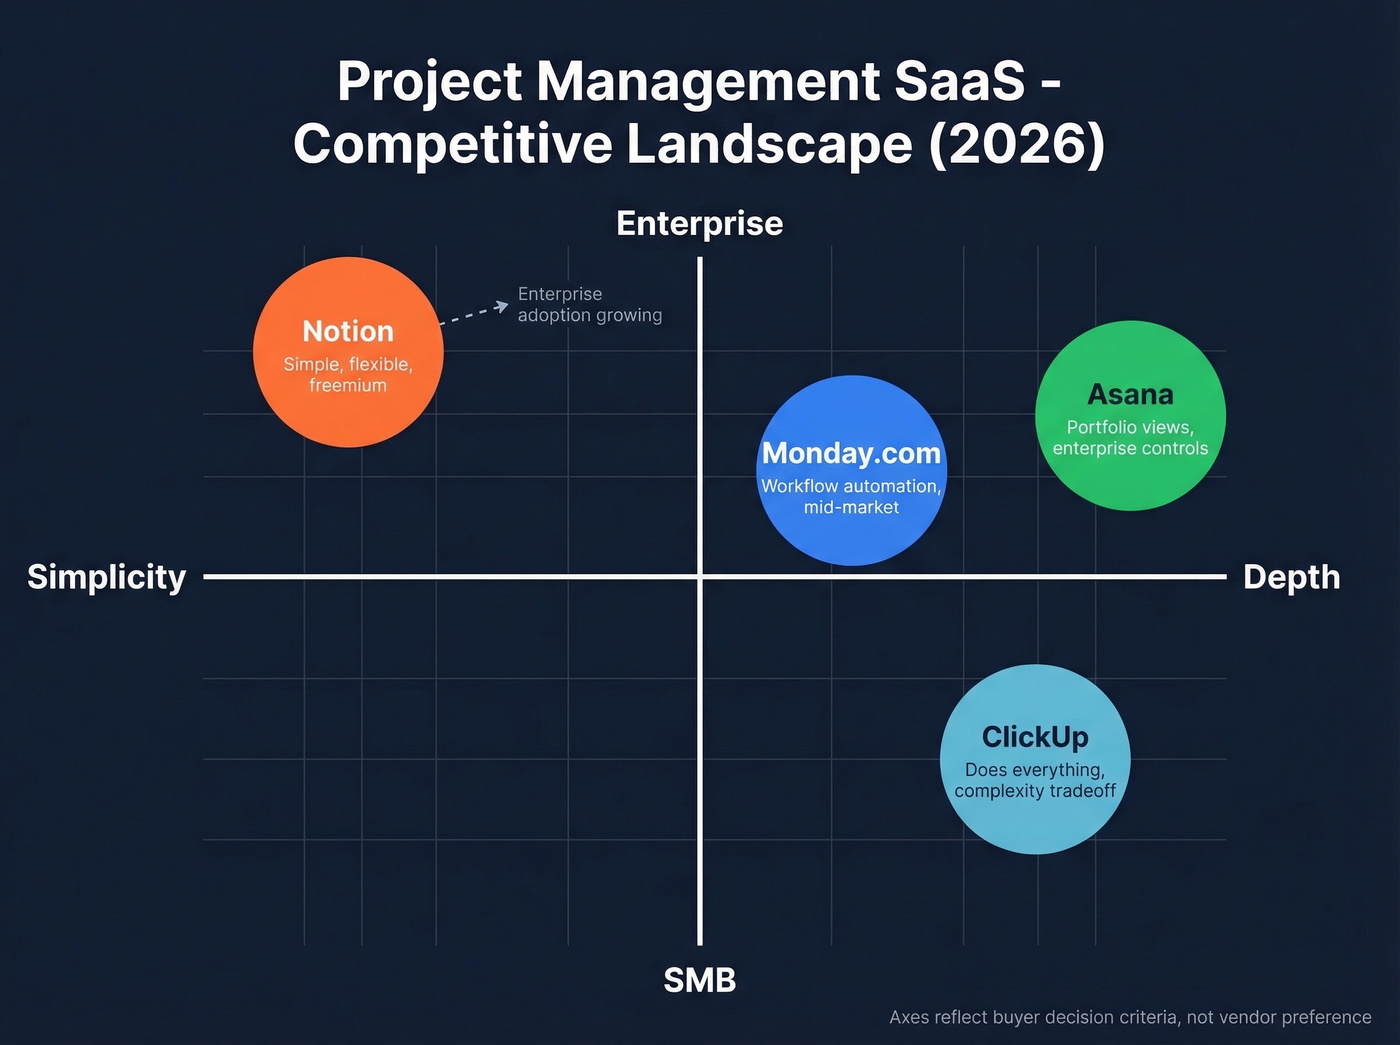
Axes: Simplicity <-> Depth (x-axis) and SMB <-> Enterprise (y-axis).
- Notion - upper-left. Simple, flexible, freemium. SMB-dominant but enterprise adoption is growing fast.
- Monday.com - center-right. Deeper workflow automation, strong mid-market presence. Per-seat pricing scales fast, which pushes some teams toward alternatives.
- Asana - right, trending enterprise. Heavy on portfolio views, SSO, and admin controls.
- ClickUp - lower-right. Tries to do everything. Appeals to teams wanting one tool, but complexity is the tradeoff.
Pick axes that reflect how buyers actually disqualify options, not how you want to look. That's the difference between a strategic tool and a vanity slide.
Customer Service Software (Comparison Matrix)
A comparison matrix works when you need more than two dimensions at once. Crayon's competitive landscape methodology benchmarks companies across growth trajectory, traffic and social reach, and homepage positioning history - then assigns labels like Industry Billboard, Market Leader, and Top Challenger.
| Tool | Pricing Tier | Primary Channel | Target Segment | Market Role |
|---|---|---|---|---|
| Zendesk | Mid-to-enterprise | Omnichannel | Mid-market + enterprise | Industry Billboard |
| Intercom | Mid-tier | Chat-first | SMB + mid-market | Top Challenger |
| Freshdesk | Budget-friendly | Omnichannel | SMB | Niche Specialist |
| Drift | Premium | Conversational AI | Mid-market + enterprise | Niche Specialist |
Zendesk stands out on brand visibility with roughly 82K Twitter followers. Freshdesk wins on price. Drift carved out a conversational marketing niche. The matrix makes these distinctions scannable in seconds - which is the whole point.
POS Systems (Growth Trajectory Snapshot)
When your landscape includes public and private companies at very different stages, a growth trajectory table tells a clearer story than a 2x2.
| Company | Est. Revenue | Funding | Public/Private | Market Role |
|---|---|---|---|---|
| Square | Large-scale | N/A (public) | Public | Market Leader |
| NCR | Large-scale | N/A (public) | Public | Legacy Leader |
| Toast | $500M-$1B | N/A | Private | Top Challenger |
| Revel Systems | Mid-market | N/A | Private | Niche Player |
Toast is the story here - a challenger that grew aggressively in restaurant-specific POS while Square went horizontal. This format, borrowed from Crayon's framework, tracks growth trajectory, traffic and reach, and positioning history side by side.
7 Ways to Visualize Your Chart
Not every landscape belongs in a 2x2. Here are seven formats and when each works best:
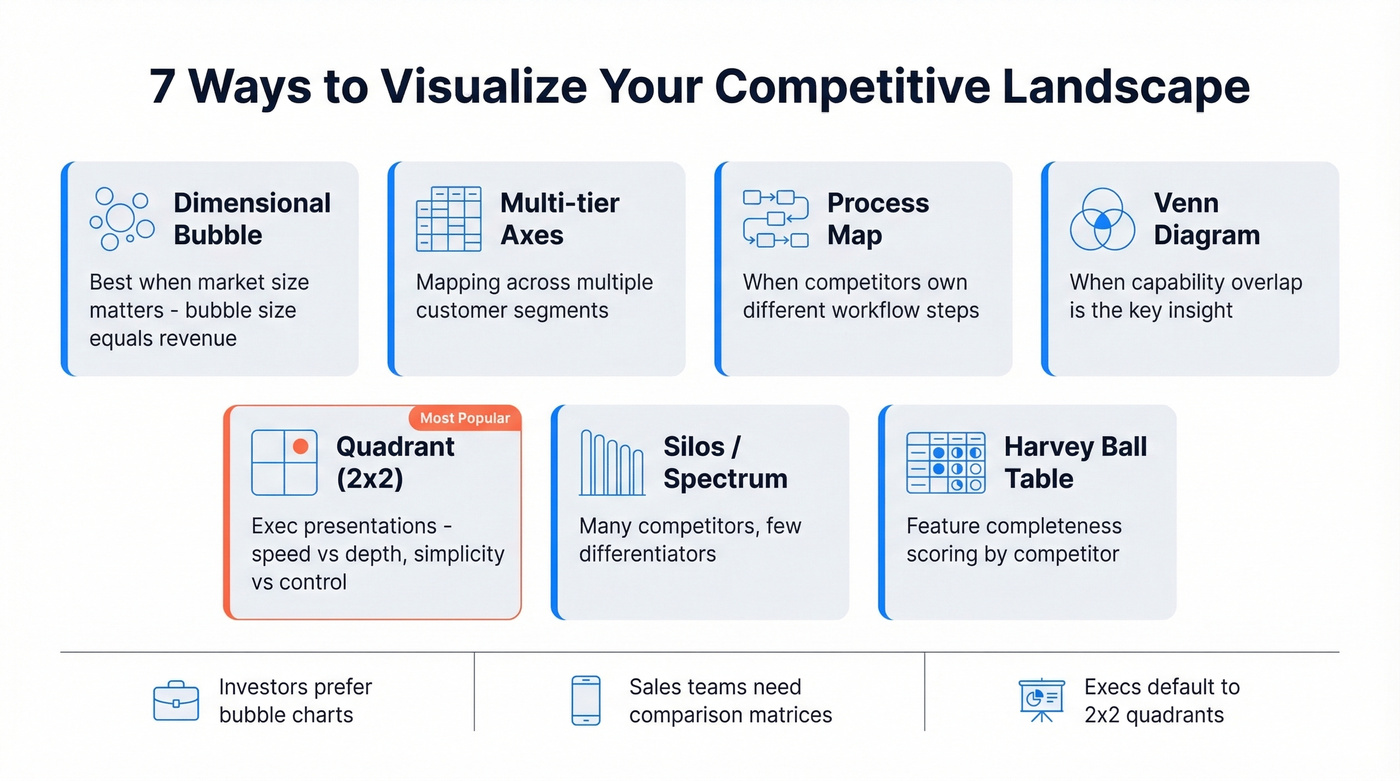
- Dimensional bubble - when market size matters. Bubble size = revenue.
- Multi-tier axes - when mapping across customer segments.
- Process map - when competitors own different workflow steps.
- Venn diagram - when capability overlap is the key insight.
- Quadrant (2x2) - for exec presentations. Axes like speed vs. depth, simplicity vs. control.
- Silos/spectrum - many competitors, few differentiators.
- Harvey ball table - feature completeness scoring by competitor.
Choosing the right chart format depends on your audience. Investors prefer bubble charts that show market sizing, while sales teams need comparison matrices they can reference mid-call. We've found that most teams default to the 2x2 because it's familiar, even when a comparison matrix or bubble chart would communicate their actual insight far more clearly.
How to Choose Your Axes
The axes you pick matter more than the chart format. A 2x2 with axes like "modern vs. legacy" or "powerful vs. basic" is self-esteem with a chart, not strategy.
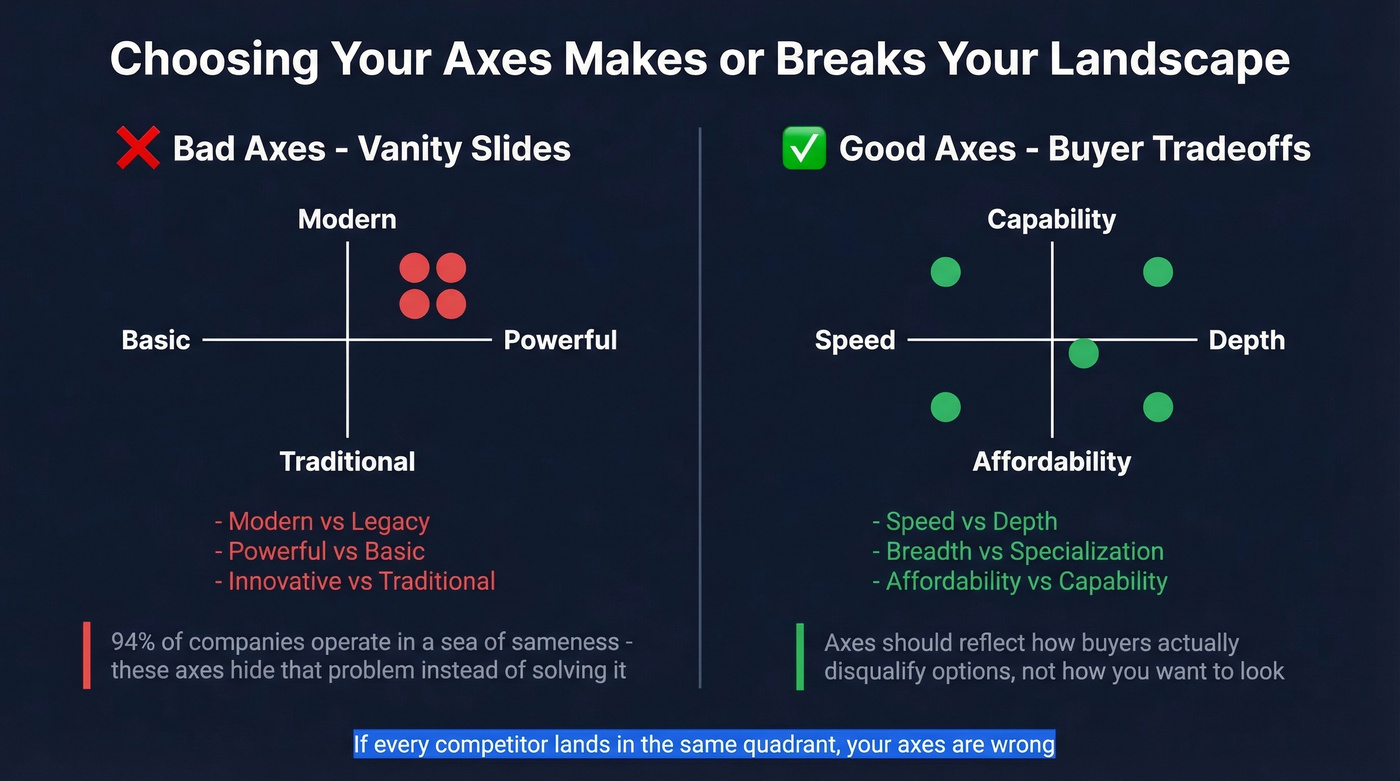
Buyers don't think in those terms. They think in tradeoffs: speed vs. depth, breadth vs. specialization, affordability vs. capability. Wynter found that 94% of companies operate in a "sea of sameness" - only 6% say their brand is very distinctive. Your axes should force differentiation, not confirm it. If every competitor lands in the same quadrant, your axes are wrong.
Here's the thing: most competitive landscapes fail not because the data is bad, but because the creator picked flattering axes instead of honest ones. We've built landscapes for teams where the founder's preferred axes put them in the top-right quadrant every time - and buyers still chose competitors. The axes have to reflect the buyer's mental model, even when that's uncomfortable.
A competitive landscape is only as good as the data behind it. Prospeo's 300M+ verified profiles with 30+ filters - including technographics, buyer intent, and headcount growth - let you map competitors by the dimensions buyers actually care about. At $0.01 per email, you can enrich every company on your landscape without blowing your budget.
Stop guessing where competitors sit. Build your landscape with real data.
Mistakes That Kill Your Analysis
Price-only framing. A practitioner on r/ProductMarketing described leadership reducing the entire competitive view to price brackets. This drives feature-parity thinking and completely misses indirect competition, integrations, and the actual problem buyers are solving. Other practitioners in the thread echoed the same frustration - leadership wants a simple grid, but simple grids produce simple strategies. And simple strategies lose.
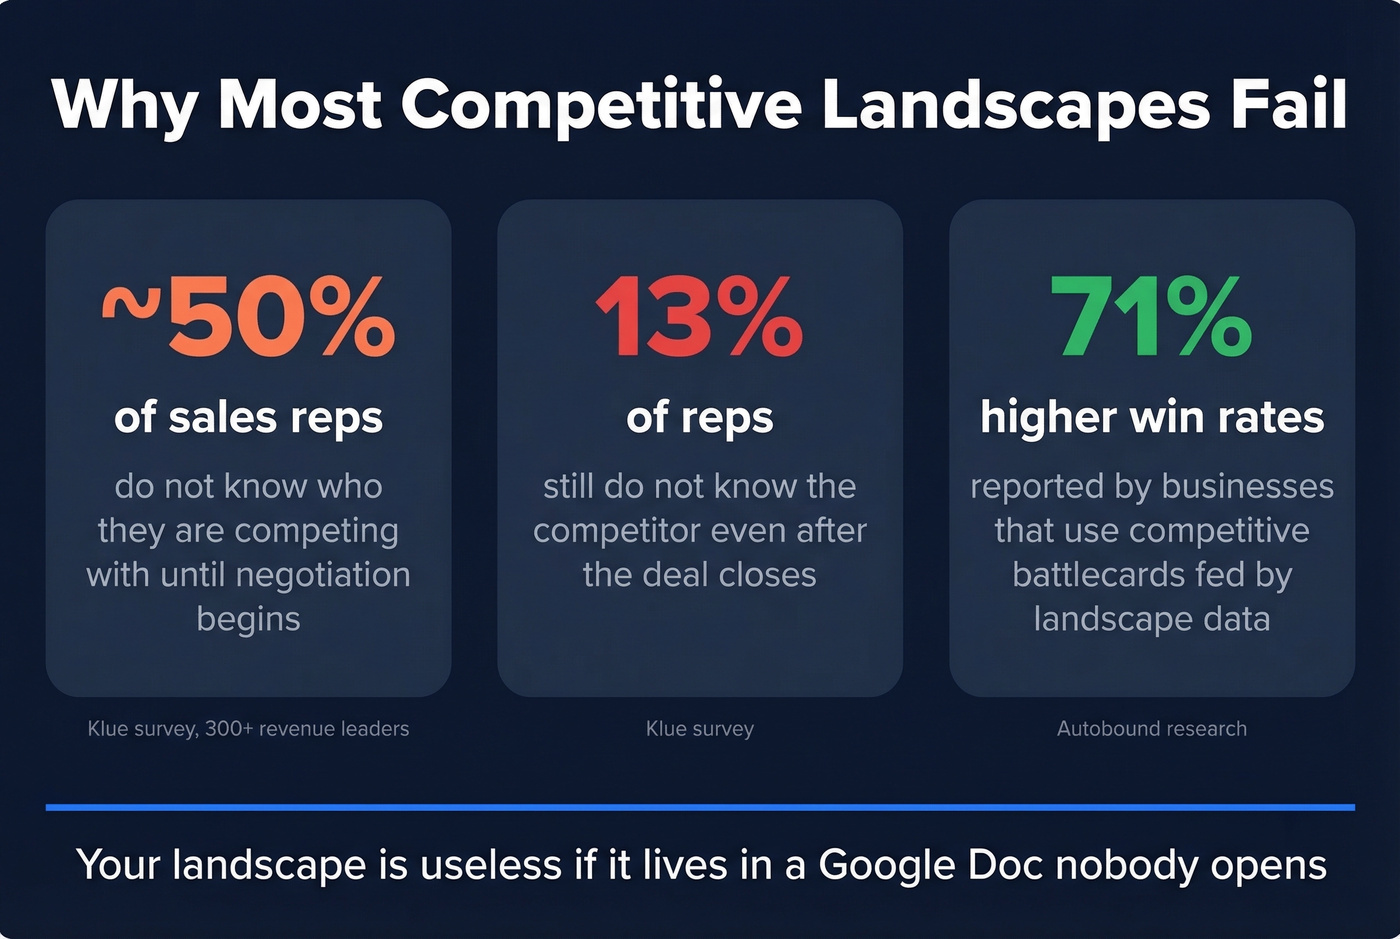
Reps don't know who they're competing with. In a Klue survey of 300+ revenue leaders, nearly half said reps don't know the competitor until negotiation. 13% said reps don't know even after the deal closes. Your landscape is useless if it lives in a Google Doc nobody opens. If you're building enablement around this, ship battlecards reps can actually use.
Annual-only updates. We've seen teams make major positioning decisions based on landscapes that were 9 months stale. Markets move quarterly. An annual landscape is a historical document, not a strategic tool.
Vague axes with no buyer grounding. "Innovative vs. traditional" tells you nothing. If your axes don't map to a real buyer decision criterion, start over.
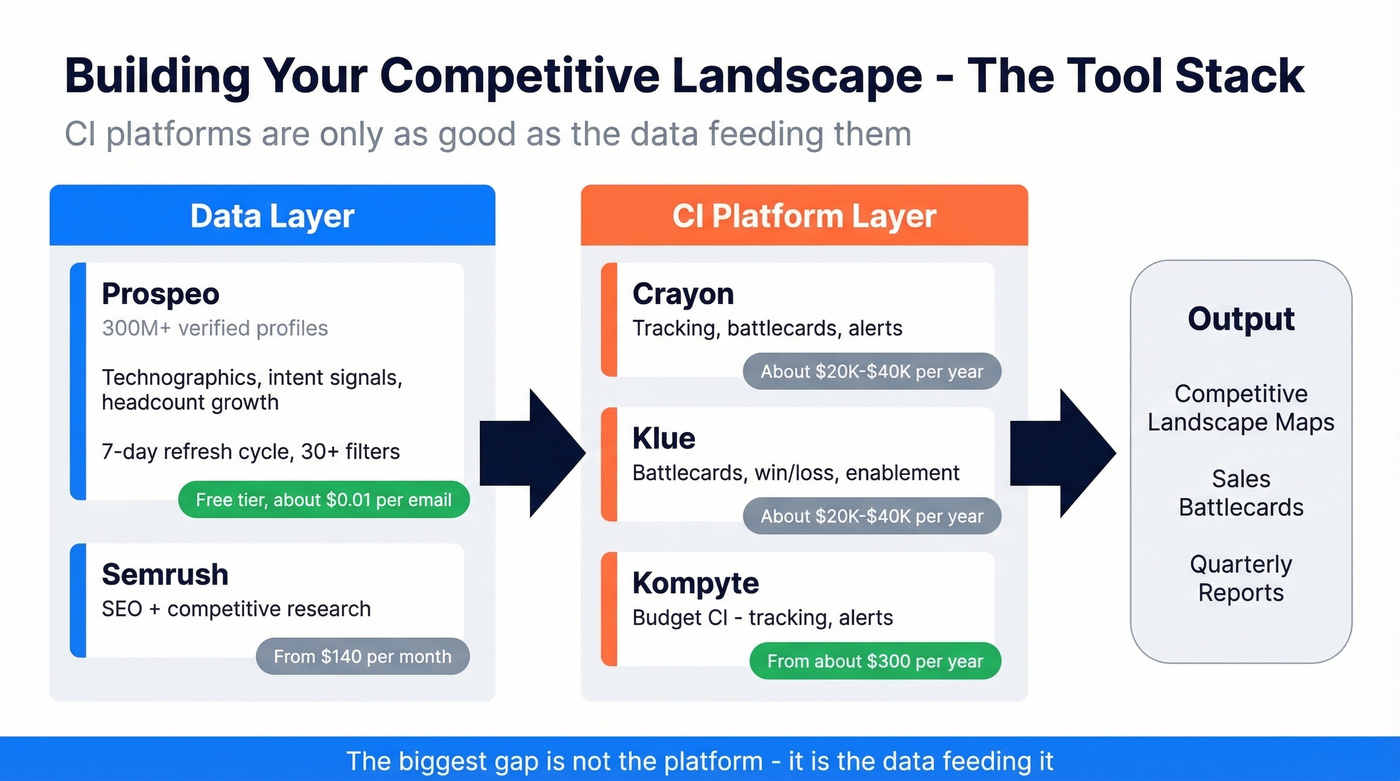
Tools to Build Your Landscape
CI platforms organize competitive intel, but in our experience the biggest gap isn't the platform - it's the data feeding it.
| Tool | What It Does | Typical Pricing |
|---|---|---|
| Prospeo | B2B data: 300M+ verified profiles, technographics, intent signals | Free tier; ~$0.01/email |
| Crayon | CI platform: tracking, battlecards, alerts | ~$20K-$40K/yr |
| Klue | CI platform: battlecards, win/loss, enablement | ~$20K-$40K/yr |
| Kompyte | Budget CI: tracking, alerts, battlecards | From ~$300/yr |
| Semrush | SEO + competitive research | From $140/mo |
Businesses using battlecards report 71% higher win rates. The CI platforms above handle the tracking and distribution layer well, but they're only as good as the underlying data. For the company and contact intelligence that feeds your landscape - technographics, intent signals, headcount growth - tools like Prospeo fill that gap with a 7-day refresh cycle and 30+ search filters.
If you're evaluating data sources, start with a ranked list of the B2B database options, then narrow down by your use case (prospecting vs. enrichment vs. intent).
How Often to Update
Weekly tracking, quarterly full refresh. That's the minimum.
Set up automated alerts for website changes and messaging shifts, then do a complete landscape rebuild each quarter. Each refresh should feed into a competitive landscape report that stakeholders across sales, product, and marketing can reference - otherwise insights stay siloed in one team's inbox. If you want a clean handoff, tie the refresh to your RevOps tech stack and your B2B sales pipeline management cadence. Let's be honest: most competitive landscapes die because nobody owns the update cycle. Assign an owner, set a calendar reminder, and treat the quarterly refresh like a deliverable with a deadline.
A strong competitive landscape isn't a one-time deliverable. It's a living document that evolves as competitors shift positioning, enter new segments, or change pricing. Treat it that way and it becomes the most referenced strategic asset your team has.
Your landscape tells you who to target. Prospeo tells you how to reach them. Layer intent data across 15,000 topics to see which accounts in your competitive landscape are actively in-market - then pull 98%-accurate emails and verified mobile numbers to contact decision-makers directly.
Turn your competitive landscape from a strategy slide into a pipeline machine.
FAQ
What frameworks work for competitive landscape analysis?
The most common are the 2x2 positioning matrix, comparison matrices, Porter's Five Forces, and perceptual maps. Start with a 2x2 for exec presentations - it forces you to pick two dimensions that actually differentiate. Use a comparison matrix when you need to score more than two attributes at once.
How is a landscape different from a competitive analysis?
A competitive landscape is the visual snapshot - a single deliverable like a 2x2 or matrix. A competitive analysis is the deeper research (pricing, features, win/loss data) that produces it. The final competitive landscape report packages both the visual and the supporting data into something leadership can act on.
What data do you need to build an accurate landscape?
You need firmographic data like revenue, headcount, and funding. You need technographic signals showing what tools competitors and their customers use. And you need buyer intent data to understand who's actively in-market. CI platforms like Klue handle the tracking layer, while B2B data platforms cover the underlying company and contact intelligence.
How often should you update a competitive landscape?
Refresh quarterly at minimum, with weekly automated alerts for competitor website and messaging changes. Markets shift too fast for annual updates - teams that rely on 9-month-old landscapes make positioning decisions based on outdated assumptions.