Customer Acquisition Cost in Marketing: The 2026 Guide to Calculating, Benchmarking, and Reducing CAC
$2.00 in sales and marketing spend to generate $1.00 in new ARR. That's the median for SaaS companies - up 14% year-over-year. Meanwhile, 75% of software companies reported declining retention rates in 2024. Rising customer acquisition cost plus higher churn is a compounding problem, and most teams are making it worse by measuring CAC wrong in the first place.
The fastest lever most teams ignore? Data quality. Bad contact data inflates outbound costs through bounced emails, wrong numbers, and wasted rep time - all of which show up in your CAC whether you're tracking them or not.
What Is Customer Acquisition Cost?
Customer acquisition cost is the total amount you spend on sales and marketing to win one new paying customer:
CAC = Total Sales & Marketing Costs / New Customers Acquired
"Total costs" is where teams get sloppy. It's not just your ad budget. It's every dollar that touches the acquisition engine - salaries, commissions, software, content production, events, and the overhead that supports all of it. Divide that by the number of new customers acquired in the same period. Not renewals. Not expansions.
One distinction worth nailing down: CAC isn't the same as CPA. CPA measures the cost of any conversion action - a signup, a free trial, a webinar registration. CAC focuses exclusively on paying customers. CPA is always lower than CAC, which is exactly why lazy reporting defaults to it. If your team reports CPA and calls it CAC, you're understating your real acquisition cost, sometimes by 40% or more.
The Fully Loaded CAC Mistake
Here's the thing: most teams undercount CAC. They tally up ad spend, maybe throw in the SDR team's base salary, and call it a day. That's not CAC. That's a fraction of CAC wearing a trenchcoat.
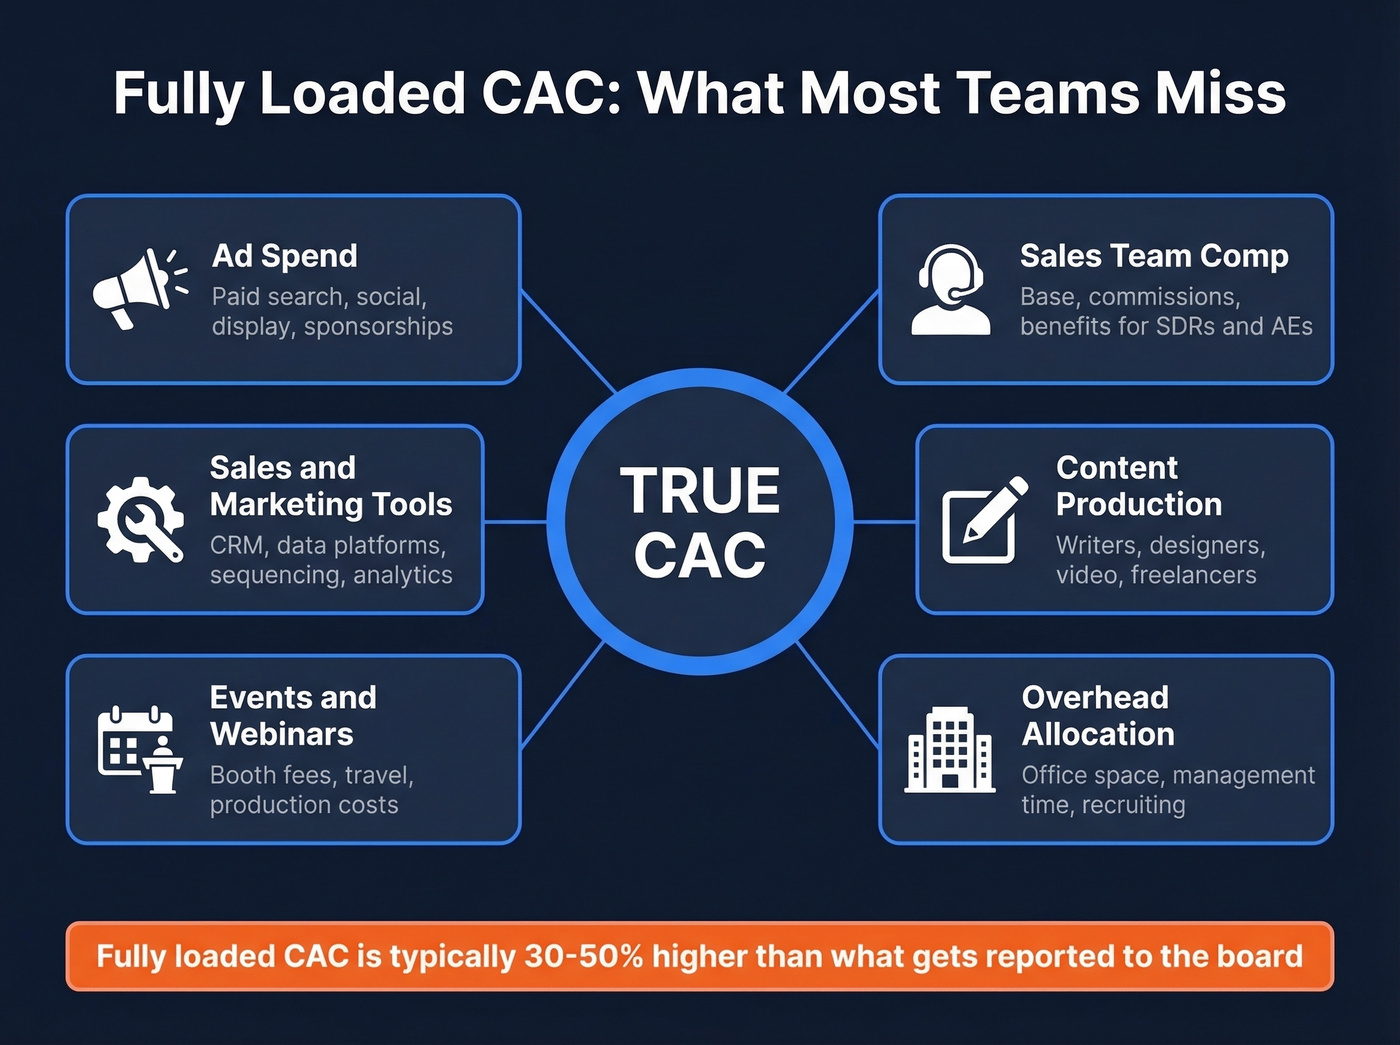
A fully loaded calculation includes everything on your P&L that contributes to acquiring customers:
- Ad spend across paid search, paid social, display, and sponsorships
- SDR and AE compensation - base, commissions, and benefits
- Sales and marketing tools like your CRM, data platforms, sequencing software, and analytics
- Content production from writers, designers, video teams, and freelancers
- Events and webinars covering booth fees, travel, and production
- Overhead allocation for office space, management time, and recruiting costs for sales hires
The recurring complaint on r/startups is that teams only count ad spend and fool themselves. If it's on your P&L and it contributes to getting a customer through the door, it belongs in your CAC model. In our experience, fully loaded CAC runs 30-50% higher than what gets reported to the board. But it's the only number that tells you whether your growth engine is actually efficient.
CAC Benchmarks by Industry
Benchmarks are guardrails, not gospel. That said, FirstPageSage's dataset - drawn from clients between January 2022 and August 2025, updated January 2026 - is one of the most granular public sources available. They break CAC into organic and inorganic, then blend at a 75/25 weighting.
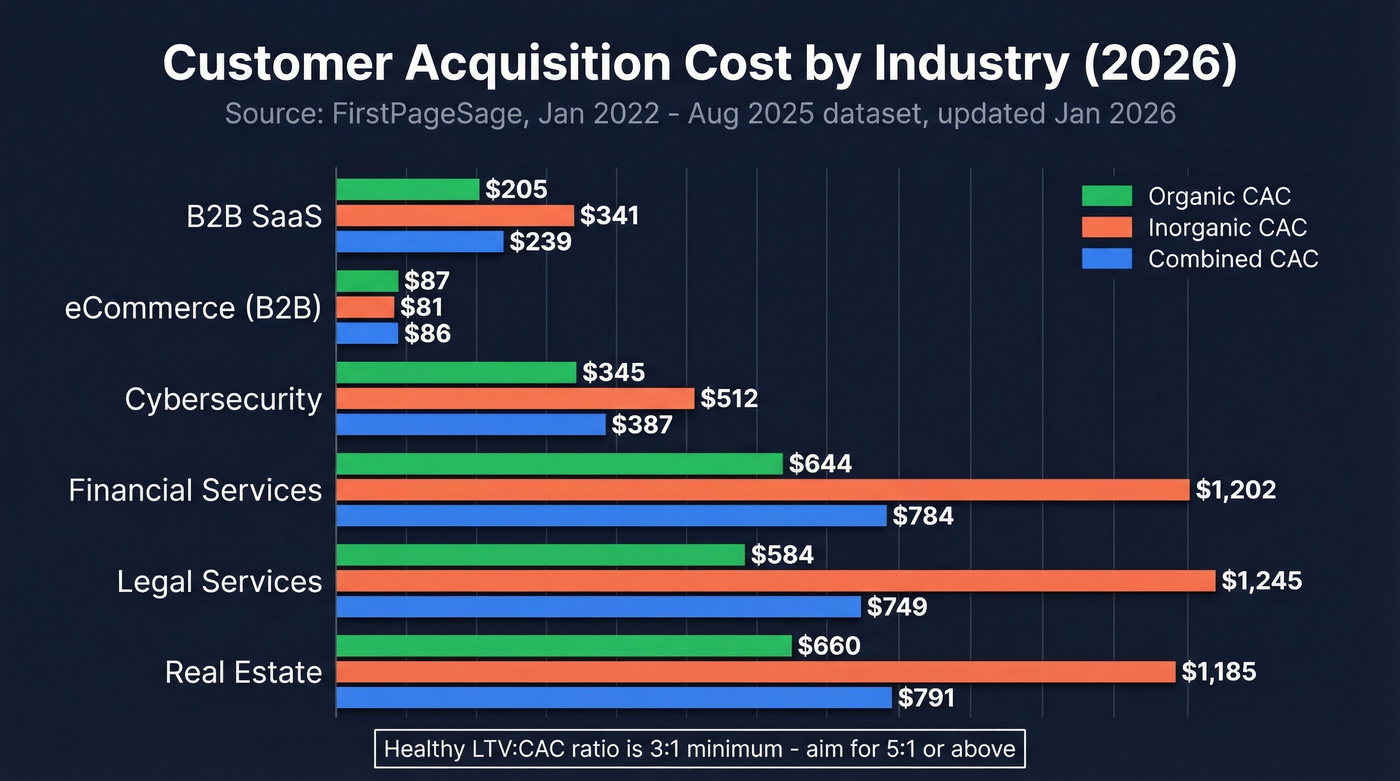
| Industry | Organic CAC | Inorganic CAC | Combined CAC |
|---|---|---|---|
| B2B SaaS | $205 | $341 | $239 |
| eCommerce (B2B) | $87 | $81 | $86 |
| Cybersecurity | $345 | $512 | $387 |
| Financial Services | $644 | $1,202 | $784 |
| Legal Services | $584 | $1,245 | $749 |
| Real Estate | $660 | $1,185 | $791 |
A few things jump out. Financial services and legal services have inorganic CACs that are 2x their organic CACs - if you're in those verticals and leaning heavily on paid channels, you're paying a steep premium. eCommerce is the outlier: organic and inorganic CACs are nearly identical, making channel allocation less of a lever there.
HubSpot corroborates these ranges and adds the standard benchmark: an LTV:CAC ratio of 3:1 is considered healthy. Let's be honest though - 3:1 is the minimum, not the goal. If you're at 3:1, you're surviving. At 5:1 or above, you've got a real growth engine. Below 3:1, you're burning cash to acquire customers who may never pay you back.
The companies we've seen blow past 5:1 ratios aren't the ones with the biggest budgets. They're the ones that ruthlessly cut channels delivering below 3:1 and doubled down on what worked.
Outbound sales at $1,980 per customer is brutal - and bad contact data makes it worse. Bounced emails, wrong numbers, and wasted rep time all inflate your CAC. Prospeo delivers 98% email accuracy and 125M+ verified mobiles at $0.01/email, so every dollar your SDRs spend actually reaches a real buyer.
Cut your outbound CAC by eliminating the data waste inflating it.
CAC by Marketing Channel
Not all channels are created equal, and the gap between the best and worst is enormous. Phoenix Strategy Group's analysis of 939 B2B companies puts hard numbers on it:
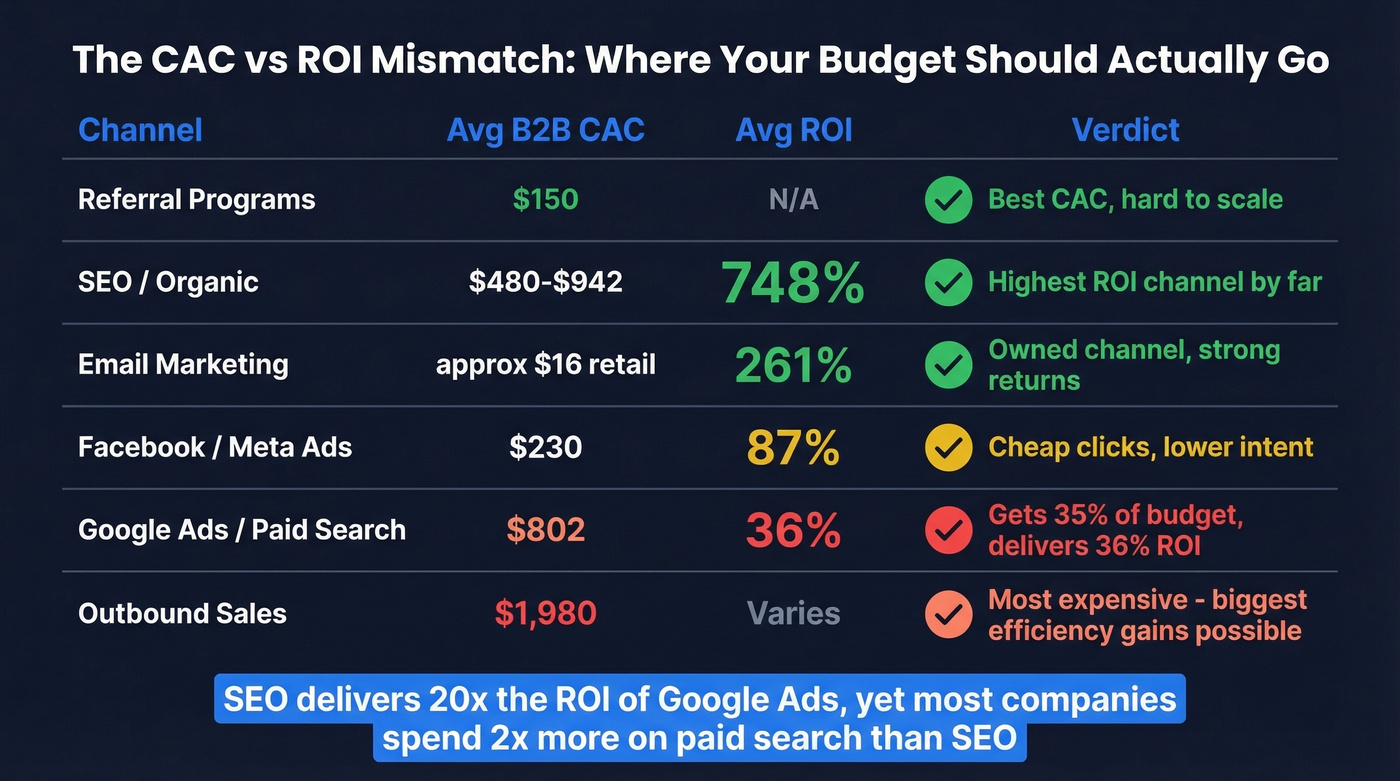
| Channel | Avg B2B CAC | Notes |
|---|---|---|
| Referral Programs | $150 | Lowest CAC, hardest to scale |
| Facebook Ads | $230 | Cheap but lower intent |
| SEO / Organic | $480-$942 | Wide range by vertical |
| Paid Search | $802 | Google Ads CPL up 5.13% |
| LinkedIn Ads | $982 | High intent, high cost |
| Outbound Sales | $1,980 | Highest CAC channel |
Outbound sales at $1,980 per customer is the most expensive channel by a wide margin. That number makes sense when you factor in SDR salaries, tools, and the sheer volume of touches needed to close. But it also means outbound teams have the most to gain from efficiency improvements - every percentage point of waste you eliminate has an outsized impact on your total marketing spend.
Now look at ROI by channel, which tells a different story than raw CAC. From Focus Digital's 2021-2024 averages:
| Channel | Avg ROI | Break-Even |
|---|---|---|
| SEO | 748% | 6-8 months |
| Email Marketing | 261% | 7 months |
| 229% | 5 months | |
| Meta Ads | 87% | 3 months |
| Google Ads | 36% | 4 months |
A 748% average ROI versus 36% for Google Ads. That's a 20x difference. And in enterprise budget splits, paid search often gets 35% of digital spend while SEO gets 15%. The math doesn't add up, but inertia keeps the allocation in place at most companies.
At smaller scale, retail benchmarks show the same pattern: email marketing runs roughly $16 per customer versus roughly $59 for online paid ads. Owned channels beat paid channels on cost per acquisition almost every time.
CAC Payback Period
Here's what this looks like in practice. Say you spend $1,000 to acquire a customer paying $150/month at 70% gross margin. Per ScaleXP's worked example:
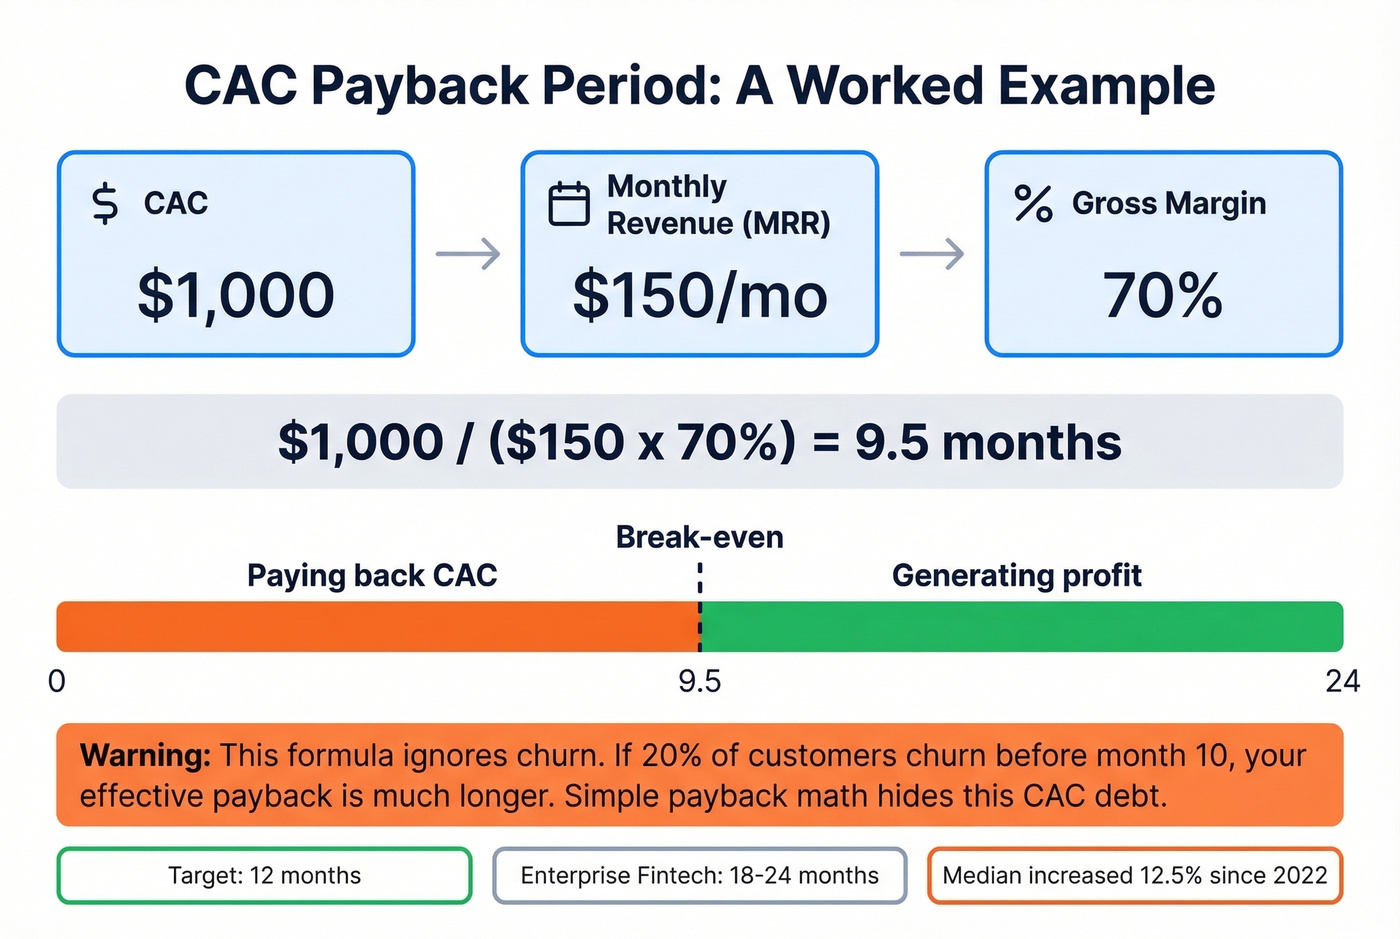
$1,000 / ($150 x 70%) = 9.5 months
That's a reasonable payback for a mid-market SaaS product. The formula:
CAC Payback Period = CAC / (MRR x Gross Margin %)
Enterprise fintech companies often run 18-24 months due to longer sales cycles. The conventional wisdom says 12 months is the target, but Benchmarkit's data shows the median payback period increased 12.5% since 2022. Teams are taking longer to recoup acquisition costs, which puts more pressure on retention.
One caveat most payback discussions skip: the formula ignores churn and the time value of money. If you acquire 100 customers with a 9.5-month payback but 20% churn before month 10, your effective payback is much longer. Simple payback math hides this "CAC debt" - future cohorts end up subsidizing the customers who churned before paying back their acquisition cost.
Advanced CAC Metrics
New CAC Ratio measures how much you spend on sales and marketing to generate $1 of new customer ARR. The 2024 median hit $2.00 - meaning companies spent $2 in S&M for every $1 of new ARR, a 14% increase from the prior year. Fourth-quartile companies are even worse at $2.82 per dollar. If you're spending nearly $3 to acquire $1 in recurring revenue, your unit economics are underwater unless retention is exceptional.
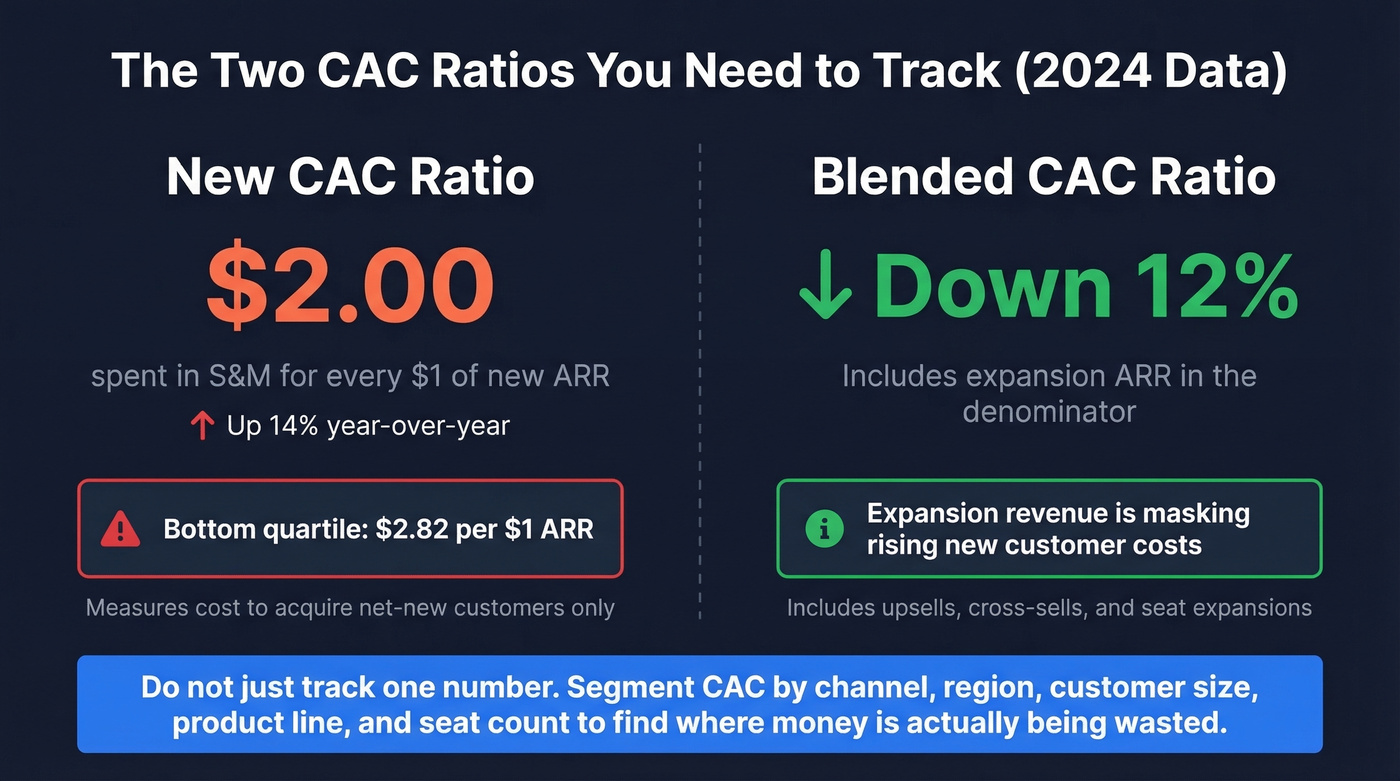
Blended CAC Ratio includes expansion ARR alongside new customer ARR in the denominator. This ratio decreased 12% in 2024, which tells an interesting story: companies are getting more efficient at expanding existing accounts even as new acquisition gets more expensive. We've watched teams celebrate an improving blended ratio while their new CAC ratio quietly deteriorated. That works until your expansion base stops growing.
Beyond these ratios, Paddle's segmentation framework is worth adopting. Sophisticated operators don't calculate one blended number. They segment by initial vs. renewal vs. reactivation CAC, by market or region, by customer type and size, by product line, and by seat count. Each segment reveals where money is being spent efficiently and where it's being wasted. A single top-line number rarely drives better decisions - you need the granular view to actually act.
How to Reduce Customer Acquisition Cost
Cutting budget is the lazy approach to CAC reduction. It works in the short term and destroys pipeline in the medium term. Seven levers that actually move the needle:
Shift Spend Toward High-ROI Channels
The data is unambiguous: SEO delivers 748% ROI versus 36% for Google Ads. If you're allocating 30%+ of budget to paid search and under 15% to SEO and email, you're leaving money on the table. This doesn't mean killing paid - it means rebalancing toward channels with better unit economics.
Fix Data Quality First
Your SDR team sent 10,000 emails last month. 3,500 bounced. That's not a messaging problem - it's a data problem that wastes volume and rep time before you even start conversations. Meritt experienced exactly this: a 35% bounce rate that was silently inflating their outbound CAC. After switching to Prospeo's verified contact data, their bounce rate dropped under 4% and pipeline tripled from $100K to $300K per week. For outbound-heavy teams, data quality is the single highest-leverage fix for reducing acquisition spend.

Invest in Retention
Bain's research holds up: retaining a customer is roughly 5x cheaper than acquiring a new one. Every point of churn reduction directly improves your effective CAC by extending lifetime value. Skip this if you're pre-product-market-fit - retention investment only pays off when you've got something people actually want to keep using.
Segment Your CAC to Find Waste
A single blended number hides the segments where you're overspending. Break it down by channel, region, customer size, and product. We've seen teams discover that their enterprise CAC is 4x their mid-market CAC but delivers only 2x the LTV. That's a reallocation signal, not a celebration.
Shorten Payback With Expansion Revenue
Upsells and cross-sells don't carry the same acquisition cost as new logos. If your blended CAC ratio is improving while your new CAC ratio is rising, lean into that - build expansion into your product and pricing model from day one. (If you need a clean definition and examples, see Upsell vs Cross-Sell in SaaS.)
Build Referral Programs
At $150 CAC for B2B SaaS, referrals are the cheapest acquisition channel by far. Even a modest program generating 10-15% of new customers dramatically improves your blended cost per customer. The challenge is scaling them, but even small referral programs punch above their weight.
Personalize at Scale
Generic outbound is expensive outbound. McKinsey's research shows personalization can reduce acquisition costs by up to 50%, lift revenues by 5-15%, and increase marketing spend efficiency by 10-30%. Use intent data, technographic signals, and job change triggers to target prospects who are actually in-market rather than blasting cold lists.
Teams hitting 5:1 LTV:CAC ratios aren't outspending competitors - they're out-targeting them. Prospeo's 30+ filters including buyer intent, technographics, and headcount growth let you focus spend on accounts already in-market. Data refreshes every 7 days, not 6 weeks, so you're never paying to reach stale contacts.
Stop burning budget on outdated data. Target in-market buyers for free.
FAQ
What is a good customer acquisition cost?
B2B SaaS averages $239 combined; financial services runs $784; eCommerce sits around $86. The more actionable benchmark is your LTV:CAC ratio - 3:1 is the floor for sustainability, and 5:1 signals a genuinely efficient growth engine.
How do you calculate CAC correctly?
Divide total sales and marketing costs - salaries, commissions, tools, content, events, and overhead - by new paying customers acquired in the same period. Exclude renewals and expansions. Most teams undercount by omitting overhead and tool costs, which can inflate the real number by 30-50%.
What's the difference between CAC and CPA?
CAC measures the full cost to acquire a paying customer. CPA measures the cost of any conversion action - a signup, a download, a trial start. CAC is always higher because not every conversion becomes revenue, and it includes costs CPA ignores like sales salaries and tooling.
Why is my CAC increasing?
Digital ad costs rose 5.13% in 2025, and paid CAC in software climbed 12% YoY. Combine that with declining retention at 75% of software companies, and acquisition economics compound against you. Teams leaning on paid channels absorb the steepest increases because that's where cost inflation hits hardest.
How does data quality affect acquisition costs?
Bad contact data wastes outbound spend on bounced emails and wrong numbers - if 35% of your emails bounce, you lose 35% of outbound volume plus the rep time behind it. Verified data with a short refresh cycle eliminates wasted cycles that silently inflate cost per customer. Meritt cut their bounce rate from 35% to under 4% and tripled pipeline as a result.