Demographic Data: Definition, Types & Sources (2026)
You've just opened data.census.gov for the first time. Twenty dropdown menus, three geography selectors, a table ID you don't recognize, and somehow you've filtered yourself into a dataset about agricultural exports in 1997. We've spent hours wrestling with this interface, and if you've ever tried to pull detailed ACS tables, you already know the pattern: the Census Bureau's data is world-class, and the user experience is brutal.
Whether you're a researcher siting a healthcare facility, a marketer building audience segments, or a sales team filtering prospects by company size and industry, demographic data is the foundation. But finding it, collecting it properly, and actually using it without introducing bias or compliance risk - that's where most people get stuck.
What You Need (Quick Version)
What Is Demographic Data?
Demographic data describes the statistical characteristics of a population. It's the "who" - the measurable, observable traits that define groups of people. How old is this population? What do they earn? Where do they live? How are they educated?
The core variables most datasets capture include age, sex, race, ethnicity, income, education level, employment status, marital status, household size, and geographic location. These aren't abstract categories. They're the building blocks of nearly every decision that involves people, from where to build a hospital to which prospects a sales team should call first.
Context matters enormously. The U.S. Census Bureau is a gold standard for population demographics, and ACS tables can go down to granular geographies like the Census block group. A healthcare system uses that data to plan facility locations. A consumer brand uses similar variables along with purchase behavior to segment audiences. A B2B sales team translates the same concept into firmographics: industry, company size, revenue, and technology stack. The data itself is neutral. What makes it powerful - or dangerous - is how it's collected, combined, and applied.
Types of Demographic Data
Not all demographic variables serve the same purpose. Breaking them into categories helps you decide which ones actually matter for your use case.
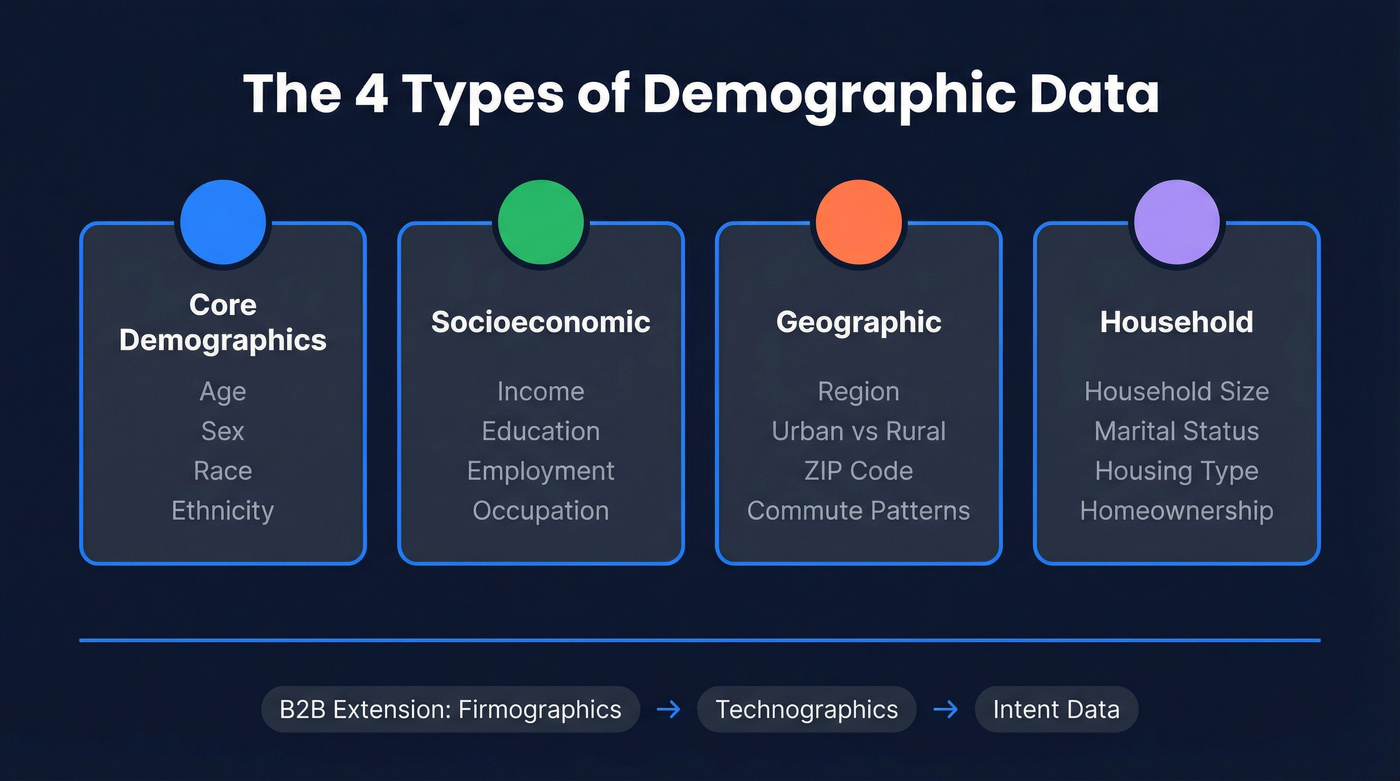
| Category | Example Variables | Typical Use |
|---|---|---|
| Core demographics | Age, sex, race, ethnicity | Population analysis, compliance |
| Socioeconomic | Income, education, employment | Market sizing, policy |
| Geographic | Region, urban/rural, ZIP code | Site selection, targeting |
| Household | Household size, marital status, housing type | Consumer segmentation |
Core demographics are the variables the Census Bureau prioritizes. Age and sex distributions drive everything from school funding formulas to Medicare projections. Race and ethnicity data underpin civil rights enforcement and health disparity research.
Socioeconomic demographics add the economic layer. Income, education attainment, and employment status are the variables marketers and policy analysts lean on most heavily. They're also the most sensitive to collection methodology - self-reported income is notoriously unreliable, which is something we've seen trip up even experienced researchers.
Geographic demographics describe where people are, not just who they are. Urban vs. rural classification, region, and commute patterns all fall here. Mapped tools like PolicyMap and SimplyAnalytics exist specifically because geographic population data is exponentially more useful when visualized.
Household demographics capture the unit people live in. Household size, marital status, homeownership, and housing type matter for real estate, consumer goods, and financial services. The ACS tracks these at remarkably fine geographic resolution.
In B2B contexts, the taxonomy extends further into firmographics, technographics, and intent data - but that deserves its own section.
Demographic vs. Psychographic vs. Behavioral
These three data types get conflated constantly. They're complementary, not interchangeable.
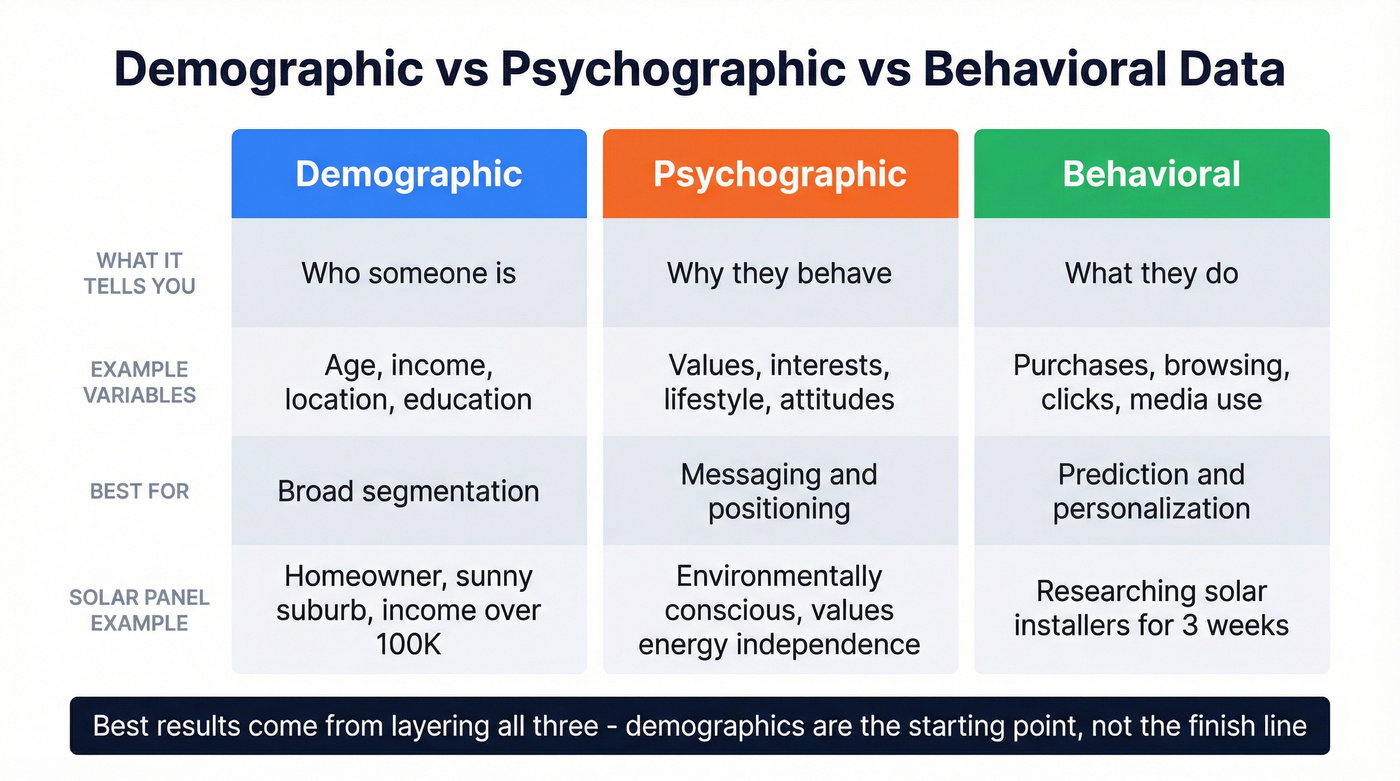
| Type | What It Tells You | Example Variables | Best For |
|---|---|---|---|
| Demographic | Who someone is | Age, income, location | Broad segmentation |
| Psychographic | Why they behave | Values, interests, lifestyle | Messaging, positioning |
| Behavioral | What they do | Purchases, browsing, media use | Prediction, personalization |
Say you're selling residential solar panels. Demographics tell you the prospect is a homeowner in a sunny suburb with household income above $100K. Psychographic data tells you they're environmentally conscious and value energy independence. Behavioral data tells you they've been researching solar installers and reading reviews for the past three weeks.
Demographics alone would give you a target list. Add psychographics and you know how to talk to them. Add behavioral data and you know when to reach out.
But here's the thing: relying on demographics alone risks stereotyping. Not every high-income suburban homeowner wants solar panels, and not every environmentally conscious consumer can afford them. Demographics are the starting point, not the finish line.
B2B Demographics: Firmographics, Technographics, and Intent
If your definition of demographics hasn't expanded beyond age and income, your targeting is already outdated - especially in B2B.
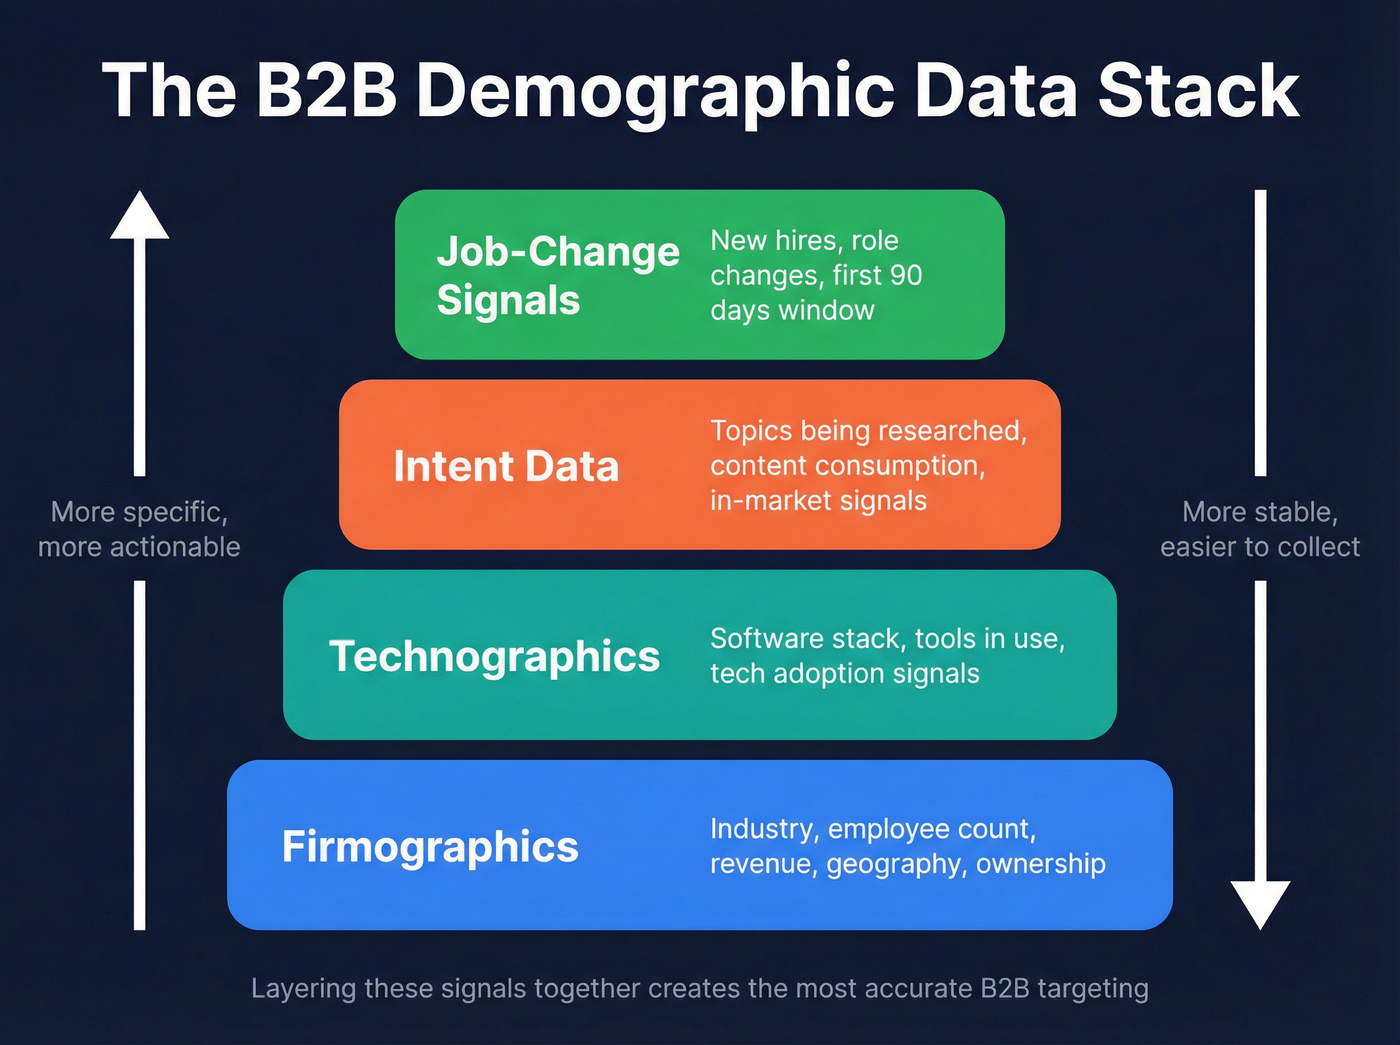
Firmographic data is the business equivalent of consumer demographics. Instead of age and income, you're segmenting by industry, employee count, annual revenue, geography, and ownership structure. These are the relatively stable traits that define a company's profile, and they're the first filter most sales teams apply. Understanding B2B demographics means recognizing that these firmographic variables carry the same segmentation weight as age and income do in consumer markets.
But firmographics alone are about as useful as knowing someone's ZIP code. The real signal comes from layering additional data types.
Technographics describe the software and technology a company uses. If you're selling a Salesforce integration, knowing which companies run Salesforce is more valuable than knowing their revenue. Technographic data comes from sources like Wappalyzer, job posting analysis, and proprietary web crawling.
Intent data captures the topics a company is actively researching. When a VP of Marketing at a mid-market SaaS company starts consuming content about "email deliverability tools," that's an intent signal - they're in-market or getting close.
Job-change signals add another layer. New executive hires often trigger technology evaluations and vendor changes. The consensus on r/sales is that the first 90 days of a new VP hire is the single best window for outbound outreach.
Several platforms now combine these layers into a single search interface. Prospeo, for example, pairs firmographic filters with intent data across 15,000 topics and job-change signals - the kind of layered B2B profiling that used to require stitching together three or four separate tools.
You just read about layering firmographics, technographics, and intent data. Prospeo combines all three in one platform - 30+ filters across 300M+ profiles, intent signals on 15,000 topics, and job-change alerts. Every email is 98% verified. Every record refreshed every 7 days.
Stop stitching four tools together. Search layered B2B demographics in one place.
Where to Find Demographic Data
Free Government Sources
The U.S. government publishes more demographic data than most people realize. The challenge isn't availability - it's usability.
data.census.gov is the primary portal for Census Bureau tables, including American Community Survey and decennial census releases. It covers age, sex, race, ethnicity, income, education, employment, housing, and commute patterns, and many ACS tables go down to geographies as fine as the Census block group. The data is extraordinary. The interface is a war crime. Anyone who's tried to pull ACS data by block group knows exactly what I mean.
Bureau of Labor Statistics / Current Population Survey provides monthly labor force data - employment, unemployment, earnings, and hours worked - broken down by demographic characteristics.
USAFacts takes Census and federal data and wraps it in visualizations that actually make sense. If you need population demographics without fighting the Census Bureau's UI, start here.
The Federal Reserve's 2024 Small Business Credit Survey is an underrated source. It includes owner demographics by state and metro area - nearly 6% of small employer businesses are majority-owned by a person with a disability, roughly 4% are LGBTQ-owned, and about 9% are veteran-owned. This granular breakdown doesn't show up in many other free, state-and-metro-cut datasets.
IPUMS provides harmonized, linked microdata from Census, CPS, and international sources. Free for registered researchers and invaluable for longitudinal analysis.
Paid Analysis Platforms
When you need demographics mapped, visualized, or cross-tabulated without writing SQL, these are the tools worth knowing.
| Tool | Best For | Approx. Pricing |
|---|---|---|
| SimplyAnalytics | Mapped demographic analysis | ~$5K-$15K/yr (institutional) |
| PolicyMap | Policy, planning, CRA | Free public edition; full ~$2.5K-$10K/yr |
| Social Explorer | Academic research | ~$100/yr individual; $5K+/yr institutional |
| Esri / ArcGIS | Enterprise GIS | $100-$500/yr personal; $5K-$50K+/yr enterprise |
| Statista | Quick market stats | From ~$199/mo |
SimplyAnalytics and PolicyMap are the workhorses for site selection, trade area analysis, and community needs assessments. PolicyMap's free public edition is surprisingly capable for basic mapping. Esri is the enterprise standard for GIS but comes with enterprise pricing and a learning curve to match.
B2B Data Platforms
For business demographic data - firmographics, contact information, and buying signals - the landscape looks different. Here's how the three major tiers break down.

Prospeo leads on data quality and accessibility. The free tier gives you 75 verified emails and 100 Chrome extension credits per month - enough to test whether the data holds up before committing a dollar. Paid plans run roughly $0.01 per email with no contracts. Email accuracy sits at 98% with a 7-day data refresh cycle.
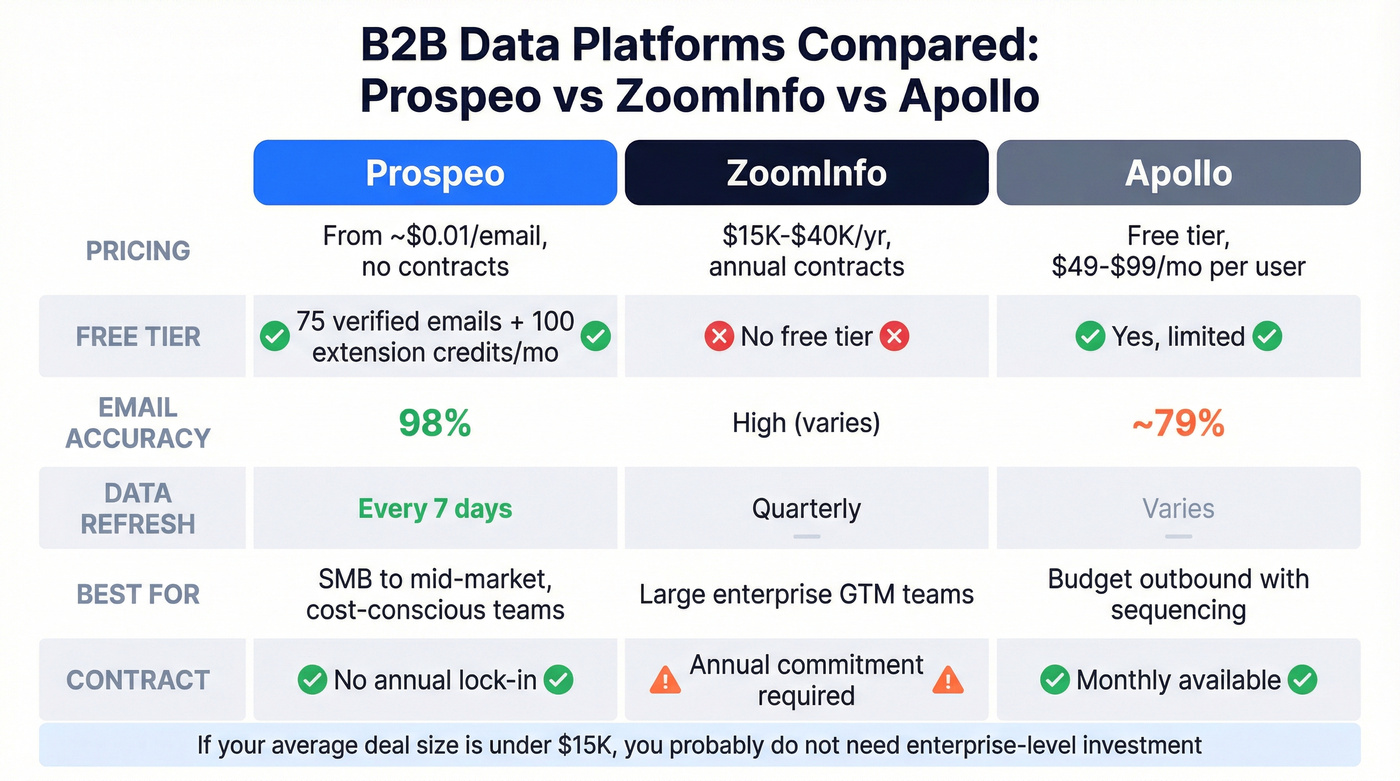
ZoomInfo ($15K-$40K/yr) is one of the most widely used enterprise B2B databases in the U.S., but it costs 10-20x more and is typically sold on annual contracts. It's the right choice for large GTM teams with the budget to match.
Apollo (free tier; $49-$99/mo/user) is the budget-friendly option with built-in sequencing. Email accuracy sits around 79%, which means more bounces and potential domain reputation damage at scale. Skip this if your outbound volume is high enough that a few percentage points of accuracy translate into real deliverability problems.
Let's be honest: if your average deal size is under $15K, you almost certainly don't need ZoomInfo-level investment. Start with a self-serve platform, prove the ROI, and scale from there.
How to Collect Demographic Data
If you're collecting demographic data through surveys, forms, or intake processes, design decisions will determine both data quality and completion rates.
Define your purpose before writing a single question. Every demographic question should directly support a stated goal. If you're targeting a scholarship for Black photographers, you don't need to ask about sexual orientation or household income.
Use a two-step approach for gender. The Williams Institute guidance recommends asking sex assigned at birth first, then gender identity with options including Trans woman, Trans man, Non-binary, Genderqueer/Gender non-conforming, and "Different identity: Please specify."
Replace "Other" with "Different identity: Please specify." The word "Other" signals that someone's identity is an afterthought. This small change meaningfully reduces opt-outs from respondents who feel marginalized by the framing.
Cap options at roughly 12 per question. More than that overwhelms respondents and increases abandonment. For categories with many possible responses, include the most common options plus a free-text field.
Alphabetize response options. Option ordering creates an implicit hierarchy. Listing "White" first in a race question suggests a default norm. Alphabetizing avoids this.
Allow multiple selections. Use checkboxes, not radio buttons, for identity questions. People who identify with multiple racial or ethnic categories shouldn't be forced to pick one.
Explain why you're collecting the data, then keep it short. Two to three sentences covering purpose, who sees the responses, and your privacy policy. State the time commitment upfront - "This survey takes approximately 4 minutes" reduces abandonment. In our experience, pilot testing with 50-100 people catches the majority of design problems before they scale. Involve diverse stakeholders in survey design and compensate them for their time.
How Demographics Are Used Across Industries
Healthcare
The U.S. healthcare system represents $4.9 trillion in annual spending - almost $1 of every $6 produced and consumed in the country. Demographics drive decisions at every level.
ACS age breakdowns by sex, race, and ethnicity at the Census block group level are the foundation for facility siting. A pediatric hospital network evaluating expansion locations needs to know where young families are concentrated and where they're growing. Billing and coverage planning relies on estimating Medicare, Medicaid, employer-insured, and uninsured populations by area.
One stat that doesn't get enough attention: roughly 7.3 million of 127.5 million U.S. households lack internet access entirely, and about 192,000 still use dial-up. For telehealth planning, that's not a rounding error - it's a coverage gap that population-level data makes visible.
Marketing Segmentation That Works
The latest McKinsey ConsumerWise survey - 25,998 consumers across 18 markets - illustrates why demographics alone miss the picture. U.S. consumers now report 3+ more hours of free time per week compared to 2019, with nearly 90% of that additional time going to solo activities. Food delivery's share of global food service spending jumped from 9% to 21% between 2019 and 2024.
These are behavioral shifts that demographic profiles alone wouldn't predict. A 35-year-old urban professional in 2019 and the same person today have identical demographics but dramatically different consumption patterns. Demographics define the audience, but behavioral and psychographic data explain what they'll actually do.
Real Estate & Urban Planning
Site selection for commercial and residential development runs on ACS data - household composition, median income, commute patterns, and housing stock by geography. The difference between a good site and a bad one often comes down to demographic trends at the ZIP or tract level.
Mapped tools like PolicyMap and SimplyAnalytics are the standard here, overlaying population characteristics onto geographic boundaries so you can visually compare trade areas without exporting CSVs into a GIS platform.
B2B Sales: From Firmographics to Pipeline
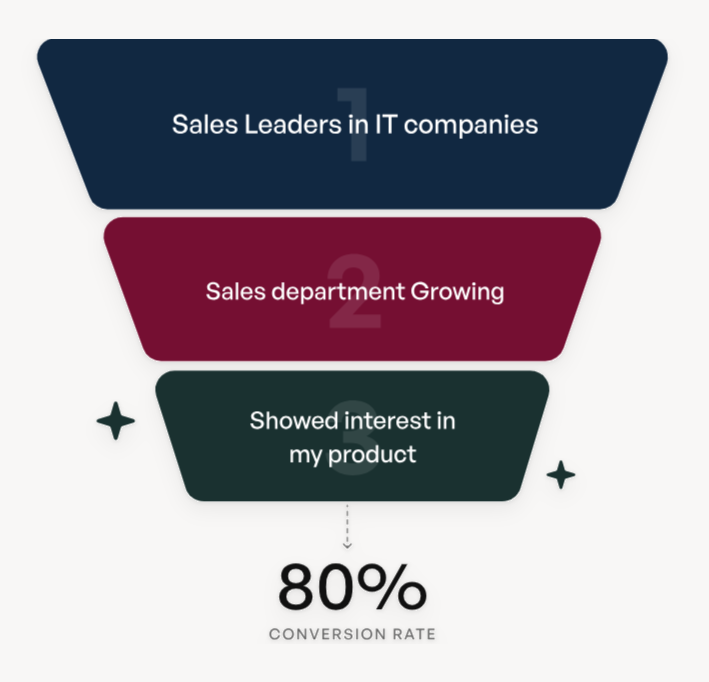
Most B2B sales teams are still filtering prospects by job title and company size alone. That's frustrating, because they're missing intent signals, tech stack data, funding events, and job-change triggers - the B2B equivalent of trying to sell solar panels based on ZIP code without knowing whether someone's actually researching installers.
Firmographic + intent + technographic data is the B2B version of the demographic-psychographic-behavioral stack we covered earlier. That layered approach is where prospecting stops being a numbers game and starts producing qualified pipeline.
Common Collection Mistakes
Sampling bias is the most common and most damaging error. Your sample doesn't represent the population you're studying. Online-only surveys systematically underrepresent older adults, rural populations, and lower-income households. If your sample skews, your conclusions skew with it.
Measurement error follows close behind. Ambiguous questions produce ambiguous data. "What is your income?" means different things to different people - gross vs. net, individual vs. household, annual vs. monthly. Specificity in question design eliminates interpretation variance.
Lack of standardization kills comparability. When multiple people or locations administer the same survey differently, your data can't be compared across sites. Standardized protocols and training are non-negotiable.
Researcher bias shapes what you find. If you expect a certain pattern, you'll unconsciously design questions and interpret results in ways that confirm it. Pre-registration and peer review help, but awareness is the first defense.
Provenance blindness is the subtlest trap. Large administrative datasets - hospital records, tax filings, enrollment databases - weren't collected for research. As researchers have documented, unexpected patterns in these datasets are often data errors, not meaningful signals. Always interrogate where the data came from and what it was originally designed to capture. A dataset with 50 million records and systematic coverage gaps will produce worse conclusions than a well-designed survey of 2,000 people. Size isn't a substitute for representativeness.
Privacy and Compliance
Collecting demographic data without a clear purpose is a liability, not an asset. Three regulatory frameworks matter most.
GDPR treats data that can identify or be linked to an individual as personal data - including common demographic fields like age, gender, and location. It places stricter requirements on sensitive categories like race/ethnicity and health-related data.
CCPA (and similar laws spreading across U.S. states) gives consumers rights around access and deletion of personal information businesses collect about them.
HIPAA treats patient-linked demographic information collected in a healthcare context as Protected Health Information when it's connected to an identifiable individual.
The principle across all three: collect only what you need, explain why, secure it properly, and delete it when the purpose is fulfilled. If you're doing outbound or lead gen, it's also worth aligning your process with a practical GDPR playbook.
The Future of Demographic Data
The way we collect and use population-level information is shifting faster than most organizations realize. A 2024 review in Population and Development Review identifies five emerging source categories reshaping the field.
Big population microdata is becoming accessible at unprecedented scale. The Census Bureau's digitization effort has processed 4+ petabytes of imagery to create complete-count records from 1950 through 1990, enabling researchers to link individuals across decades.
Digital trace data - social media activity, search behavior, app usage - offers real-time demographic signals that surveys can't match for speed, though it skews toward younger, more connected populations.
Geospatial data from satellites, mobile devices, and IoT sensors adds a spatial dimension that traditional surveys capture only crudely. Advances in classical collection methods - better sampling frames, multilingual instruments, community-based enumeration - are closing coverage gaps that have persisted for decades. Genetic data remains the most controversial addition, useful for ancestry and health research but fraught with privacy concerns.
The critical caveat: all five new sources still rely on traditional surveys and censuses as ground truth. Digital traces can supplement the ACS, but they can't replace it. In B2B, the parallel is clear - real-time intent signals, job-change data, and funding events are the "digital traces" of the business world, and they're already transforming how sales teams identify and prioritize prospects. Demographic data remains the foundation, but the layers built on top of it are where competitive advantage lives in 2026. If you want to operationalize those layers, start with signal-based outbound and a clear prospecting workflow.
Demographic data is the starting point. The finish line is reaching the right buyer at the right moment. Prospeo layers firmographic, technographic, and intent data so you target companies actively researching your solution - with verified emails at $0.01 each and 125M+ direct dials.
Turn demographic insight into pipeline. 75 free emails to prove it.
FAQ
What are the most common types of demographic data?
The standard variables are age, sex, race/ethnicity, income, education level, employment status, marital status, household size, and geographic location. In B2B, firmographic equivalents include industry, company size, annual revenue, and technology stack. Most government and commercial datasets start with some combination of these core variables.
Where can I get free demographic data?
The U.S. Census Bureau (data.census.gov) is the most comprehensive free source, covering population characteristics down to block-group level in many ACS tables. USAFacts offers the same federal data with far better visualizations. The Bureau of Labor Statistics and Federal Reserve Small Business Credit Survey provide specialized breakdowns at no cost.
What's the difference between demographic and psychographic data?
Demographic data describes who someone is - age, income, location - using directly measurable traits. Psychographic data describes why they behave as they do - values, interests, lifestyle preferences. Effective segmentation combines both: demographics for targeting, psychographics for messaging.
Is demographic data personal data under GDPR?
Yes. GDPR treats any data that can identify or be linked to an individual as personal data, and common demographic fields like age, gender, and location qualify. Race/ethnicity and health-related fields face even stricter "special category" requirements, demanding explicit consent or a specific legal basis.
How do I use demographic data for B2B prospecting?
Layer firmographic filters like industry, headcount, and revenue with technographic and intent signals to identify in-market buyers. Tools like Prospeo let B2B teams move beyond static lists to dynamic, signal-driven prospecting - combining 30+ search filters with buyer intent across 15,000 topics and job-change alerts at roughly $0.01 per verified email.