What Is Firmographic Segmentation? A Practical Guide for B2B Teams
Average cold email reply rates dropped from 6.8% to 5.8% in the last year. When every percentage point matters, spraying messages at a generic "companies with 50+ employees" list doesn't cut it anymore. Precision targeting starts with a clear firmographic segmentation definition - and most teams still get it wrong.
What Firmographic Segmentation Actually Means
Firmographic segmentation is the practice of grouping companies by shared organizational attributes - industry, size, revenue, location, funding status - so you can target the right accounts with the right message. It's the B2B equivalent of demographic segmentation for consumers. At the most basic level, you're answering three questions: What industry? How big? Where?
That's the foundation. Here's the critical caveat: firmographics alone miss buying timing. Layer them with intent signals, or you're just building a really organized phone book.
Firmographic vs. Demographic
| Firmographic | Demographic | |
|---|---|---|
| Unit | Companies | Individuals |
| Variables | Revenue, headcount, industry | Age, income, education |
| Use case | B2B account targeting | B2C audience targeting |
Firmographics tell you who the company is, technographics tell you how it runs, and intent data tells you what it's actively researching. You need all three, but firmographics are the starting layer.
Core Firmographic Variables
88% of B2B marketers already use third-party firmographic data. Eight variables form the backbone of most segmentation models.
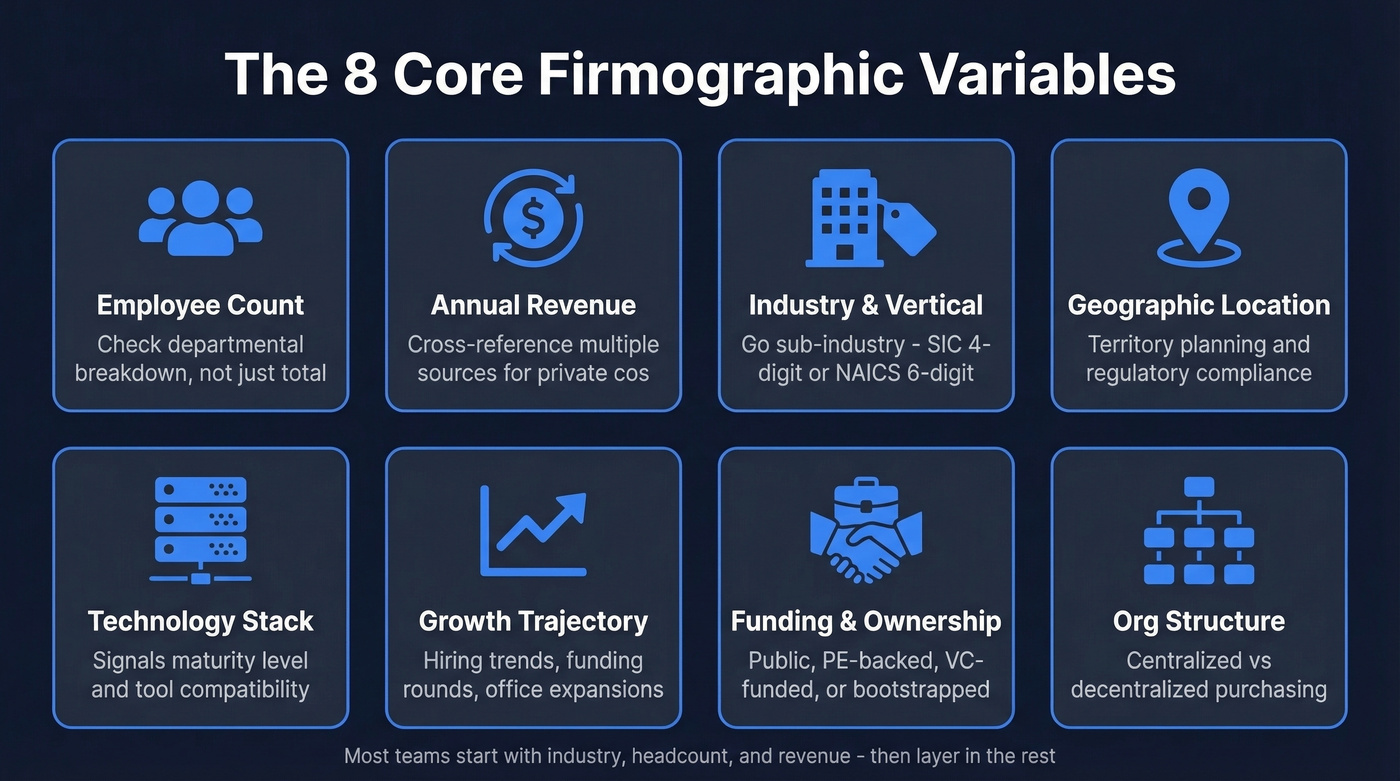
1. Employee count. Headcount is the most common sizing metric, but it misleads without context. A 200-person company with 150 engineers looks nothing like one with 80 in sales. Check departmental composition for the real story.
2. Annual revenue. The gold standard for sizing, except private-company revenue is almost always estimated. Cross-reference multiple sources before you trust any single number.
3. Industry and vertical. Sub-industry granularity matters enormously. ZoomInfo lists 339,506 companies under "Software." That's not a segment - that's a haystack. SIC codes use a 4-digit hierarchy and NAICS uses 6 digits for finer resolution, but neither taxonomy maps cleanly to modern digital business models, which is why many teams supplement with custom tags.
4. Geographic location. Useful for territory management and regulatory requirements like GDPR or state-level compliance, but don't over-index on geography alone.
5. Technology stack. A company running Salesforce, Marketo, and Snowflake signals a very different maturity level than one running a lightweight CRM and spreadsheets. This is where firmographics and technographics overlap, and it's one of the most underused filters we see in practice.
6. Growth trajectory. Headcount trends, funding rounds, office expansions. These are timing signals you can layer onto firmographics, and they're some of the most valuable attributes you can track because they hint at budget and urgency.
7. Funding status and ownership. Whether a company is public, PE-backed, or VC-funded changes buying behavior. A Series B company that just closed a round operates differently than a bootstrapped firm at the same revenue.
8. Organizational structure. Centralized vs. decentralized purchasing changes your entire sales motion. One VP making all tech decisions is a different game than five regional buying committees.
You just read about the eight firmographic variables that matter. Prospeo lets you filter by all of them - industry, headcount, revenue, funding, growth trajectory, tech stack - across 300M+ profiles with 30+ search filters. Layer in buyer intent from 15,000 Bombora topics so you're not building a phone book, you're building a pipeline.
Stop segmenting in spreadsheets. Start segmenting where the data lives.
Why Segmentation Drives Revenue
Teams that segment firmographically see 73% larger deal sizes and 70% more qualified leads, plus a 25% increase in sales productivity. That's not marginal. It's a fundamentally different pipeline.
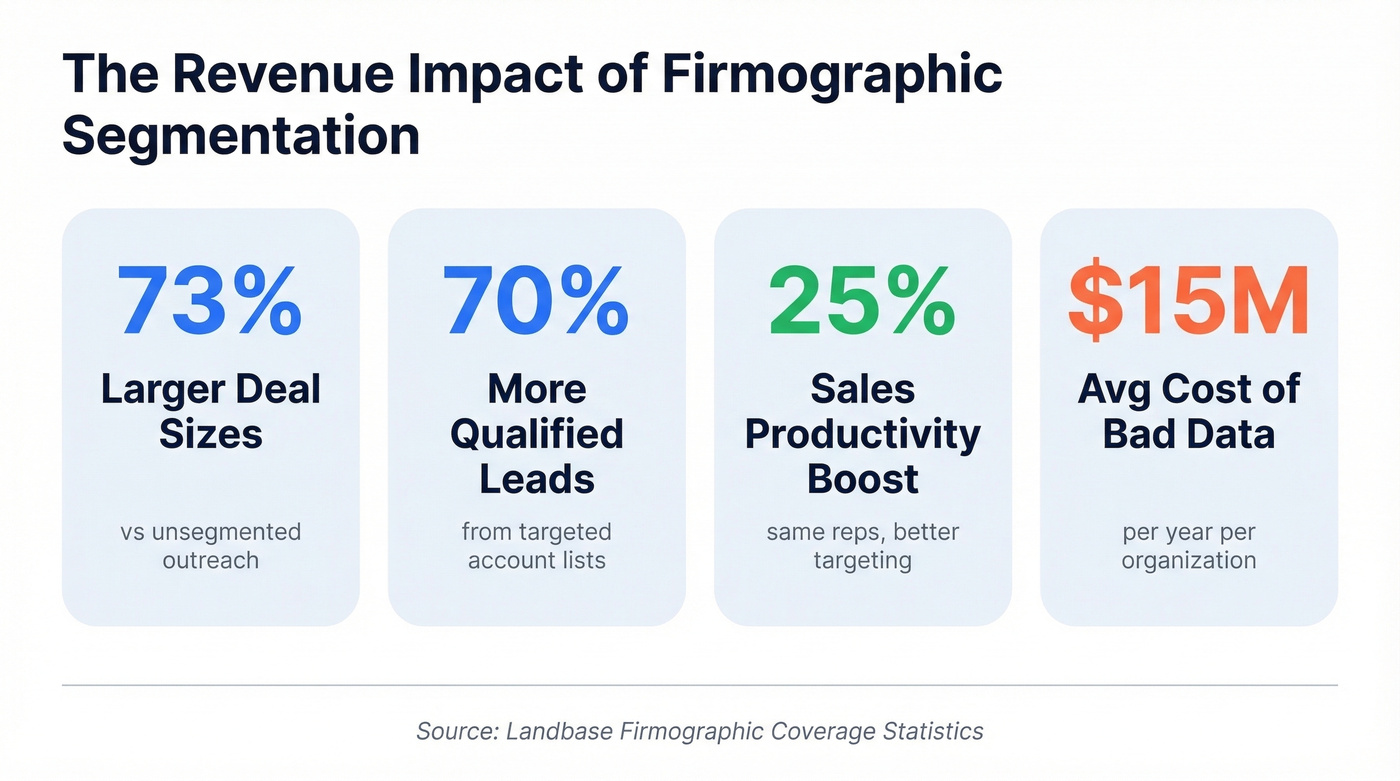
Let's look at a concrete example. A mid-market team selling compliance software was emailing anyone in "financial services." They tightened the segment to financial services companies with 200-1,000 employees that had raised a recent funding round. Every message referenced a pain point the segment actually shared - regulatory readiness during rapid scaling. Same product, same reps, dramatically better results.
B2B SaaS opportunity-to-won rates typically range from 20-35%. The gap between bottom and top often comes down to whether you're talking to the right companies in the first place. Poor data quality costs organizations an average of $15M annually, much of it from targeting the wrong accounts.
What Most Guides Get Wrong
Every firmographic segmentation guide lists the same variables and calls it a day. That misses the point entirely.
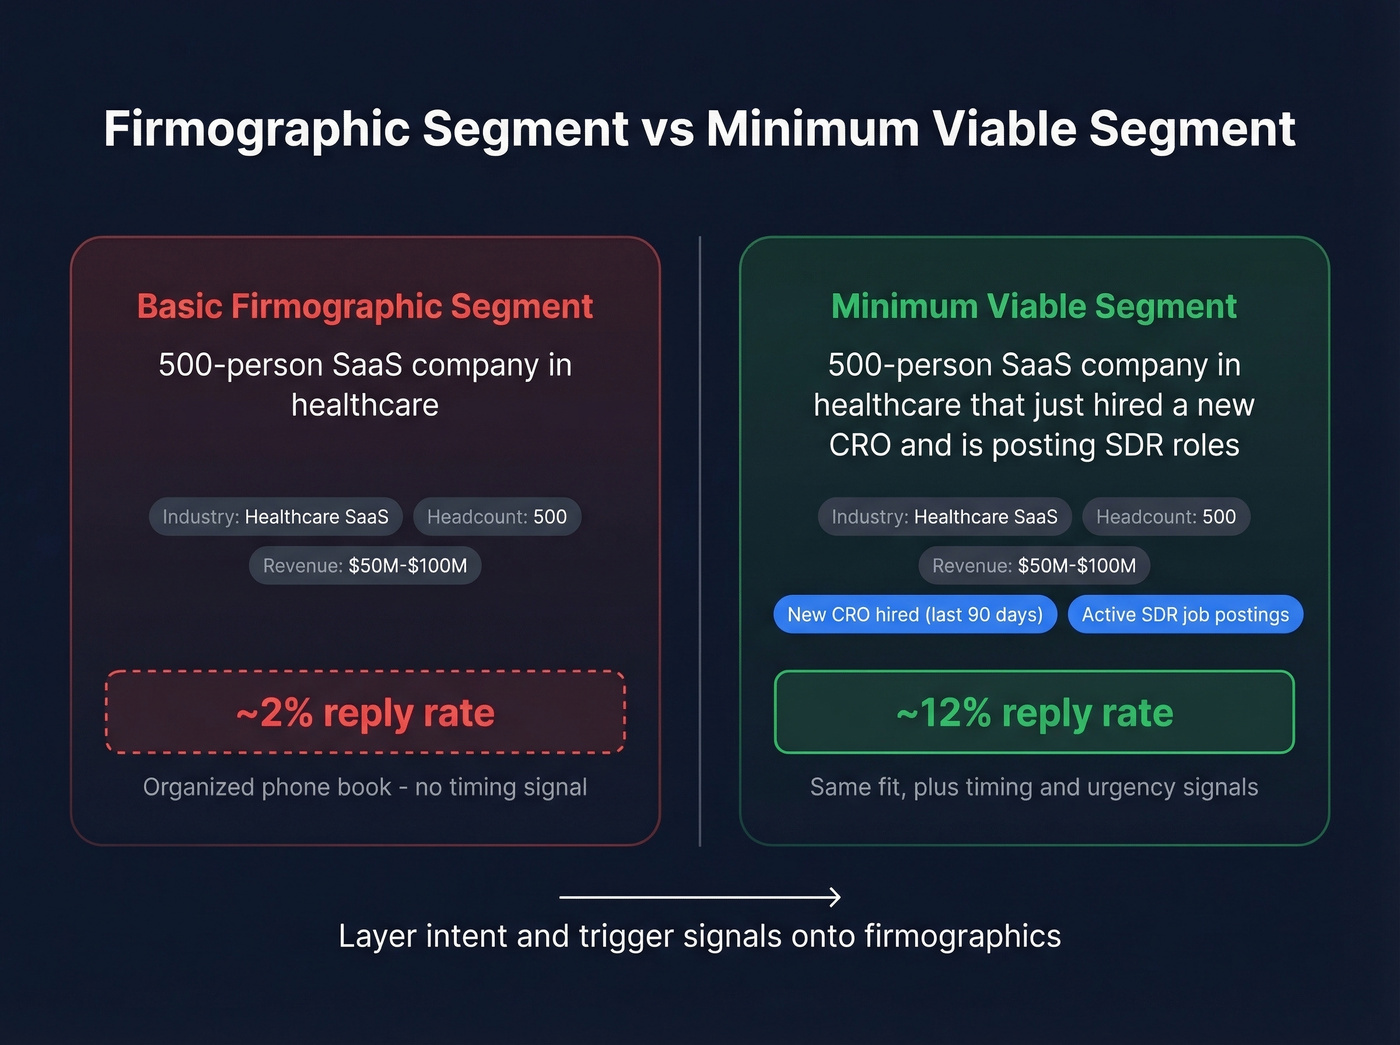
Static attributes tell you who could buy. They don't tell you who will buy now. The Minimum Viable Segment reframes this: it's the smallest group of buyers who share the same struggle, at the same moment, with the same urgency to act. A 500-person SaaS company in healthcare is a firmographic segment. A 500-person SaaS company in healthcare that just hired a new CRO and is posting SDR roles - that's an MVS. The difference between those two lists is the difference between a 2% reply rate and a 12% one.
In our experience, teams that keep total segments between 3 and 6 actually activate them. More than that, and you build beautiful segments nobody uses. The consensus on r/sales backs this up - people consistently warn against over-engineering your ICP before you've even validated the first segment.
Common Mistakes
Relying on firmographics alone. Firmographics confirm fit. Intent and technographic data confirm readiness. Skip the second layer and you're guessing.
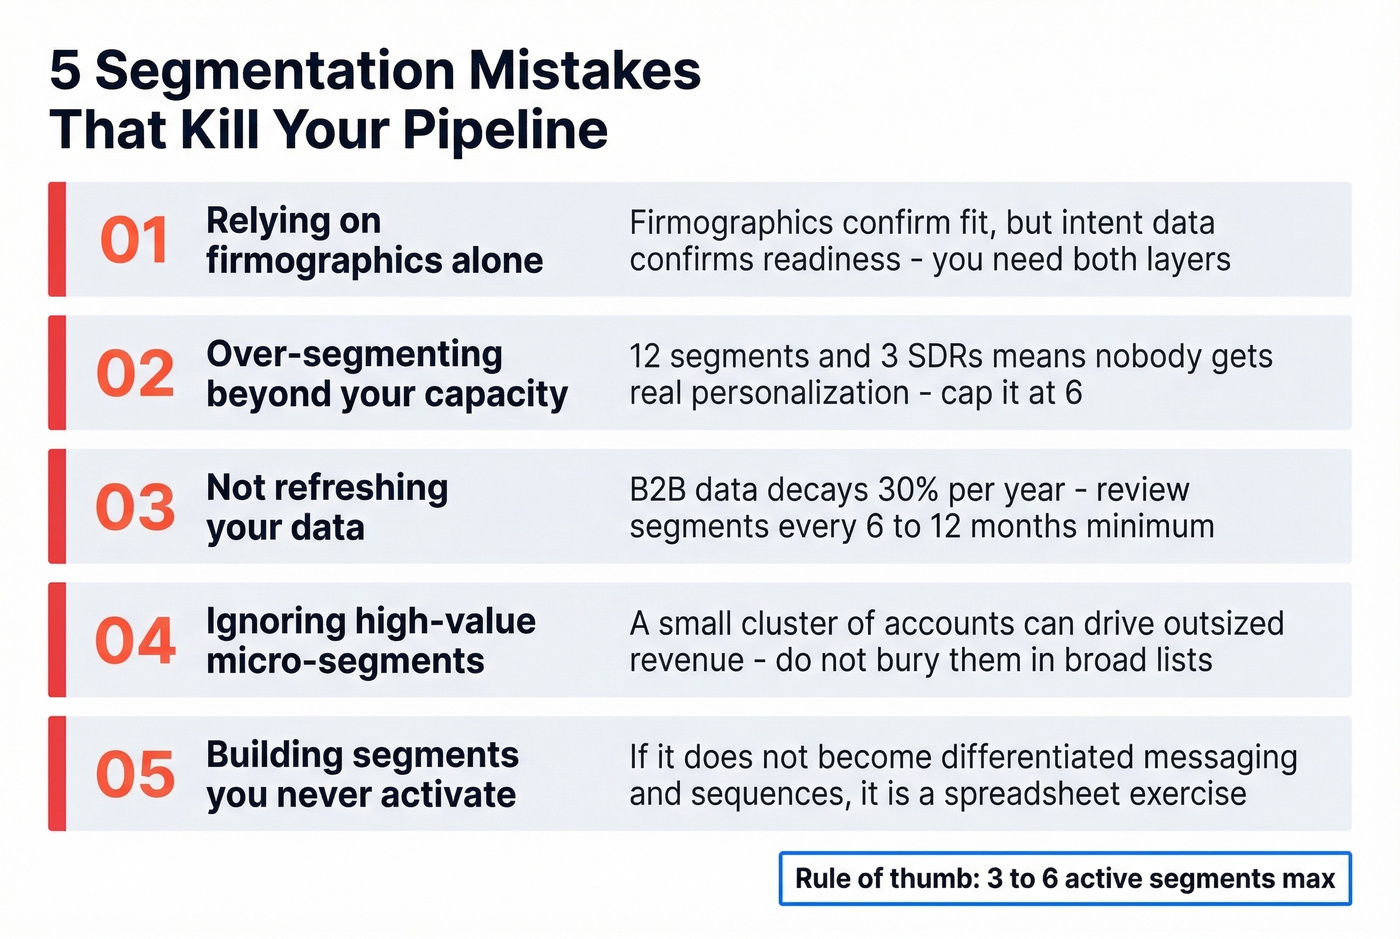
Over-segmenting. Twelve segments and three SDRs means nobody gets personalized outreach. Cap it at 6.
Not refreshing data. B2B data decays roughly 30% per year. Review segments every 6-12 months minimum, or you'll be emailing people who left the company two quarters ago.
Ignoring micro-segments. A small cluster of accounts can drive disproportionate revenue. Don't bury them inside a broad segment just because the list is short.
Building segments you never activate. If a segment doesn't translate into differentiated messaging and sequences, it's a spreadsheet exercise. We've seen teams spend weeks on segmentation frameworks that never make it into their outbound tools.
Where to Get Firmographic Data
The provider market ranges from enterprise platforms to self-serve tools:
| Provider | Database Size | Starting Price | Best For |
|---|---|---|---|
| Prospeo | 300M+ profiles | Free tier; ~$0.01/email | Self-serve, no contracts |
| ZoomInfo | 110M+ companies | ~$15k-$40k/year | Enterprise GTM suites |
| Apollo | 275M+ contacts | $49/user/month | SMB prospecting |
| Lusha | 100M+ profiles | ~$22/user/month | Quick lookups |
| Breeze (Clearbit) | 44M+ companies | ~$30-$700/month | HubSpot-native enrichment |
| Dun & Bradstreet | Enterprise-scale | Custom pricing | Compliance-heavy use cases |

Here's the thing: if your average deal size is under five figures, you don't need a five-figure data platform. Most mid-market teams are better served by self-serve tools with strong filters and fresh data than by enterprise suites they'll use at 20% capacity. Prospeo offers 30+ search filters - including headcount growth, funding, revenue, and technographic signals - with a 7-day data refresh cycle versus the 6-week industry average. That freshness matters when firmographic data decays as fast as it does.
If you're comparing providers, start with a shortlist of the best B2B database options, then narrow by coverage and refresh rate. The NAICS Association is also useful for appending industry classification codes to existing lists. And don't overlook surveys and form fields - they remain an underrated way to collect firmographic data directly from prospects, especially for attributes like organizational structure that third-party databases rarely capture well.
If you're enriching lists from domains, data enrichment is usually the fastest way to fill missing firmographics.
B2B data decays 30% per year, and stale firmographics wreck every segment you build. Prospeo refreshes all 300M+ records on a 7-day cycle - six times faster than the industry average. At $0.01 per email with 98% accuracy, you get segments that actually convert instead of costing you $15M in bad data.
Fresh firmographic data weekly. No contracts. No sales calls required.
FAQ
What are the main firmographic variables?
The eight core variables are industry, employee count, annual revenue, geographic location, technology stack, growth trajectory, funding/ownership status, and organizational structure. Most teams start with industry, headcount, and revenue, then layer in technographics and intent data for sharper targeting.
How does firmographic segmentation differ from demographic segmentation?
Firmographic segmentation groups companies by organizational attributes like revenue, headcount, and industry for B2B targeting. Demographic segmentation groups individuals by personal traits like age, income, and education for B2C. Think of firmographics as demographics for businesses.
How often should you refresh firmographic data?
Every 6-12 months minimum, since B2B data decays roughly 30% per year. Platforms with weekly refresh cycles help keep segments accurate without manual audits. Stale data is the top reason segments underperform.