Go-to-Market Strategy Analysis: Fix Your GTM Without Rebuilding It
You've defined your ICP, crafted your value prop, picked your channels. Revenue is still flat. The instinct is to tear everything down and start over - but that's the wrong move. Run a proper go-to-market strategy analysis first; rebuild only if the math can't support your targets.
New product launches drive roughly 25% of total revenue and profits for the average company, yet 60-80% of those launches underperform expectations. The problem isn't the strategy itself. It's that nobody runs a structured diagnostic to find why it's underperforming. Below is a framework, 2026 SaaS benchmarks, and a win-loss methodology to find what's broken without starting from scratch.
What Is a GTM Analysis?
A GTM strategy is the plan - ICP, positioning, channels, pricing. A go-to-market strategy analysis is the diagnostic layer that evaluates whether that plan is working. Strategy is a one-time creation exercise; analysis is ongoing, uncomfortable, and iterative.
As the r/SaaS community puts it bluntly: GTM isn't a deck - it's an operating system that produces decisions and materials. If your GTM "strategy" lives in a static PDF nobody references after launch week, you don't have a strategy. You have a souvenir.
Five GTM Failure Patterns
Before you build a spreadsheet, run through these five questions. If you answer "yes" to two or more, you've found your starting point. In Gartner's 2025 sales survey, 69% of B2B buyers reported inconsistencies between website messaging and what sellers told them - so start by looking inward.
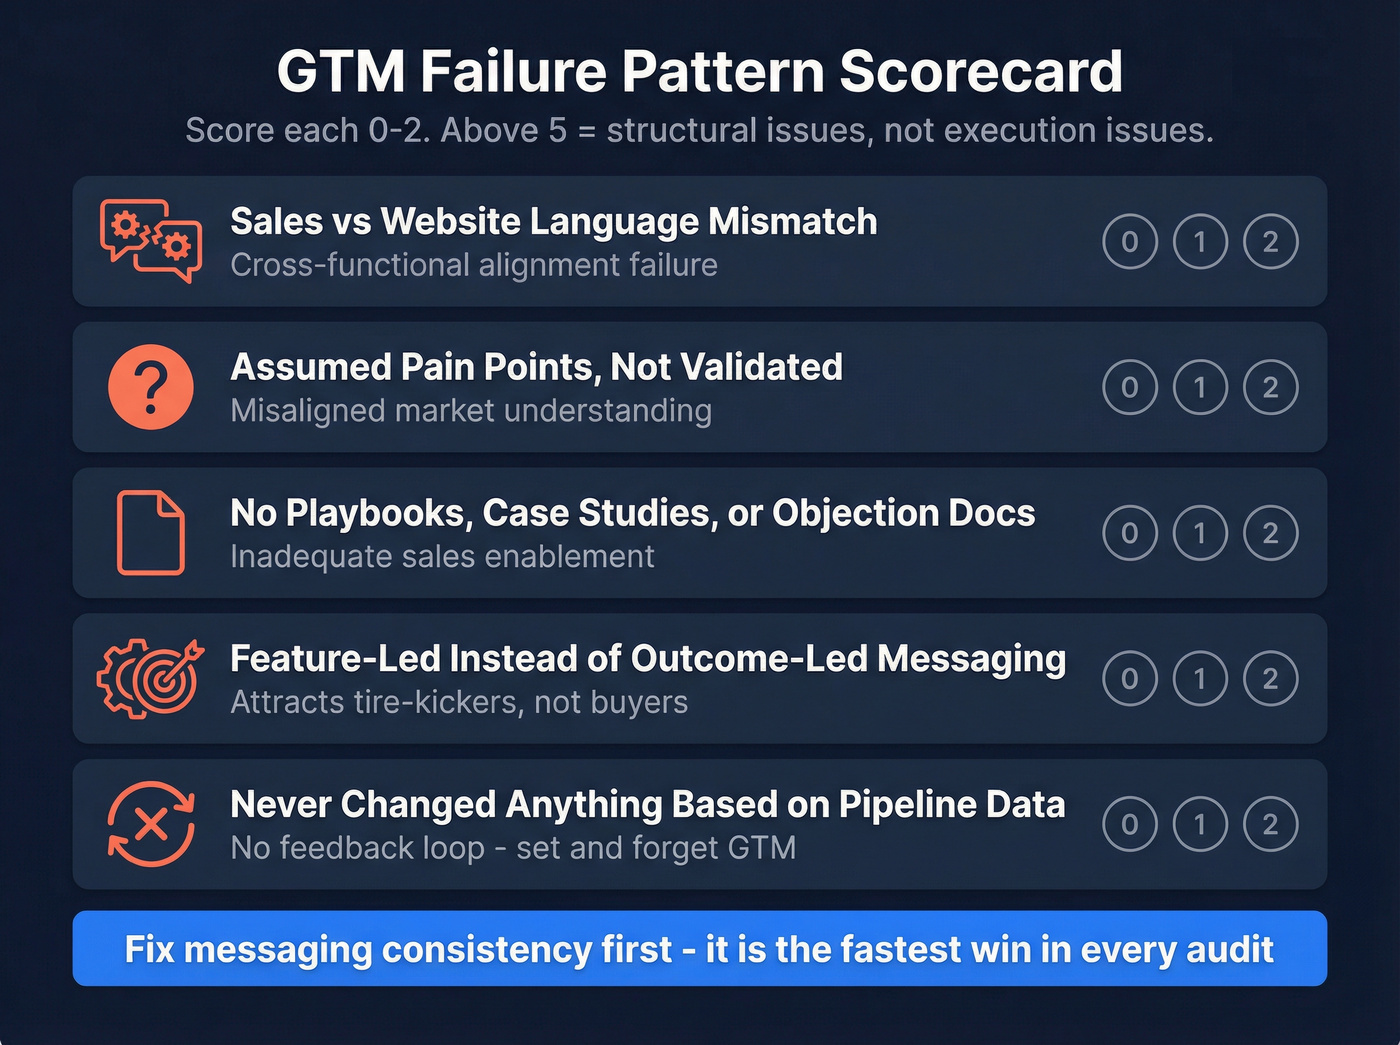
- Is your sales team using different language than your website? Cross-functional alignment failure. If your own team can't stay consistent, buyers notice immediately.
- Are you validating pain points, or assuming them? Misaligned market understanding is the most common GTM failure mode.
- Do your reps have playbooks, case studies, and objection-handling docs? Inadequate sales enablement kills deals that positioning already won.
- Are you leading with features or outcomes? Feature-led messaging attracts tire-kickers. Outcome-led messaging attracts buyers.
- When did you last change anything based on pipeline data? If the answer is "never," you're running a set-and-forget GTM with no feedback loop.
Score each pattern 0-2 (0 = not us, 1 = partially, 2 = definitely). A total above 5 means your GTM has structural issues, not execution issues. Don't touch channels until messaging consistency is fixed - that's the fastest win in every audit we've run.

Step-by-Step GTM Analysis Framework
Set Your Objective and Constraints
Most GTM analyses fail before they start because nobody defines what "working" means. Pick one primary objective: revenue growth, market share, adoption velocity, or profitability. Then name your constraints - budget ceiling, team size, timeline, regulatory limits.
This sounds obvious, but we've watched teams spend weeks analyzing a GTM motion without agreeing on whether they're optimizing for growth or margin. Those are different analyses with different answers.
Separate Fuel From Analysis
Before interpreting anything, catalog your data sources and tag their reliability. Your "fuel" falls into three buckets:
Hard data includes CRM pipeline reports, closed-won/lost records, product usage analytics, and financial statements. These are your primary inputs. Soft data covers win-loss interviews, sales call recordings, customer support tickets, and NPS verbatims - valuable but subjective, so triangulate before trusting. External signals include competitor pricing pages, hiring patterns, industry benchmarks, and public filings from sources like SEC EDGAR or BLS industry data. These ground your analysis in market reality rather than internal assumptions.
Tag each source with a confidence level (high/medium/low) and a date. Stale data produces stale conclusions.
Run an Honest Internal Assessment
Companies drink their own Kool-Aid. The first step in any GTM diagnostic is a cross-functional stakeholder SWOT - and the inputs need to be anonymous. When the VP of Sales knows the CEO is reading their answers, you get polished half-truths instead of useful data.
Pull a cross-section from marketing, sales, product, and CS. Ask them to identify strengths that represent true differentiation (not table stakes) and weaknesses they'd never say in an all-hands. The gap between what leadership believes and what the frontline experiences is where your GTM is actually breaking. In our experience, the fastest win is usually aligning sales talk tracks to the homepage - it costs nothing and fixes the most common failure pattern overnight.
Validate Your Market Sizing
If your TAM came from a top-down industry report and a prayer, rebuild it bottom-up. The formula: number of potential customers x average revenue per customer. Top-down sizing is fast but wildly inaccurate. Bottom-up is more defensible because you can show your work using verifiable inputs like census data, industry directories, and firmographic databases.
Filter your TAM into SAM (reachable by geography, segment, and product fit) and SOM (realistically capturable given current resources and competition). Here's the hard truth: if your SOM doesn't support your revenue targets, stop optimizing execution and change the plan. No amount of A/B testing fixes bad market math.
Build Segment-Need-Feature-Channel Linkages
This is the step most analyses skip, and it's the one that matters most. For each target segment, map a chain: Segment -> Primary Need -> Feature/Capability That Solves It -> Channel Where That Segment Discovers Solutions. Then score each linkage on strength (1-5) based on evidence, not intuition.
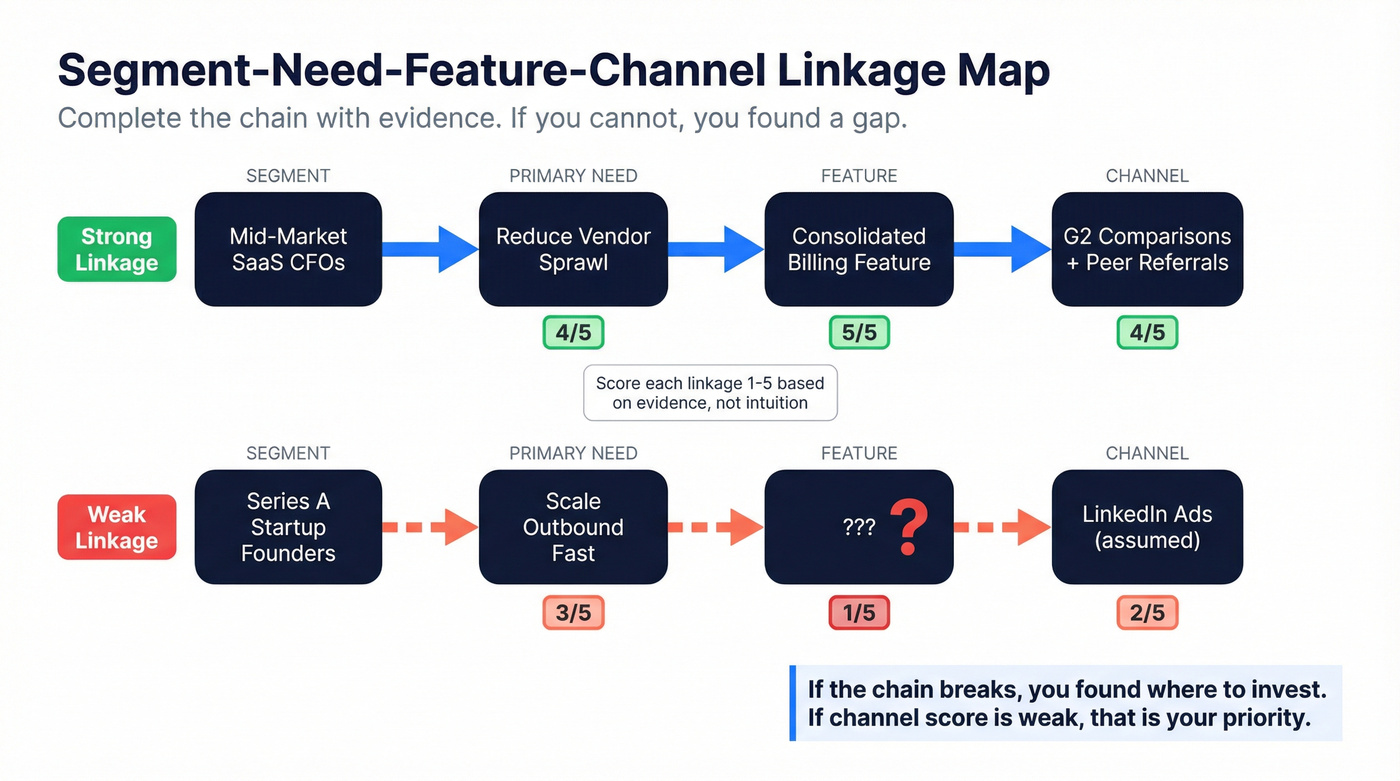
For example: "Mid-market SaaS CFOs -> need to reduce vendor sprawl -> our consolidated billing feature -> found via G2 comparisons and peer referrals." If you can't complete the chain with evidence, you've found a gap. If the channel score is weak, you know where to invest. This linkage map replaces the vague "we target mid-market" with a testable, measurable system.
Diagnose Your GTM Motion Fit
Use self-serve/PLG if your average deal is under $5K. The unit economics don't support demos and proposals at that price point.
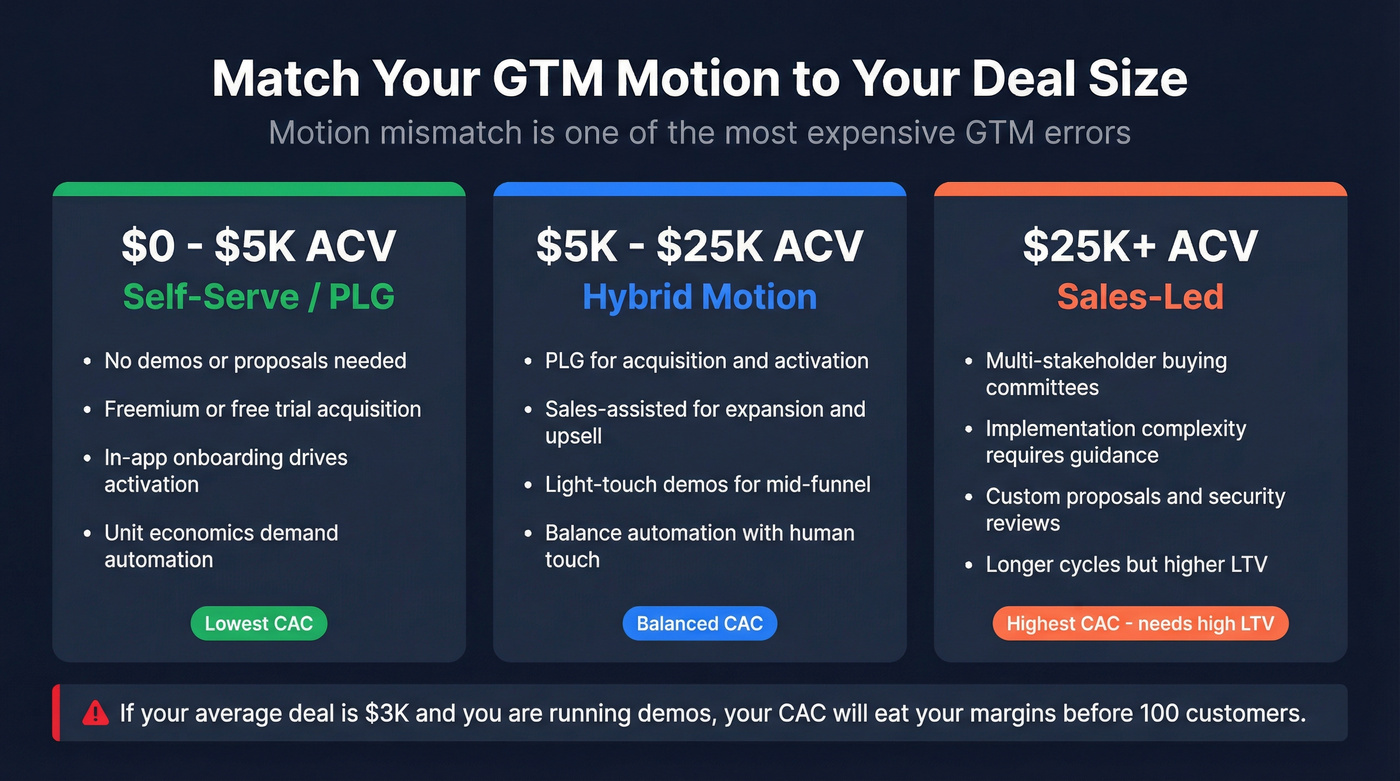
Use a hybrid motion if deals run $5K-$25K. PLG for acquisition, sales-assisted for expansion and upsell.
Use sales-led if deals exceed $25K. Multi-stakeholder buying committees and implementation complexity demand it.
If your average deal is $3K and you're running demos and proposals, your CAC will eat your margins before you hit 100 customers. Motion mismatch is one of the most expensive GTM errors - fix it before optimizing anything else.
Analyze Your Buyer's Actual Journey
The buyer journey you mapped in your strategy deck doesn't match reality. Gartner's data makes this clear: 67% of B2B buyers prefer a rep-free experience, 45% used AI during a recent purchase, and 73% actively avoid suppliers who send irrelevant outreach.
That last number should change your behavior. If nearly three-quarters of buyers filter out irrelevant outreach, your contact data accuracy determines whether you're relevant or spam. A 7-day data refresh cycle - versus the roughly 6-week average for many B2B data providers - is the difference between reaching a buyer and hitting a dead inbox. When you're analyzing why outbound isn't converting, bad data is the silent variable that skews every metric downstream.
Here's what these trends demand from your GTM:
- Rep-free preference rising: Invest in self-serve content, interactive demos, and transparent pricing. Gate less.
- AI-assisted buying: Ensure your product data is structured for AI retrieval - clean feature pages, comparison tables, API documentation.
- Irrelevant outreach rejection: Verify contact data before every campaign. Use intent signals to confirm you're reaching in-market buyers, not cold lists.
Benchmark Against 2026 Data
Don't just "track CAC." Benchmark it. Across SaaS benchmarks compiled by Phoenix Strategy Group, here are the numbers that matter:
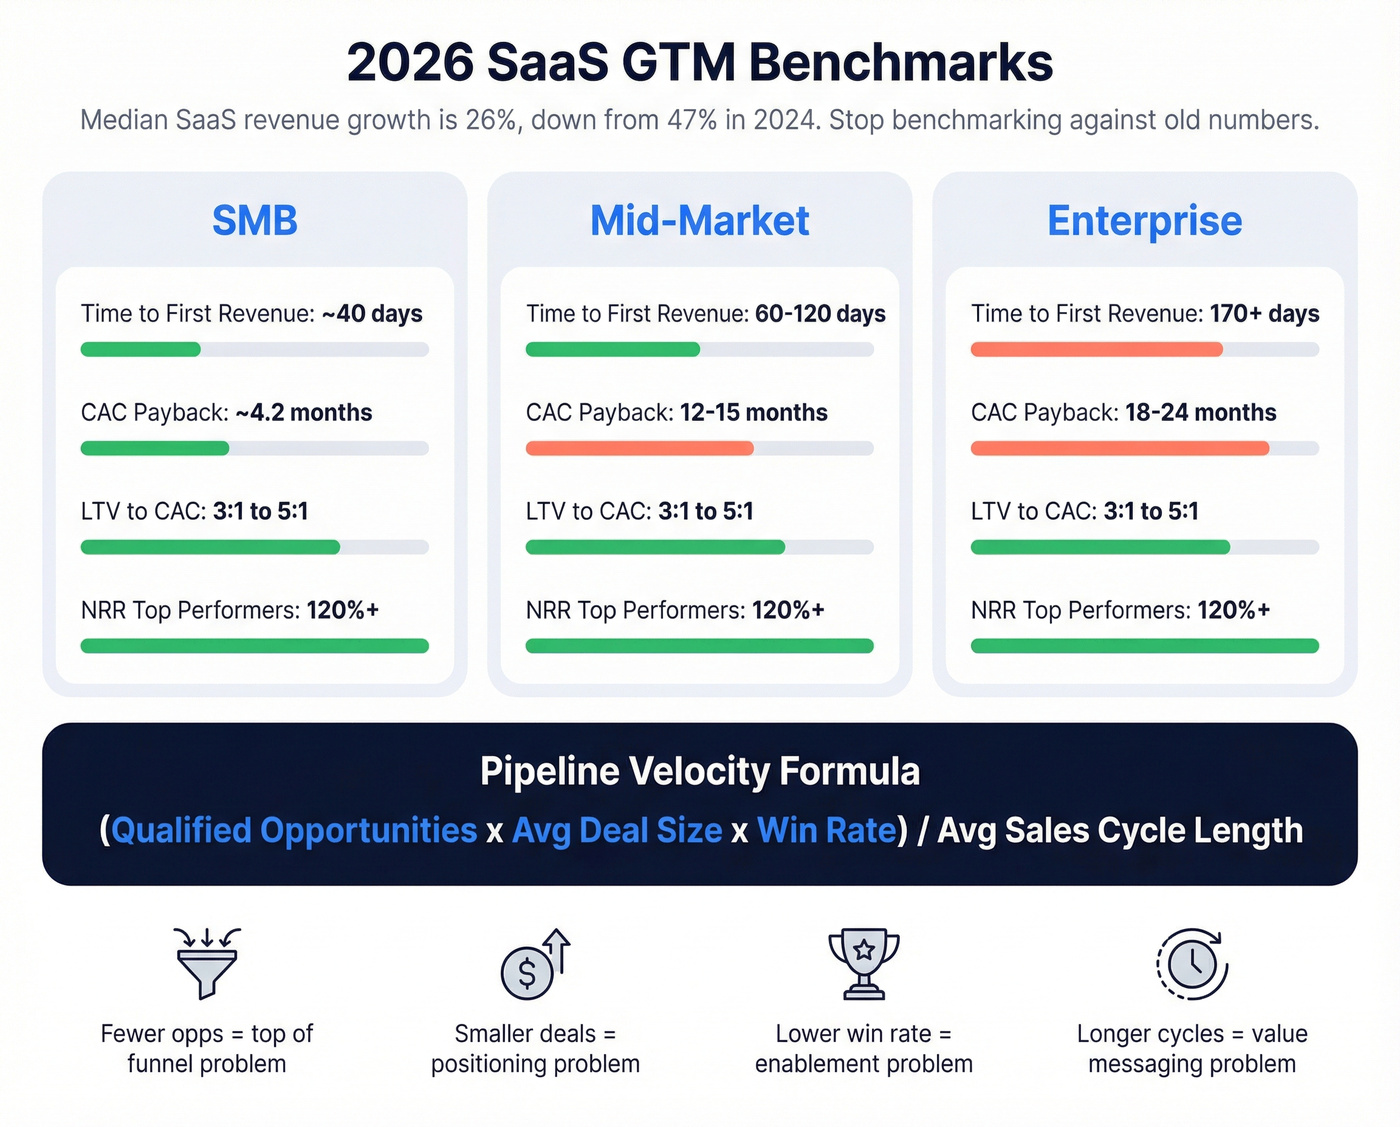
| Metric | SMB | Mid-Market | Enterprise |
|---|---|---|---|
| Time-to-first-revenue | ~40 days | 60-120 days | 170+ days |
| CAC payback | PLG ~4.2 mo | 12-15 mo | 18-24 mo |
| LTV:CAC (healthy) | 3:1-5:1 | 3:1-5:1 | 3:1-5:1 |
| NRR (top performers) | 120%+ | 120%+ | 120%+ |
Overall median SaaS revenue growth sits at ~26% - down from 47% in 2024. If you're benchmarking against two-year-old numbers, your analysis is already wrong.
The single metric that connects your entire funnel is pipeline velocity:
(Number of qualified opportunities x Average deal size x Win rate) / Average sales cycle length
Track it weekly. When velocity drops, diagnose which lever moved: fewer opportunities (top-of-funnel problem), smaller deals (positioning or discounting problem), lower win rate (competitive or enablement problem), or longer cycles (buying committee or value-messaging problem). Each lever points to a different fix.
Your segment-need-feature-channel linkages fall apart when your contact data is wrong. Prospeo's 300M+ profiles with 30+ filters - buyer intent, technographics, headcount growth, funding - let you validate market sizing and segment fit with real data, not assumptions. 98% email accuracy means your outbound actually reaches the buyers you mapped.
Stop analyzing a broken pipeline. Start with data that connects.
Run Win-Loss Analysis
The single most underused tool in any GTM diagnostic is win-loss interviews. Most companies skip them because the answers are uncomfortable. That's exactly why they work.
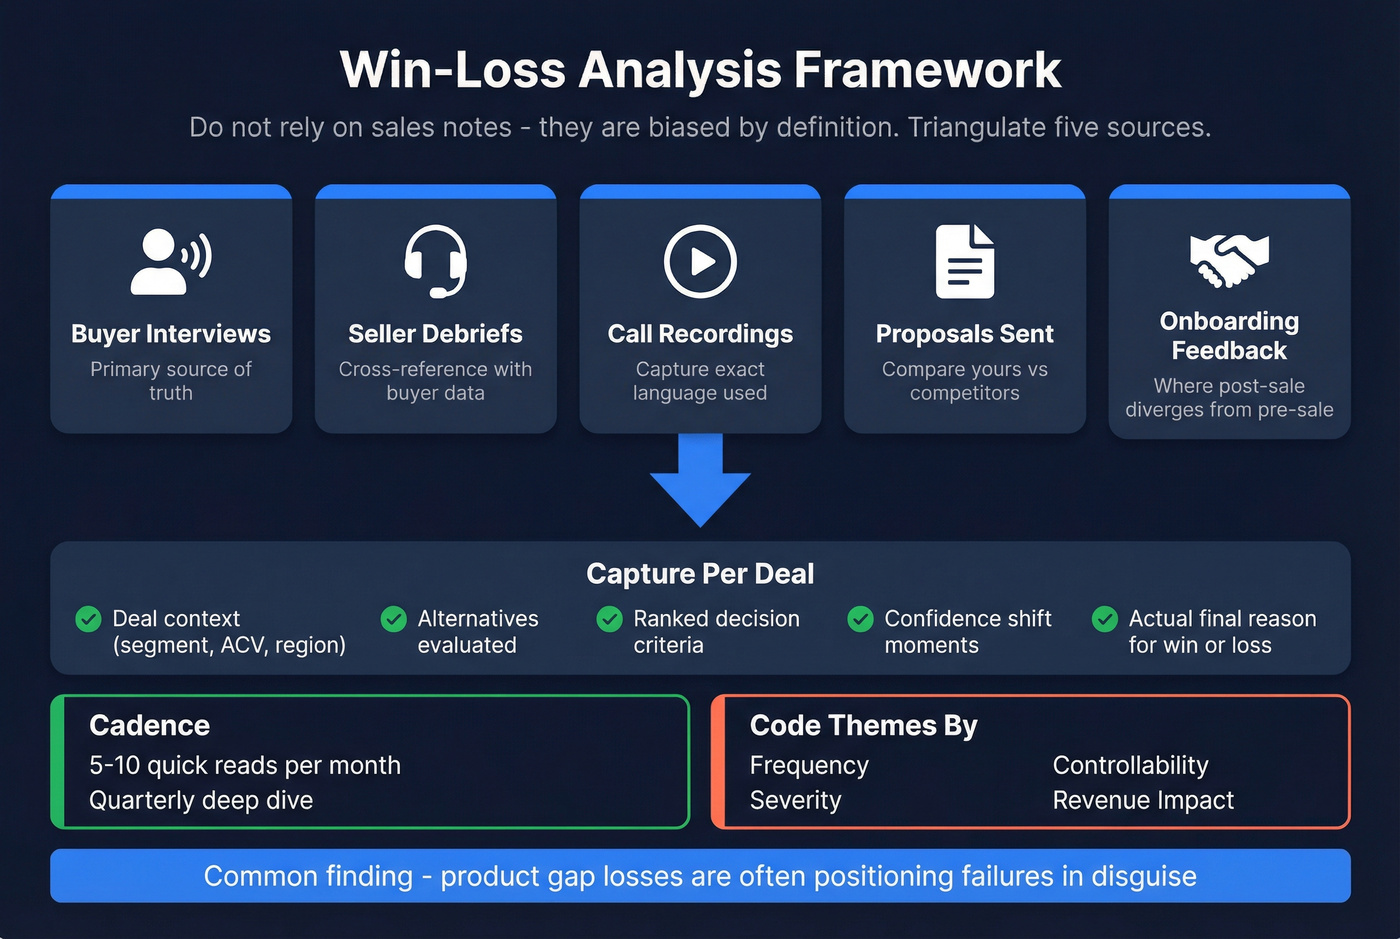
Don't rely on sales notes - they're biased by definition. Triangulate five evidence sources: buyer interviews, seller debriefs, call recordings, proposals (what you actually sent vs. what competitors sent), and implementation/onboarding feedback where post-sale reality diverges from pre-sale promises. For each deal, capture:
- Deal context (segment, ACV band, region, motion type)
- Alternatives the buyer evaluated
- Ranked decision criteria
- "Confidence shift" moments - where the buyer leaned in or pulled back
- The actual final reason for the win or loss
Run 5-10 quick reads per month and a quarterly deep dive. Code themes by four dimensions: frequency, severity, controllability, and revenue impact. We've seen teams discover that their "product gap" losses were actually positioning failures - the product could do what buyers needed, but nobody told them. That's a messaging fix, not a roadmap item.
Build a Competitive Intelligence Loop
CI isn't a quarterly report. It's a continuous four-step loop: capture signals, interpret them, activate insights, and learn from outcomes.
The highest-value signal sources hide in plain sight: competitor pricing pages, release notes, hiring patterns, support forums, and partner listings. A competitor hiring five enterprise AEs tells you more about their GTM shift than any press release. Tag each signal with source, date, confidence level, and usage rights so it's usable - and compliant - later.
Here's the thing: a competitive insight that sits in a Slack channel dies there. Route it directly. Sales gets an updated talk track within 48 hours, product gets a Jira ticket, marketing gets a positioning tweak. CI that doesn't change behavior is just trivia.
GTM motion mismatch costs more than bad messaging. Whether you're running PLG, hybrid, or sales-led, you need verified contact data to test what's working. Prospeo refreshes every 7 days - not 6 weeks - so your GTM analysis reflects the market right now, not last quarter.
Real-time data for real-time GTM decisions. Starting at $0.01 per email.
Weekly GTM Analysis Ritual
Most GTM analysis advice tells you what to analyze but not when. Here's a lightweight weekly cadence that keeps your diagnostic current without consuming your calendar.
Five inputs (10 minutes): Pull pipeline velocity, review 2-3 win-loss notes from the week, check one competitor signal, scan RevOps dashboards for leading indicators (MQL-to-SQL conversion, time-to-first-meeting, demo-to-proposal rate), and note any sales enablement gaps flagged by reps.
Three outputs (20 minutes): Update one talk track or positioning element based on what you found. Flag one metric that moved more than 10% week-over-week for deeper investigation. Document one hypothesis to test next week - something like "Our enterprise cycle lengthened because we're missing a security whitepaper for the CISO."
| Function | Owns | Contributes To |
|---|---|---|
| RevOps | Pipeline data, metric dashboards | Weekly ritual facilitation |
| Sales | Win-loss notes, talk track feedback | Enablement gap identification |
| Marketing | Positioning updates, CI signals | Content and channel adjustments |
| Product | Feature-usage data, roadmap context | Competitive response decisions |
| CS | Onboarding feedback, churn signals | Retention-side GTM insights |
This ritual replaces the "quarterly GTM review" that's always two months too late. The teams that run it weekly consistently outperform those who only analyze after something breaks.
Your GTM Analysis Deliverable
Your analysis should produce a living document - not a slide deck that collects dust - with these sections:
- Problem statement and value proposition validated against buyer interviews, not assumed
- Segmentation with prioritized targets and Segment-Need-Feature-Channel linkages
- TAM/SAM/SOM with bottom-up math and verifiable sources
- Competitive positioning with pricing, channels, and messaging gaps
- Buyer journey map based on actual data, including time-to-value benchmarks
- Pricing and unit economics with benchmark comparisons
- Leading indicators dashboard, not just lagging revenue metrics
- Risks and assumptions - each with a test plan, owner, and date
- All numbers: source link or clearly labeled estimate
Skip the executive summary if this is an internal doc. Nobody reads it. Start with the three biggest findings and what you're doing about them.
FAQ
How often should you run a go-to-market strategy analysis?
Monthly metric reviews against 2026 benchmarks, quarterly deep dives with win-loss synthesis, and a full strategic reassessment annually or when entering a new segment. The weekly 30-minute ritual keeps things current between formal reviews. GTM analysis is a cadence, not a one-time project.
What's the difference between a GTM strategy and a GTM analysis?
A GTM strategy is the plan you build - ICP, positioning, channels, pricing model. A GTM analysis is the diagnostic layer that evaluates whether that plan is working, identifies failure patterns, and produces specific decisions to fix what's broken. Strategy is creation; analysis is interrogation.
What tools do you need for GTM analysis?
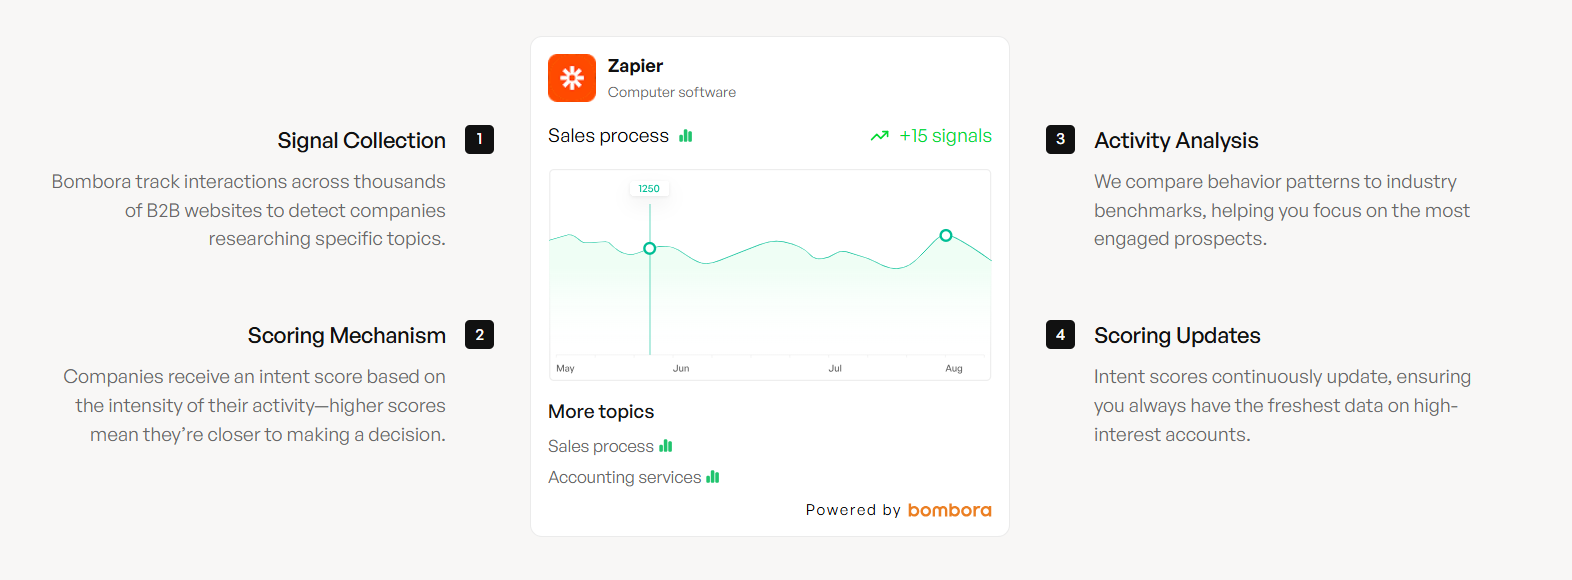
At minimum: a CRM with clean pipeline data, a win-loss interview process, and a verified contact database so outbound metrics aren't skewed by bad contacts. Prospeo pairs 98%-accurate email verification with intent data across 15,000 Bombora topics, so you can validate both contact quality and buyer readiness from one platform.
Does a sub-$10K ACV business need formal GTM analysis?
Yes - but scope it tighter. Focus almost entirely on motion fit (are you overspending per deal?), channel efficiency (which sources produce the lowest CAC?), and time-to-first-revenue. Skip elaborate buying-committee mapping and zero in on conversion rate at each funnel stage. The framework's the same; the depth changes.