GTM Efficiency: Formulas, Benchmarks, and Fixes That Actually Matter
Your CFO just pulled up the GTM efficiency numbers: you're spending $2 for every $1 of new ARR. Since 2022, SaaS growth rates have halved while go-to-market costs nearly doubled - and companies below $1M ARR saw new business growth drop by 34 percentage points. The board wants to know why the sales and marketing line item keeps climbing while pipeline velocity flatlines.
Here's the thing: most teams aren't even measuring this the same way. Three different formulas circulate in board decks, ops reviews, and investor updates, and they tell very different stories. Pick the wrong one and you'll either panic when things are fine or relax when the building's on fire.
The short version:
- Pick the right formula for your audience. Board deck? GTM Efficiency Factor. Ops review? New CAC Ratio. Heavy on expansion? Blended CAC Ratio.
- Know your benchmark. The median New CAC Ratio is $2.00. Above $2.82, you're in the bottom quartile.
- Fix the #1 lever most teams ignore: data quality. Every bounced email and wrong number inflates your S&M numerator without generating a dollar of ARR.
What Is GTM Efficiency?
GTM efficiency measures how much sales and marketing spend it takes to generate a dollar of new revenue. The confusion starts when people use different formulas interchangeably - and they aren't interchangeable. A clear metrics framework prevents your team from comparing apples to oranges across board decks, ops reviews, and investor updates.
S&M costs include everything: salaries, tools, commissions, ad spend, agencies, events, and contractor fees. If it touches pipeline generation or deal closing, it's in the numerator.
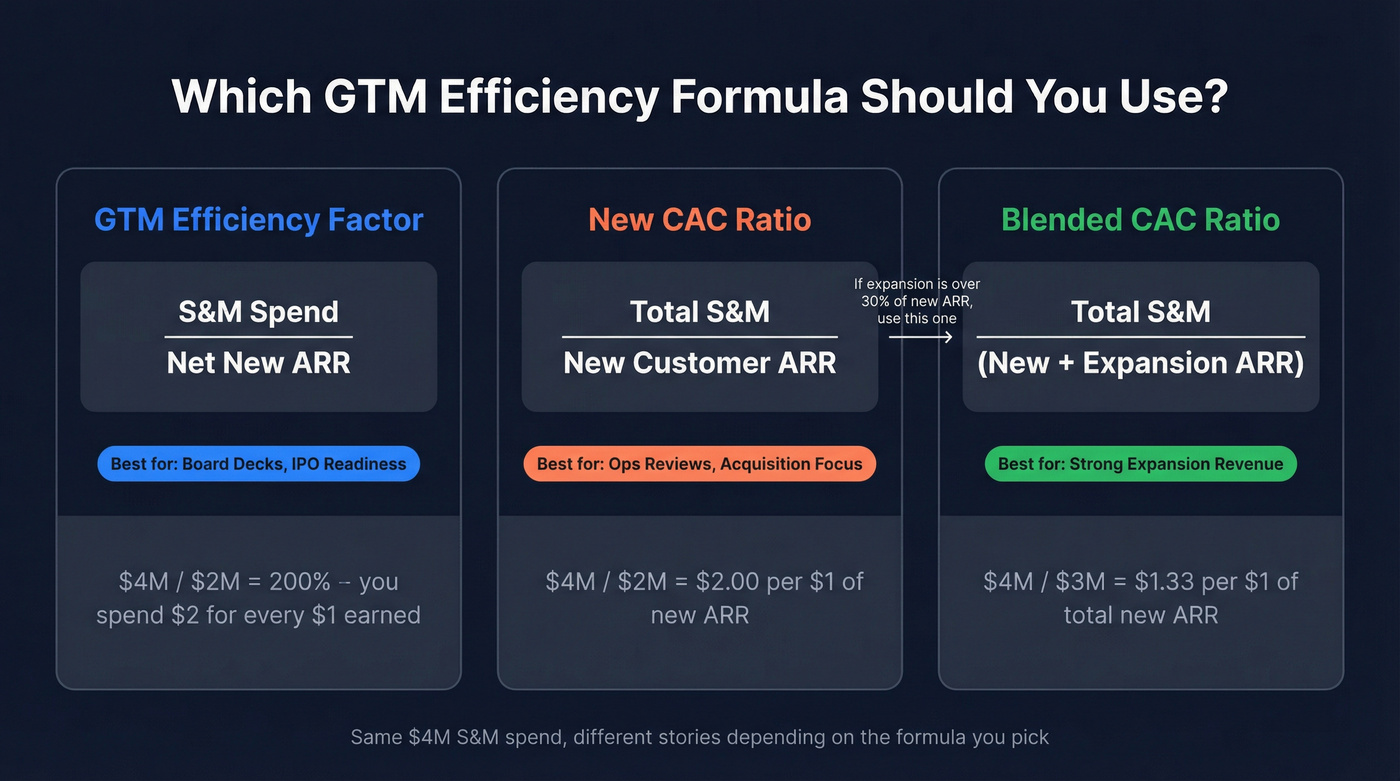
| Formula | Calculation | Best For |
|---|---|---|
| GTM Efficiency Factor | S&M Spend / Net New ARR | Board decks, IPO readiness |
| New CAC Ratio | Total S&M / New Customer ARR | Ops reviews, acquisition focus |
| Blended CAC Ratio | Total S&M / (New + Expansion ARR) | Companies with strong expansion |
Worked example: You spend $4M on S&M in a quarter and generate $2M in net new ARR. Your GTM Efficiency Factor is 200% - $2 for every $1 earned.
Now say $1M of that quarter also came from expansion. Your Blended CAC Ratio drops to $1.33 ($4M / $3M). If expansion is more than 30% of your new ARR and you're only reporting the New CAC Ratio, you're flattering your acquisition costs. Expansion ARR now accounts for 40% of total new ARR at the median, and over 50% for companies above $50M ARR. Most teams underweight it.
Benchmarks by Stage and Motion
Numbers without context are useless. The right performance target depends entirely on your stage, motion, and ACV.
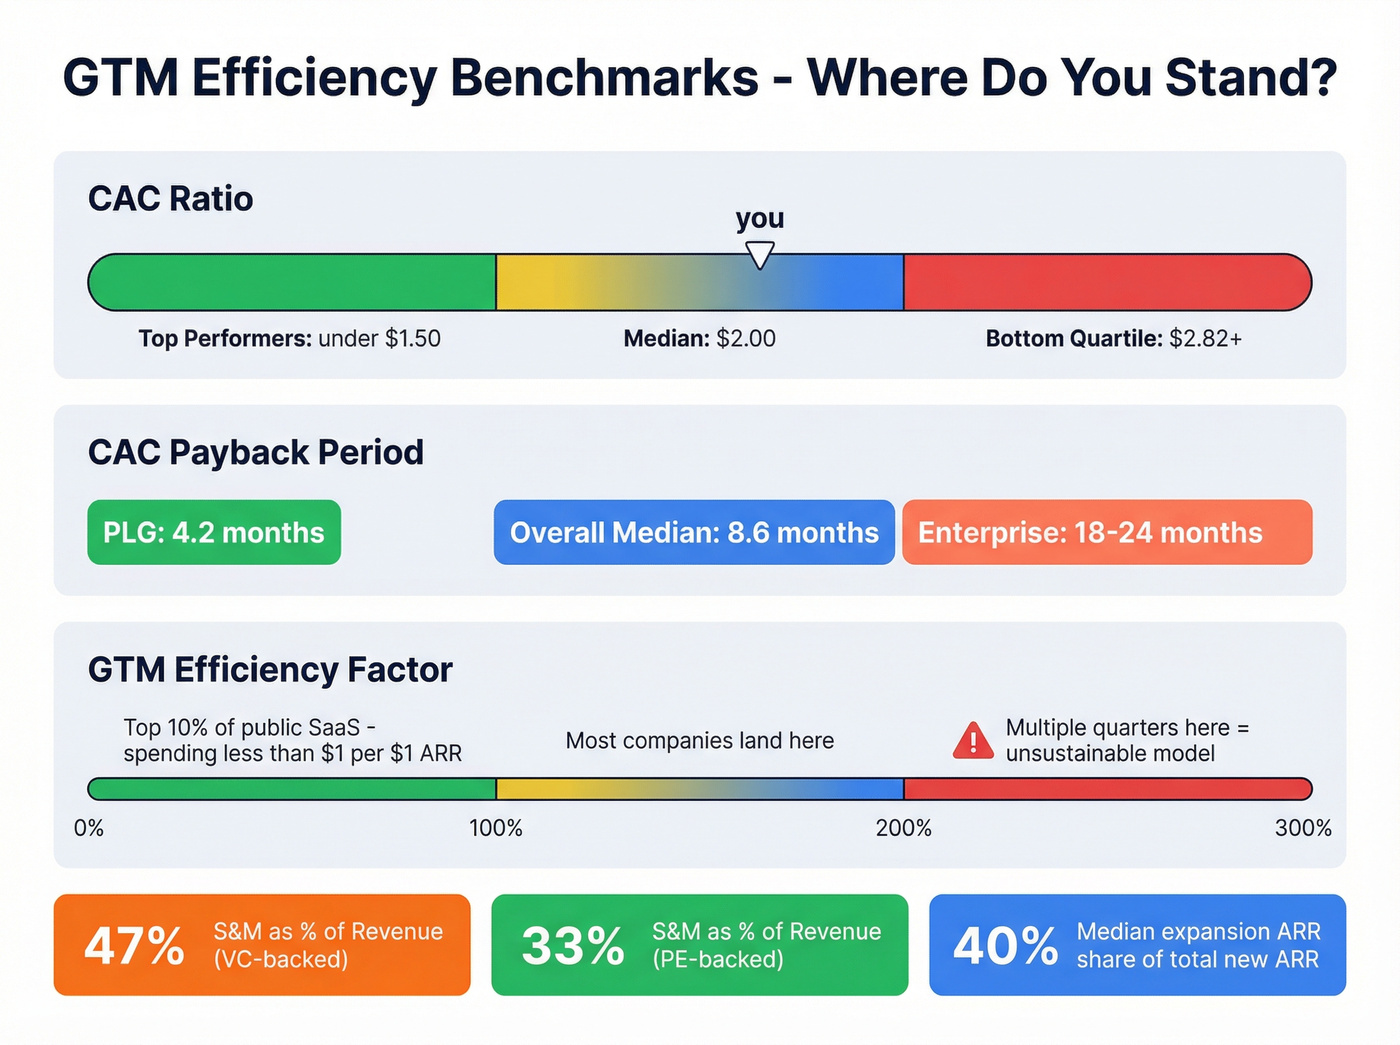
| Metric | Median | Top Performers | Source |
|---|---|---|---|
| New CAC Ratio | $2.00 | <$1.50 | Benchmarkit |
| 4th Quartile New CAC Ratio | $2.82 | - | Benchmarkit |
| GTM Efficiency Factor (public SaaS) | - | <100% (top ~10%) | Winning by Design (n=72) |
| GTM Efficiency Factor risk line | >200% multiple quarters = unsustainable | - | Winning by Design |
| CAC Payback (overall) | 8.6 months | 5-7 months | Data-Mania / Benchmarkit |
| CAC Payback (PLG) | 4.2 months | - | Data-Mania |
| CAC Payback (Enterprise) | 18-24 months | - | Data-Mania |
| S&M as % of Revenue | 47% (VC-backed) | 33% (PE-backed) | Benchmarkit |
Only about 10% of public SaaS companies operate below the 100% GTM Efficiency Factor threshold. Above 200% for multiple consecutive quarters? The model is unsustainable. You're burning more than you're building.
Motion matters as much as stage. ChartMogul's analysis of 2,500 SaaS companies found that below $25 ASP, full PLG companies grow at 20% median new business ARR, while those that layer sales too early grow at 0%. That's not a rounding error - it's a strategy-killing mistake.
Time-to-first-revenue varies wildly: SMB closes in roughly 40 days, mid-market takes 60-120, and enterprise stretches past 170 days. For long sales cycles, traditional CAC payback reveals underperformance only after the budget is already burned.
It's also worth separating pre-purchase from post-purchase efficiency. Your acquisition CAC ratio might look healthy while your expansion and retention costs quietly bleed margin. Track both sides of the bowtie.
Which formula when? Board presentations call for the Winning by Design GTM Efficiency Factor. Ops reviews need the Benchmarkit New CAC Ratio. If expansion exceeds 30% of your new ARR, the Blended CAC Ratio is the only honest number.
Score your go-to-market health: (1) Is your outbound bounce rate under 5%? (2) Do sales accept more than 50% of marketing-qualified leads? (3) Can you tie every GTM tool to a revenue outcome? Two or more "no" answers mean you should skip straight to the fix section below.
Every bounced email inflates your S&M numerator without adding a dollar to ARR. Prospeo's 98% email accuracy and 7-day data refresh cycle eliminate the #1 GTM efficiency killer - bad contact data. Snyk dropped bounce rates from 35% to under 5% and grew AE-sourced pipeline 180%.
Stop paying $2 per $1 of ARR because your data is stale.
Why Your Efficiency Is Getting Worse
Four killers, in order of how often we see them wreck the numbers.
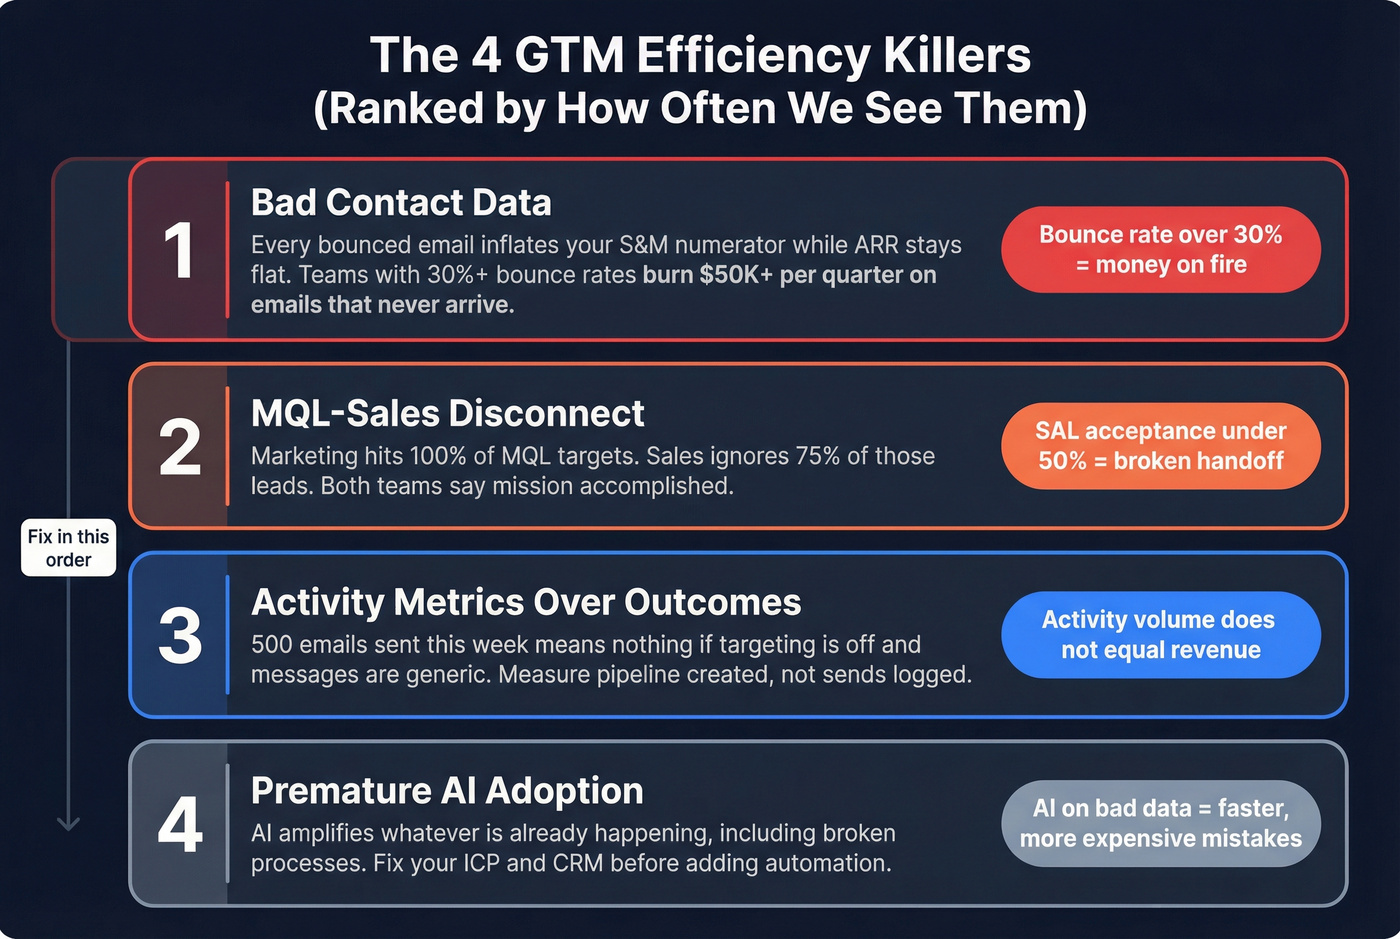
1. Bad Contact Data
Every bounced email is wasted sequence cost that inflates your CAC ratio. The S&M numerator goes up - salaries, tools, send volume - but the ARR denominator doesn't move. We've watched teams burn through $50K+ in quarterly outbound spend with bounce rates above 30%, then wonder why their efficiency ratio looks terrible.
After switching to Prospeo, Snyk's bounce rates dropped from 35-40% to under 5%, and AE-sourced pipeline jumped 180%. At $0.01 per email, fixing data quality is the cheapest lever you can pull.
2. MQL-Sales Disconnect
Marketing can hit 100% of its MQL target while sales ignores 75% of those leads - and both teams report "mission accomplished." Marketing scores on downloads and page visits. Sales qualifies on budget, org fit, and active timeline. These are fundamentally different signals, and the gap between them is where pipeline goes to die. If your SAL acceptance rate is below 50%, this is your problem, full stop.
3. Activity Metrics Over Outcomes
A common complaint on r/sales is that GTM orchestration tools over-report activity - touches, sequences, sends - that doesn't correlate to revenue. The consensus in those threads is pretty clear: what actually moves deals is targeting accuracy, message relevance, and relationship velocity through the buying committee. Not "500 emails sent this week."
4. Premature AI Adoption
AI amplifies whatever's already happening. Including broken processes. The Union Square Consulting GTM Efficiency Pyramid makes this explicit: automation and AI sit at the top of the maturity model, not the base. If your ICP definition is fuzzy and your CRM is full of dead records, layering AI on top just creates faster, more expensive mistakes.
AI's Real Impact on Go-to-Market Spend
AI does move the needle - but only for teams that have their fundamentals sorted. ICONIQ's State of GTM report found that AI-native companies above $100M ARR convert free trials and POCs at 56%, compared to 32% for non-AI-native companies. AI-native companies also allocate 31-34% of GTM headcount to post-sales, versus 23% at non-AI-native firms, suggesting AI shifts resources toward retention and expansion.
About 70% of B2B companies now report moderate or full AI adoption in GTM workflows. But AE quota attainment is still flat at 58-59%.
Let's be honest: most teams adopting AI for GTM are automating the wrong layer. If your average deal size is under five figures, intent tools are usually less urgent than clean data and a tighter ICP. The companies getting real ROI from AI already had their data, qualification, and tech stack sorted before they added a single AI workflow. Skip the shiny stuff until your foundation is solid.
How to Improve GTM Efficiency
Sequence matters. Inspired by the Union Square Consulting pyramid framework, here's the order that works.
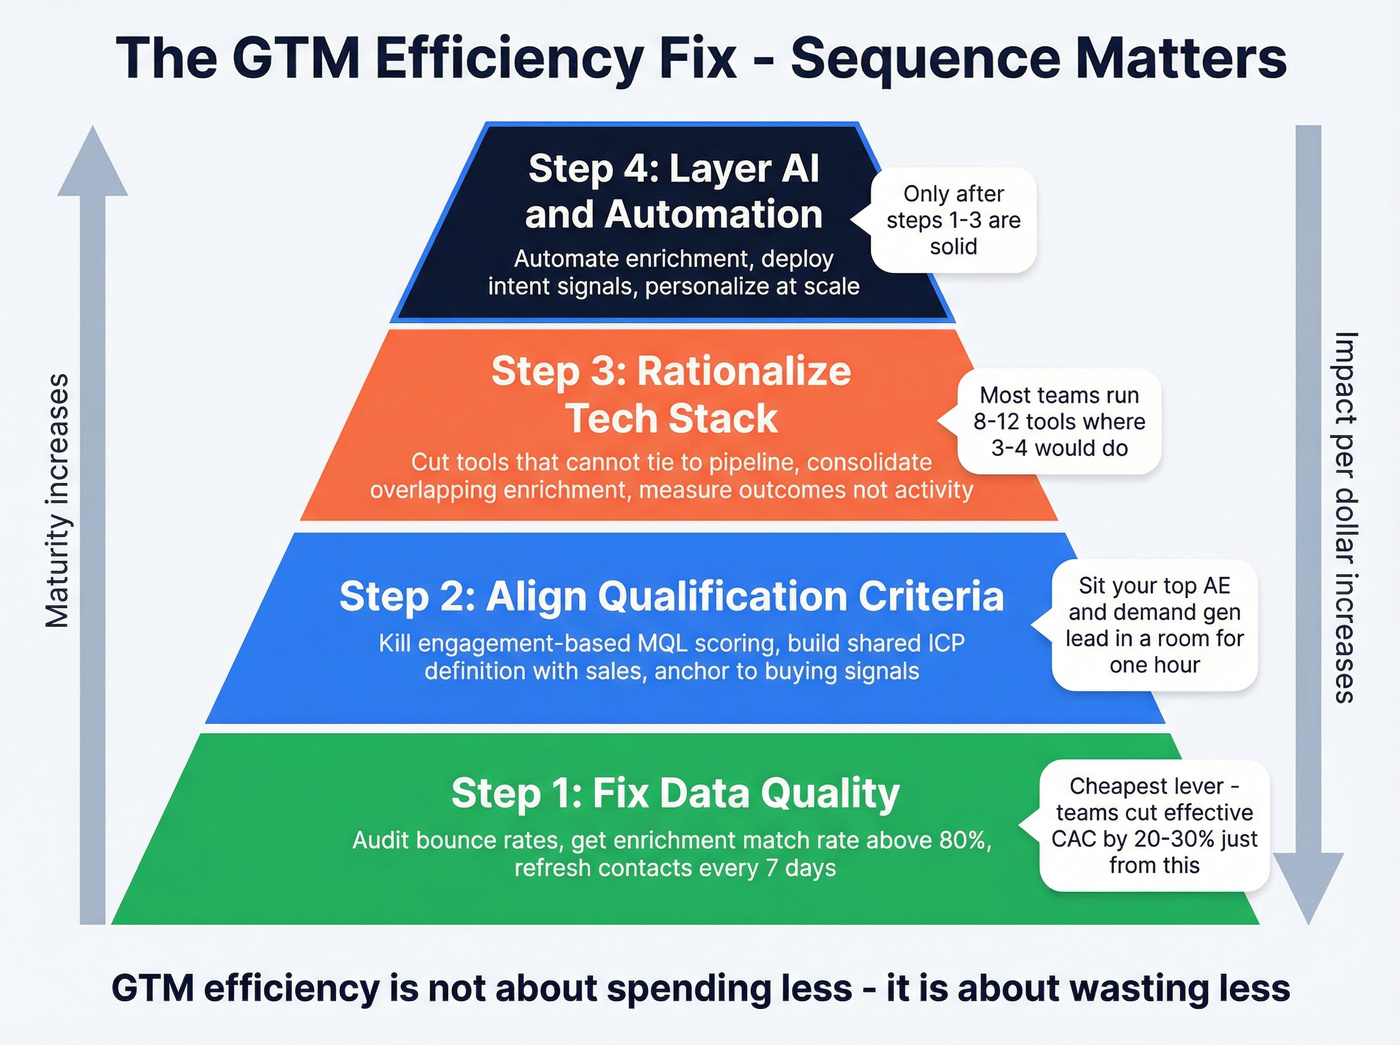
Step 1: Fix Data Quality
Start by auditing your bounce rate. If your enrichment match rate is below 80%, you're leaving pipeline on the table. Prospeo's 7-day data refresh cycle and 98% email accuracy mean your outbound spend actually reaches real inboxes - a prerequisite for any meaningful improvement in your efficiency ratio. We've seen teams cut their effective CAC by 20-30% just by cleaning up their contact data before touching anything else.
Quick calculator: [Quarterly S&M spend] / [Quarterly net new ARR] x 100 = your ratio. Below 100% = top decile. Above 200% = red flag. Run this before and after a data cleanup to see the impact.
Step 2: Align Qualification Criteria
Kill engagement-based MQL scoring. Replace it with a shared ICP definition anchored to buying signals - budget indicators, job changes, headcount growth, active tech evaluations. When marketing and sales agree on what "qualified" means, that 75% lead-ignore rate drops fast. For teams that don't know where to start, sit your top-performing AE and your demand gen lead in a room for an hour and have them build the criteria together. It sounds simple because it is.
Step 3: Rationalize Your Tech Stack
| Signal | Action |
|---|---|
| Tool can't tie to pipeline or revenue | Cut it |
| Two tools doing the same enrichment job | Consolidate |
| Activity metrics only (emails sent, calls logged) | Replace with outcome-tracking alternative |
| Overlap between CRM, sequencer, and data provider | Audit for redundancy |
We've seen teams running 8-12 overlapping GTM tools where 3-4 would do. Measure outcomes - pipeline created, deals influenced, revenue per rep - not activity volume.
Step 4: Layer AI and Automation Last
Only after steps 1-3 are solid. Automate enrichment workflows, use AI for personalization at scale, deploy intent signals to prioritize accounts. And if you're PLG below $25 ASP, don't layer sales - ChartMogul's data shows it kills growth entirely.
GTM efficiency isn't about spending less. It's about wasting less. The biggest gains come from eliminating dead data, misaligned leads, and redundant tools - not from slashing budgets across the board.
Activity metrics mean nothing when 30% of your emails bounce. Prospeo gives your reps 300M+ verified profiles, 125M+ direct dials, and intent data across 15,000 topics - so every dollar of S&M spend actually reaches a real buyer. At $0.01 per email, it's the cheapest GTM efficiency fix you'll ever make.
Shrink your S&M spend per dollar of new ARR starting today.
FAQ
What's a good GTM efficiency ratio?
Below 100% puts you in the top 10% of public SaaS companies - meaning you spend less than $1 to generate $1 of new ARR. The median New CAC Ratio is $2.00. PLG companies recover CAC in 4.2 months; enterprise motions take 18-24 months.
How do you calculate GTM efficiency?
Total S&M spend divided by net new ARR gives you the GTM Efficiency Factor. If expansion revenue exceeds 30% of new ARR, use the blended version: total S&M divided by new customer ARR plus expansion ARR. Pick one formula and standardize it across every team report.
How does data quality affect go-to-market costs?
Every bounced email is wasted S&M spend that inflates your CAC ratio without generating ARR. Snyk cut bounce rates from 35-40% to under 5% after switching their data provider, and AE-sourced pipeline grew 180%. Clean data is the single highest-ROI fix for most teams.
Which metrics pair best with GTM efficiency?
CAC payback period, net revenue retention, and expansion ARR percentage are the most useful companions. Together they give the board a complete picture of capital efficiency - not just acquisition cost, but how quickly and sustainably that spend converts into durable revenue.