How to Measure Email Deliverability the Right Way
Your ESP says 97% delivered. Your open rate is 45%. Everything looks great - except your reply rate has been dropping for three months straight, and nobody on the team can explain why.
Here's the thing: if you want to know how to measure email deliverability, you need to understand the gap between delivery and deliverability. Delivery rate tells you the server accepted the email. Deliverability tells you where it actually landed - inbox, promotions tab, or spam. 22% of senders don't track deliverability at all. Let's fix that.
What You Need (Quick Version)
- Free tools: Google Postmaster Tools, Microsoft SNDS, Yahoo Sender Hub
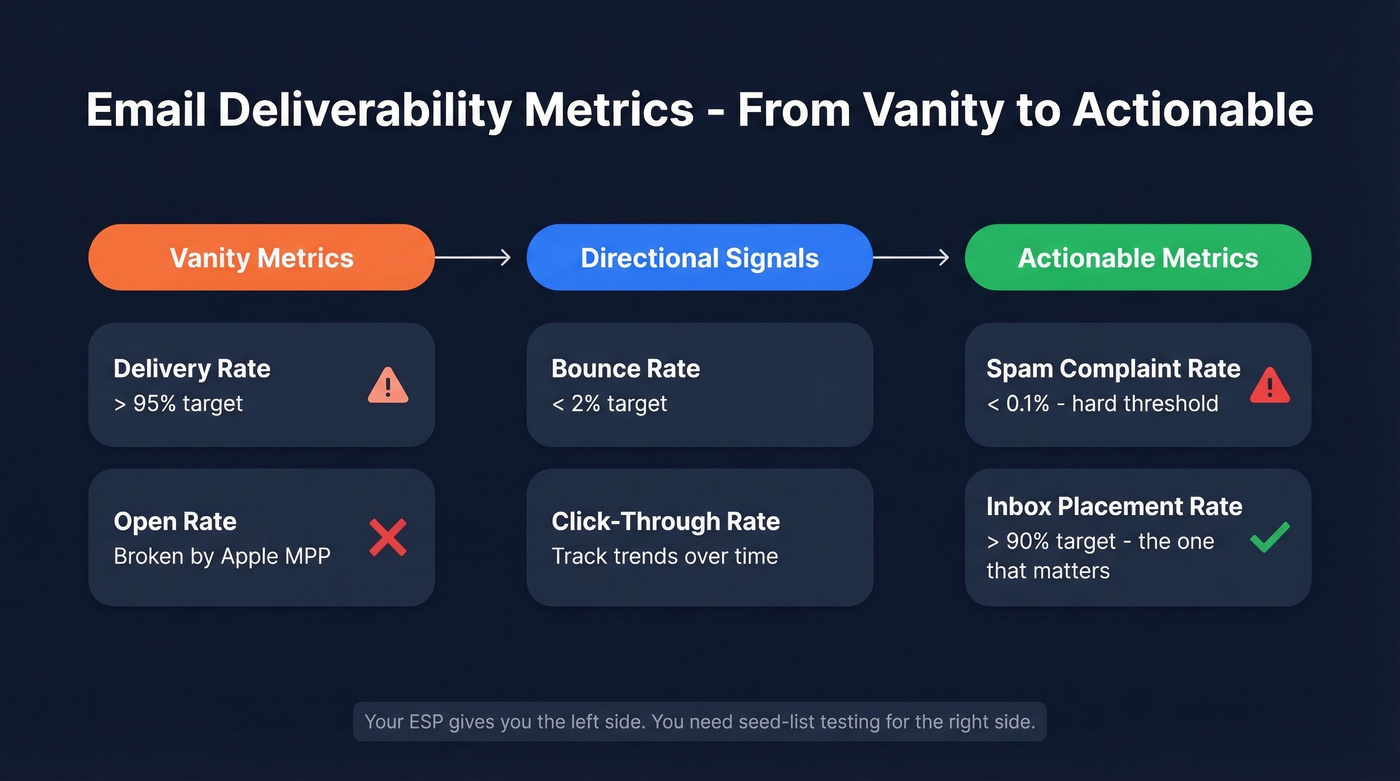
- Six metrics: delivery rate, bounce rate, spam complaint rate, open rate (with caveats), click-through rate, inbox placement rate
- Biweekly inbox placement tests, monthly domain engagement audits
- Minimum 500 emails per domain before acting on any data
- Verify emails before every new campaign
That's the skeleton. Now let's put muscle on it.
6 Deliverability Metrics That Matter
Not all six carry equal weight. Delivery rate is a vanity metric - a 98% delivery rate means nothing if 15% of those "delivered" emails sit in spam. Inbox placement rate is the one that actually matters, but it's the hardest to track.
| Metric | Formula | Target |
|---|---|---|
| Delivery Rate | (Delivered / Sent) x 100 | >95% |
| Bounce Rate | (Bounces / Sent) x 100 | <2% |
| Spam Complaints | (Complaints / (Sent - Bounces)) x 100 | <0.1% |
| Open Rate | (Unique Opens / (Sent - Bounces)) x 100 | Unreliable |
| Click-Through Rate | (Unique Clicks / (Sent - Bounces)) x 100 | Track trends |
| Inbox Placement | (Inbox / Delivered) x 100 | >90% |
Spam complaint rate has hard thresholds. Keep it under 0.1%, and never let it spike above 0.3%. That's where inbox placement drops fast due to aggressive spam filtering.
Open rate is broken. Apple Mail Privacy Protection preloads tracking pixels through proxy servers, generating fake "opens" without a human ever seeing your email. The kicker: 77% of marketers believe MPP is automatically activated, when users actually have to opt in - meaning the distortion is both real and widely misunderstood. Track clicks and replies instead. These are engagement signals deliverability teams can actually trust.
Your ESP can't give you inbox placement rate. You need seed-list testing or third-party tools for that.
Free Tools to Set Up Today
Three tools cover the three largest mailbox providers, and they're all free. 70% of senders don't use free tools like Google Postmaster Tools to monitor sender reputation. It takes 10 minutes. No excuse.
Google Postmaster Tools
Head to postmaster.google.com, add your sending domain, and verify via DNS TXT record. You'll see spam rate, IP reputation, domain reputation, and authentication status for Gmail-bound emails. Data lags about 24 hours, and you need roughly 100-200 daily Gmail sends before anything appears. We've found this is the single most useful free tool for catching reputation problems early - the spam rate chart alone has saved us from burning domains more than once.
Microsoft SNDS
SNDS covers Outlook, Hotmail, and Live consumer domains - not Office 365 business accounts. Watch the SmartScreen filter results: green means under 10% spam verdict, yellow is 10-90%, red means over 90%. Complaint rate under 0.1% is healthy. Spam trap hits should be zero.
Yahoo Sender Hub
Rounds out the trio for Yahoo and AOL domains. It's the least detailed of the three but still worth monitoring if any meaningful portion of your list uses Yahoo addresses.
Every metric on this page gets worse when you send to invalid addresses. Prospeo's 5-step verification - catch-all handling, spam-trap removal, honeypot filtering - keeps bounce rates under 2% so your sender reputation stays intact. 98% email accuracy, refreshed every 7 days.
Fix your data before you fix your deliverability.
Benchmarks: What Good Looks Like
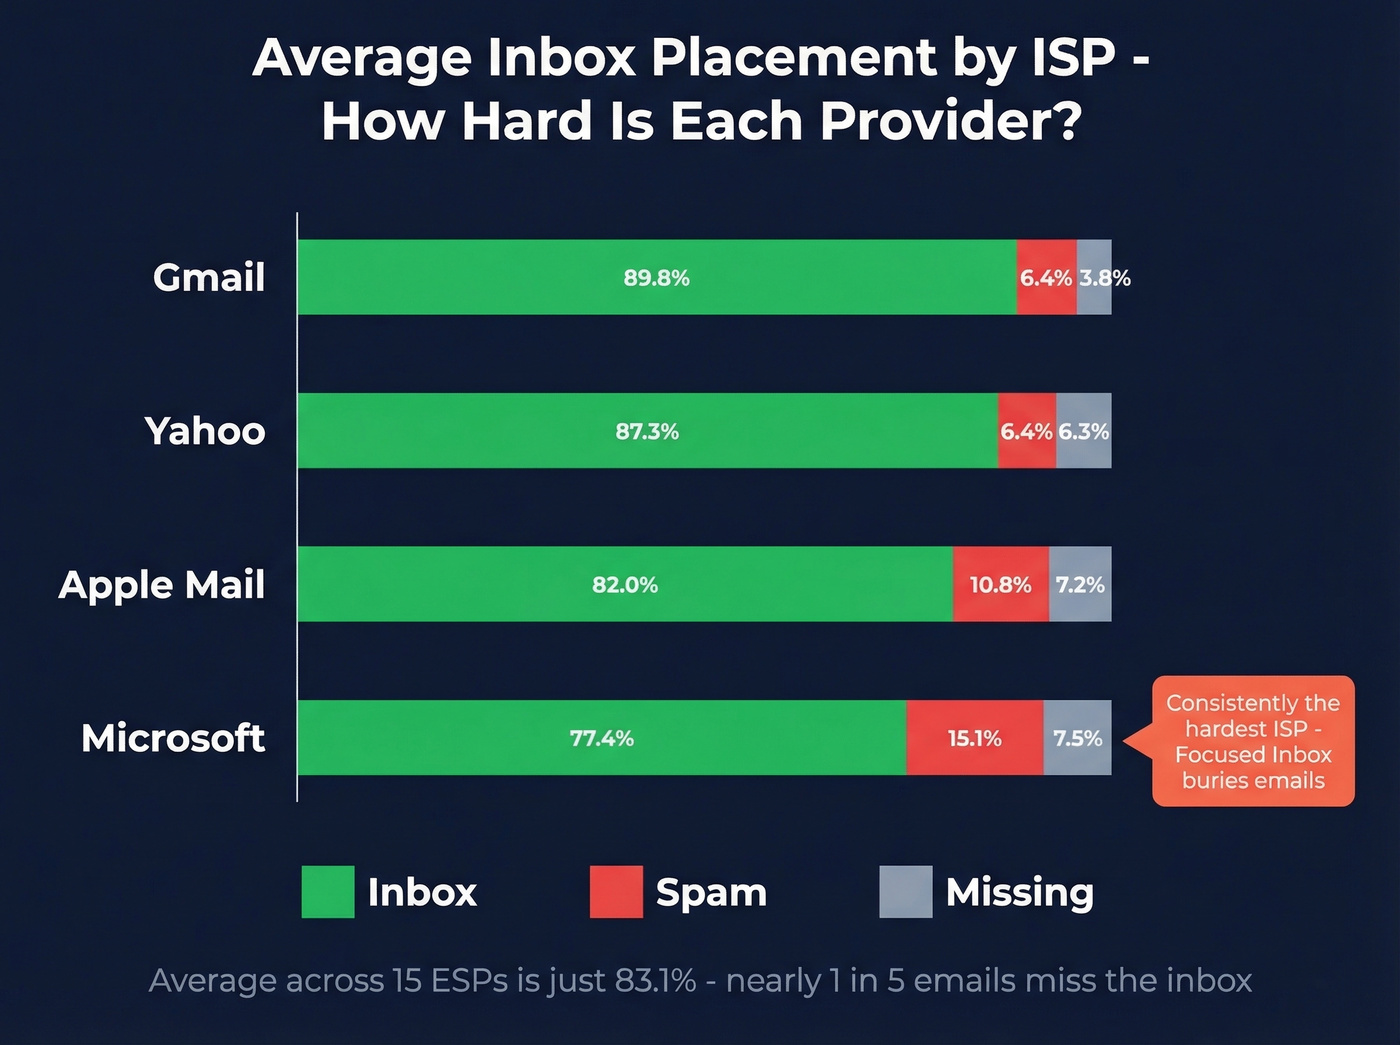
Average inbox placement rates broken down by ISP:
| Provider | Inbox | Spam | Missing |
|---|---|---|---|
| Gmail | 89.8% | 6.4% | 3.8% |
| Microsoft | 77.4% | 15.1% | 7.5% |
| Yahoo | 87.3% | 6.4% | 6.3% |
| Apple Mail | 82.0% | 10.8% | 7.2% |
Microsoft is consistently the hardest ISP. Even when technically delivered, Outlook's Focused Inbox and Sweep features bury your emails. If your Outlook numbers look bad, don't panic - but do investigate.
Across 15 ESPs tested, average deliverability is just 83.1%. That means nearly one in five emails miss the inbox. Above 95% is excellent, above 89% is good, below 80% is poor.
Real talk: if your inbox placement is above 90% and you're still not getting replies, your deliverability isn't the problem - your messaging is. Too many teams chase deliverability fixes when the real issue is a bland email nobody wants to respond to.
Paid Inbox Placement Testing
Free tools show reputation signals, but they can't tell you exactly how many emails hit inbox versus spam. Seed-list testing fills that gap.
| Tool | Starting Price | Best For |
|---|---|---|
| GlockApps | From $85/mo | Inbox placement tests |
| MXToolbox | $129/mo | Monitoring + blocklists |
| Everest (Validity) | From $29/mo | Enterprise analytics |
| Mailtrap | From $15/mo | Dev/staging testing |
Different tools will give you different results. We've seen the same email score 92% inbox on one tool and 74% on another, which is a frustration that shows up constantly on r/emailmarketing - senders get contradictory results and don't know which tool to trust. Pick one, use it consistently, and track trends over time. Absolute numbers matter less than direction.
Skip Everest if you're a small team or solo founder - it's built for enterprise workflows and the pricing reflects that. GlockApps gives you the most actionable data per dollar for straightforward inbox placement testing.

The Data Quality Factor
Measuring deliverability is pointless if you're sending to bad addresses. Invalid emails, spam traps, and honeypots tank sender reputation fast. When Litmus analyzed thousands of emails, 70% showed at least one spam-related issue.
This is where list verification earns its keep. Prospeo's 5-step verification process handles catch-all domain handling, spam-trap removal, and honeypot filtering at 98% email accuracy on a 7-day refresh cycle. The results show up in real campaigns: Stack Optimize built their agency to $1M ARR using Prospeo data, maintaining 94%+ deliverability across all client accounts with bounce rates under 3% and zero domain flags.
Stack Optimize hit $1M ARR running outbound on Prospeo data: 94%+ deliverability, sub-3% bounce rates, zero domain flags across every client. That's what happens when your list is verified before it touches your sending infrastructure.
Stop diagnosing deliverability problems your data provider caused.
How to Analyze Metrics and Act
Measurement without a cadence is just noise. Here's what works in our experience:
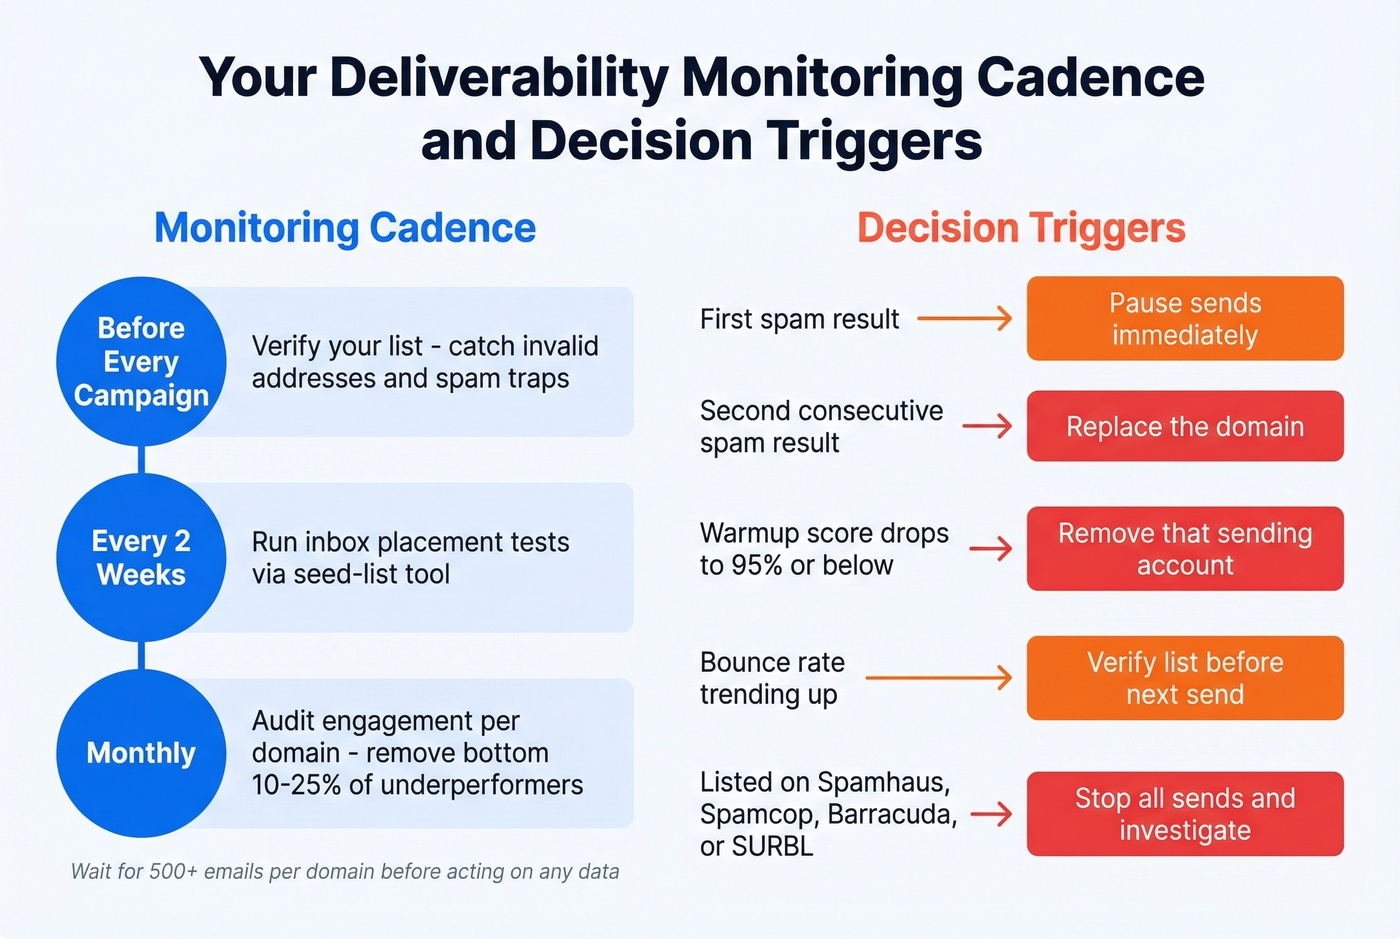
Biweekly: Run inbox placement tests via your seed-list tool. Monthly: Audit engagement trends per sending domain and remove the bottom 10-25% of underperformers. Before every campaign: Verify your list to catch invalid addresses and spam traps before they damage sender reputation. And always wait for at least 500 emails from a domain before acting on any data - anything less is noise, not signal.
Decision triggers to memorize:
- First inbox placement test shows spam - pause sends immediately
- Second consecutive spam result - replace the domain
- Warmup score drops to 95% or below - remove that sending account
- Bounce rate trending up - verify your list before the next send
- Listed on Spamhaus, Spamcop, Barracuda, or SURBL - stop all sends and investigate
Knowing how to measure email deliverability is only half the battle. Acting on the data with clear thresholds is what separates teams with 94% inbox placement from those stuck below 80%. If you need a deeper playbook, start with our email deliverability guide and then tighten your sending limits with email velocity.
FAQ
What's the difference between delivery rate and deliverability?
Delivery rate measures whether the receiving server accepted your email. Deliverability measures where it landed - inbox, promotions, or spam. A 98% delivery rate can still mean 15% of emails sit in spam, so always track inbox placement separately.
How often should I test inbox placement?
Run seed-list inbox placement tests biweekly and review engagement metrics monthly per sending domain. Only act on data after 500+ emails from a given domain - smaller samples produce unreliable signals.
Why do different tools give different results?
Each tool uses different seed lists, ISP coverage, and scoring methods. Pick one platform, use it consistently, and track directional trends rather than obsessing over absolute percentages.
Can I track deliverability for free?
Yes. Google Postmaster Tools, Microsoft SNDS, and Yahoo Sender Hub cover Gmail, Outlook, and Yahoo at zero cost. Combined with your ESP's bounce and complaint data, you get enough signal to catch reputation problems early.
How does list quality affect inbox placement?
Sending to invalid addresses, spam traps, and honeypots directly damages sender reputation and tanks inbox placement. Verifying your list before every campaign - removing catch-all domains, spam traps, and honeypots - keeps bounce rates under control and protects your domains from blocklisting.