How to Set Sales Targets: The Operational Playbook for 2026
A rep I know crushed $2.1M last year - exceeded target by a healthy margin. His reward? A new target of $2.75M, up from $1.95M. No new accounts. No expanded territory. Just a ~41% hike and a pat on the back. That's not target-setting - that's spreadsheet theater.
And it's everywhere. At one enterprise SaaS org, only 6 of 18 reps hit goal - a 33% attainment rate - while leadership increased headcount from ~22 to 45 without adding new accounts. When most salespeople miss, the problem isn't the salespeople.
What You Need (Quick Version)
Most orgs get three things wrong when setting sales targets - whether they're revenue quotas, activity quotas, or profit-based targets:
- Bottom-up capacity model. Stop picking a number from the board deck and dividing by headcount. Start with how many reps you actually have, when new hires ramp, and what realistic quota-per-rep looks like.
- Weighted pipeline coverage. The "3x pipeline" rule is a blunt instrument that treats a discovery call the same as a verbal commit. Weight your pipeline by stage probability or your coverage ratio is fiction.
- Ramp quotas. In a common 50/75/100 ramp, new reps don't hit full quota until month 7+. If you're not adjusting for ramp, you're building a plan that's structurally short from day one.
The rest of this guide gives you the actual math.
Why Most Sales Targets Fail
Cranfield University's research on sales effectiveness identified ten common issues that undermine target-setting. Every one of them shows up in the wild:
- Targets based on past performance. Last year's number plus 20% isn't a methodology. It's a guess with a growth tax.
- Targets allocated inappropriately across the sales force. This is the headcount/territory math problem - when coverage changes but quotas don't.
- Targets perceived as too high or too low. If reps believe the number is unachievable, effort and focus drop fast.
- Wrong performance measures. Measuring the wrong thing guarantees the wrong behavior.
- Targets entirely financial. Revenue-only targets ignore leading indicators that predict outcomes.
- Poor rigor in data analysis. Gut feel dressed up in a spreadsheet.
- Targets not periodically reviewed. Annual targets treated as fixed when the market shifts quarterly.
- Targets "given" to salespeople. No input from the field means no buy-in from the field.
- Interrelation between targets not considered. Marketing's target, SDR's target, and AE's target should be mathematically connected. They rarely are.
- Action plans are the exception, not the norm. A target without a plan is a wish.
One more Cranfield point worth flagging: there's increasing evidence that quota-free compensation plans can drive significant revenue growth, and quota-based incentives can push quota-filling behavior like end-of-quarter discounting.
Issues #2 and #3 generate the most rage on r/sales - and for good reason. When leadership adds headcount, cuts territories, and still expects the same pipeline coverage per rep, the math simply doesn't work.
Top-Down vs. Bottom-Up Planning
Most companies do target-setting backwards. They start with a board-level revenue number, divide by headcount, and call it a quota. That's top-down planning, and it's the default because it's fast and aligns to investor expectations.
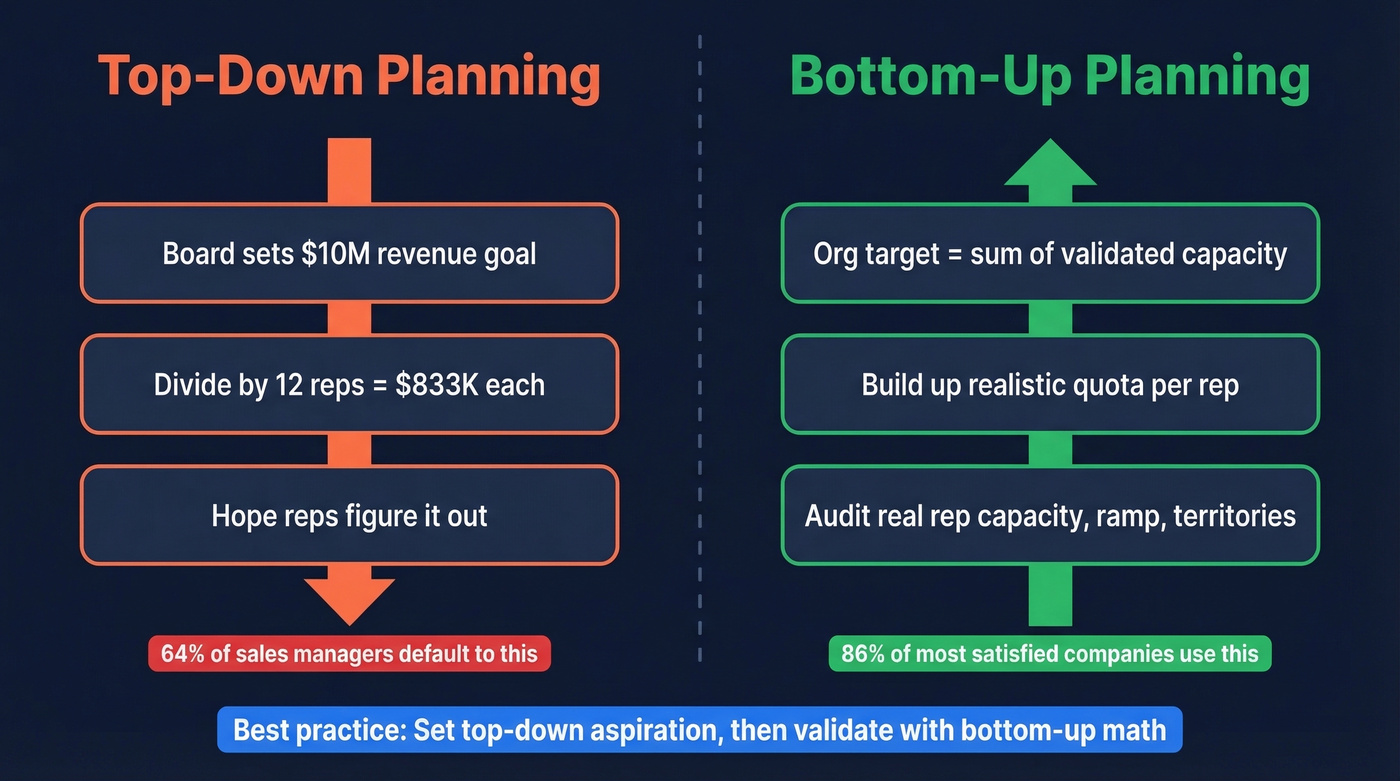
Bottom-up planning starts from the field. What can each rep realistically produce given their territory, ramp status, and pipeline? You build up from there. It's slower, messier, and dramatically more accurate.
A 2021 Varicent survey found that 64% of sales managers prefer top-down planning. But 60% of C-suite executives prefer bottom-up. The most telling stat: among the "most satisfied" companies in the study, 86% used bottom-up planning.
In our experience, the sweet spot is blending both - set a top-down aspiration, then validate it with a bottom-up capacity model. If the two numbers are far apart, something's broken and you need to reconcile before publishing quotas.
How to Calculate Your Sales Target
Let's build a bottom-up capacity model step by step. You need five inputs, per Cube's capacity planning framework:
Current headcount. How many quota-carrying reps do you have today - not on the org chart, but actually ramped and producing?
Planned hires with start dates. Not "we plan to hire 5 reps in Q2" but "2 start April 1, 3 start May 15." The dates matter because ramp matters.
Quota per rep. What's a realistic annual number for a fully ramped rep in this territory and segment?
Average deal size. This determines how many deals each rep needs to close, which connects directly to pipeline and activity math.
Attrition factor. If you lose 20% of reps annually, your effective capacity is 80% of what the org chart says.
Worked Example
Say you have 10 ramped AEs, each carrying $800K annual quota. You're hiring 4 more - 2 starting in Q1, 2 in Q2. Historical attrition runs 15%.
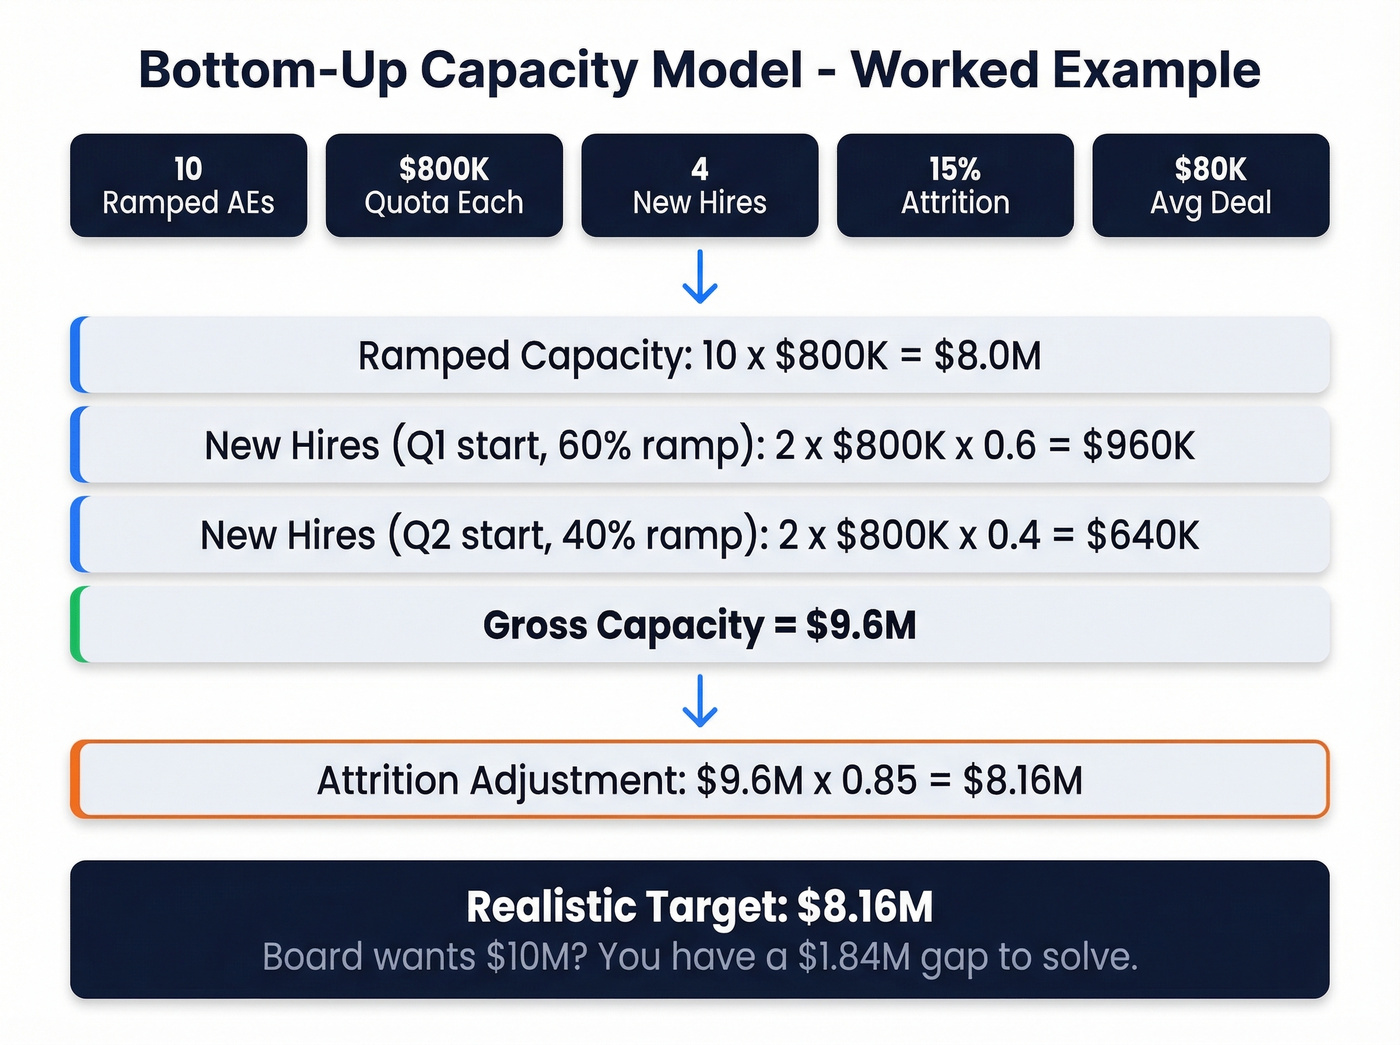
- Ramped capacity: 10 x $800K = $8M
- New hire capacity (Q1 starts, ramp-adjusted): 2 x $800K x 0.6 = $960K
- New hire capacity (Q2 starts, ramp-adjusted): 2 x $800K x 0.4 = $640K
- Gross capacity: $8M + $960K + $640K = $9.6M
- Attrition-adjusted: $9.6M x 0.85 = $8.16M
At an average deal size of $80K, each ramped rep needs to close 10 deals per year - roughly 30-40 qualified opportunities per rep at a 25-33% close rate. That math connects directly to the pipeline section below.
So your realistic bottom-up target is $8.16M. If the board wants $10M, you've got a $1.84M gap to close through more hires, higher quota, or better conversion. Not through wishful thinking.
One critical adjustment: reps spend 60% of their time on non-selling tasks. Your capacity model should account for this. If you're assuming reps spend 100% of their time selling, you're overestimating selling capacity by more than half.
A useful planning heuristic from Jiminny's target-setting framework: set your sales target 15-20% above the sales budget to build in room for challenges and growth.
Here's the thing: if your average contract value is under $15K and your sales cycle is under 30 days, you probably don't need a complex capacity model at all. A simple "reps x deals x ACV" formula updated monthly will outperform a bloated planning exercise that nobody maintains.
Pipeline Coverage: Why "3x Pipeline" Is a Lie
The "3x pipeline" rule is the most widely cited and least useful metric in sales. Everyone knows it. Reddit threads treat it as gospel. And it's fundamentally broken.
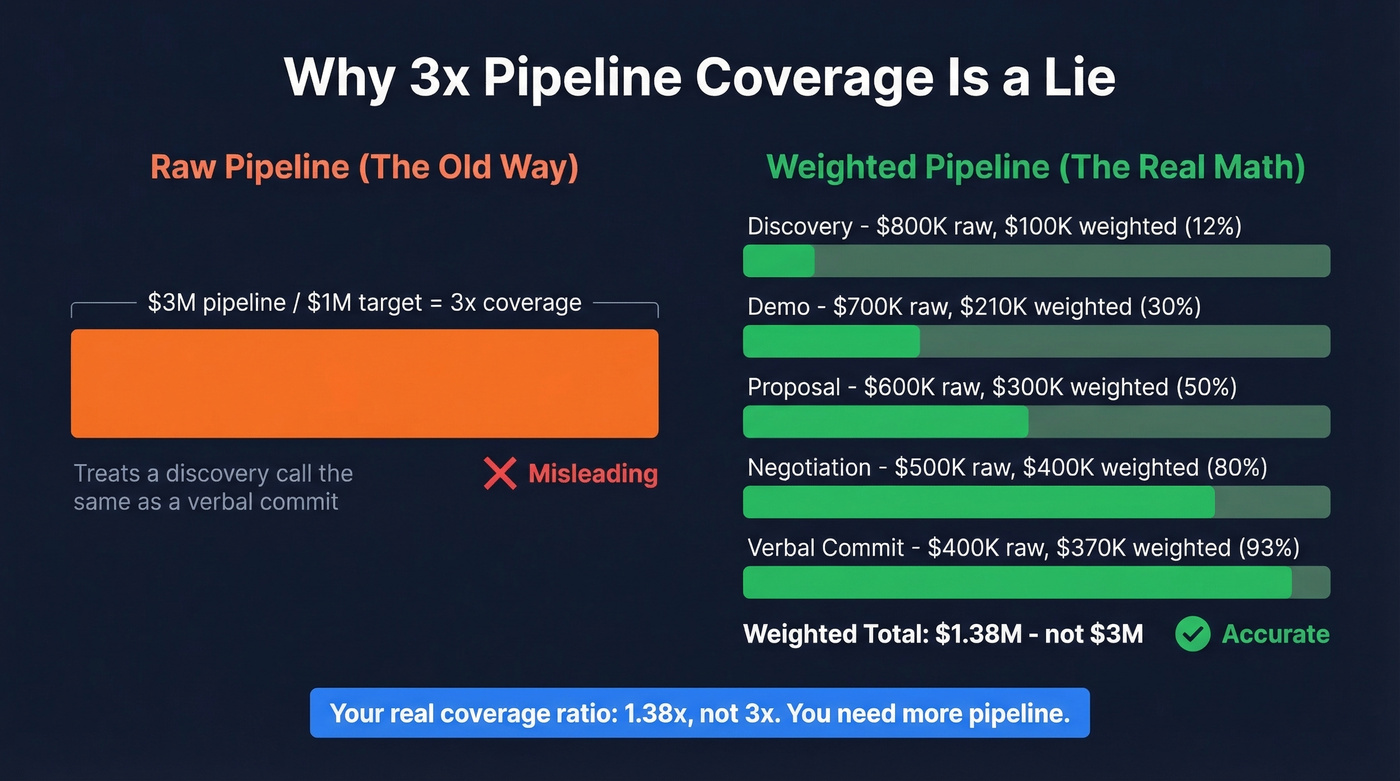
A 3x ratio assumes a 33% close rate and treats every deal in your pipeline equally. A $200K deal in discovery gets the same weight as a $200K deal in contract negotiation. That's absurd. High-ICP accounts represent only 23% of total pipeline for many orgs - meaning 77% of your raw pipeline is lower-quality deals that close at far lower rates.
The fix is weighted pipeline. Assign a win probability to each stage based on your historical conversion data, then multiply deal value by that probability.
Stage Probabilities
| Stage | Win Probability | $100K Deal Weighted |
|---|---|---|
| Discovery | 10-15% | $10K-$15K |
| Demo | ~30% | ~$30K |
| Proposal | ~50% | ~$50K |
| Negotiation | ~80% | ~$80K |
| Verbal commit | 90-95% | $90K-$95K |
These are illustrative ranges from Software Equity Group. Your actual numbers should come from your CRM's historical stage-to-close conversion rates.
Coverage Ratios by Sales Motion
| Motion | Typical Win Rate | Coverage Needed |
|---|---|---|
| SMB | ~30-40% | 1.5-2x |
| Mid-market | ~20-25% | ~3x |
| Enterprise | ~10-15% | 4-5x |
Now layer in time-shifting. If your sales cycle is 3 months and you need $500K in Q2 revenue at a 25% close rate, you need $2M in opportunity creation in Q1. Not Q2 - Q1. The pipeline you're counting today needs to have been created one full sales cycle ago to close on time.
If your leadership is demanding 3x pipeline from enterprise reps with 9-month sales cycles and shrinking territories, show them the weighted model. The math speaks for itself.
Your bottom-up capacity model only works if reps have enough qualified pipeline to hit quota. Prospeo gives your team 300M+ verified profiles with 30+ filters - intent data, headcount growth, technographics - so every rep's territory has real coverage, not inflated numbers.
Stop setting targets your pipeline can't support. Fix the data first.
Breaking Down Targets by Rep and Quarter
Once you have an org-level number, the next challenge is distributing it individually. A flat divide-by-headcount approach ignores territory size, account quality, and ramp status - all of which vary dramatically across your team.
Start by segmenting reps into tiers based on capacity: fully ramped, mid-ramp, and new hires. Assign quota proportionally using the ramp percentages from the next section. Then adjust for territory potential. A rep covering enterprise accounts in a saturated market shouldn't carry the same number as one covering greenfield mid-market territory with twice the addressable pipeline.
For quarterly distribution, avoid splitting the annual number into four equal parts. Most B2B orgs see seasonality - Q4 is typically strongest, Q1 weakest. Weight your quarterly targets to match historical booking patterns, and you'll have a plan reps actually believe in.
Ramp Quotas: The Missing Piece
Giving a new rep full quota on day one is the fastest way to burn $100K+ in hiring costs. Structured ramp quotas generate roughly 23% more first-year revenue compared to the sink-or-swim approach.
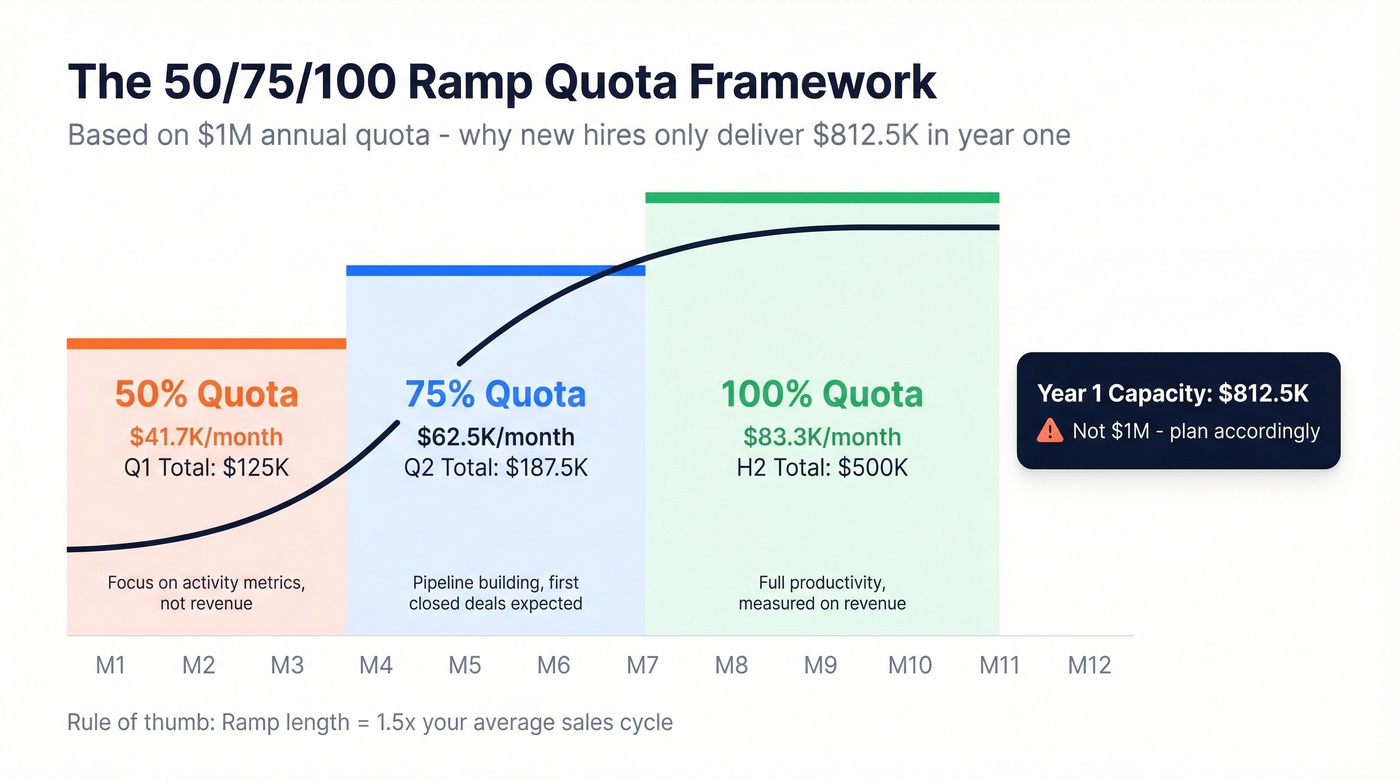
The most common framework is 50/75/100:
| Ramp Period | Monthly Target | Quarterly Total |
|---|---|---|
| Months 1-3 (50% quota) | $41,666 | $125,000 |
| Months 4-6 (75% quota) | $62,500 | $187,500 |
| Months 7-12 (full quota) | $83,333 | $500,000 |
| Year 1 total | $812,500 |
Based on a $1M annual quota, that's $812,500 in year-one capacity - not $1M. If your capacity model assumes $1M from every rep regardless of start date, you're structurally short by nearly 19% on every new hire.
A useful heuristic for ramp length: set it at roughly 1.5x your average sales cycle. If deals take 4 months to close, plan for a 6-month ramp. This accounts for the learning curve plus the time it takes to build a pipeline from scratch.
Early ramp milestones should be activity-based, not revenue-based. Meetings booked, proposals sent, pipeline created. Shift to revenue targets once the rep has enough at-bats to produce meaningful conversion data. We've seen teams cut rep ramp time nearly in half by giving new hires verified contact data on day one instead of making them build lists manually - GreyScout dropped ramp from 8-10 weeks to 4 weeks this way.
Performance Metrics Beyond Revenue
Revenue is the lagging indicator. If you only measure revenue, you'll know you missed - but you won't know why until it's too late.
The best sales orgs layer in leading and process metrics that predict revenue outcomes weeks or months in advance. Activity targets - calls made, emails sent, meetings booked - give you early warning signals. If a rep's activity drops in week 3, you don't need to wait until quarter-end to intervene. Pipeline creation targets tell you whether reps are generating enough new opportunities to sustain their number. Conversion rate targets at each stage help you diagnose where deals are stalling.
The key is connecting these metrics in a chain: activity -> pipeline created -> pipeline advanced -> revenue closed. When you can trace a miss back to a specific break in that chain, you fix the process instead of just pressuring the rep.
If you want a clean way to operationalize this, start with sales activities and then map them to pipeline health metrics that predict bookings.
SaaS Benchmarks for 2026
If you're setting SaaS targets without industry benchmarks, you're guessing. Here are the numbers that matter, from Benchmarkit's 2025 benchmark report:
| Metric | Median | What It Means for Your Targets |
|---|---|---|
| YoY growth | 26% | Your board's 40% target needs justification |
| Net revenue retention | 101% | Expansion barely offsets churn |
| New CAC ratio | $2.00 : $1 ARR | Spending $2 to acquire $1 in new ARR |
| Expansion ARR share | 40% of new ARR | Nearly half of "new" revenue is expansion |
| ARR per FTE | $200K-$300K | Efficiency benchmark for headcount planning |
Two numbers jump out. First, expansion ARR represents 40% of total new ARR - and over 50% at companies above $50M. If your targets are 100% new-logo focused, you're ignoring where nearly half the revenue actually comes from.
Second, the New CAC Ratio of $2.00 means you're spending $2 in sales and marketing for every $1 of new customer ARR. That's the median. Bottom-quartile companies spend $2.82. If your target assumes CAC efficiency that doesn't exist, you'll hit the number on paper and lose money doing it.
If you need to pressure-test your assumptions, compare your win rates against sales conversion rate benchmarks and sanity-check your funnel with funnel metrics.
Bad Data Breaks Every Target
You've built the capacity model. You've weighted the pipeline. You've set ramp quotas. One variable can still blow the whole thing up: data quality.
If 30-40% of the emails in your pipeline are stale or invalid, your 3x coverage is actually 2.1x to 1.8x. 57% of sales pros say cycles are getting longer - and a big reason is reps chasing contacts who've changed roles, left companies, or never had a valid email in the first place.
This is where data accuracy becomes a planning variable, not just an ops concern. Prospeo's 98% email accuracy and 7-day refresh cycle means the contacts your pipeline is built on are actually reachable. Snyk's sales team saw bounce rates drop from 35-40% to under 5%, and AE-sourced pipeline jumped 180% after switching to verified data. That's not a marginal improvement - it's the difference between a pipeline that converts and one that decays.
If you're trying to fix this systematically, start with data enrichment and a repeatable lead generation workflow so your CRM doesn't rot between quarters.

Reps already spend 60% of their time on non-selling tasks. Don't waste the other 40% on bad contact data. Prospeo delivers 98% email accuracy and 125M+ verified mobiles - so every dial and send counts toward the number.
Give your reps data that converts instead of quotas that punish.
FAQ
What's the difference between a sales target and a sales quota?
Targets are organizational forecasting tools; quotas are individual performance expectations tied directly to compensation. Most orgs use them interchangeably, but the distinction matters for comp plan design. A target can flex mid-quarter. A quota triggers a payout.
How often should you review sales targets?
Quarterly at minimum, monthly for fast-moving SMB motions where market conditions shift quickly. Treat annual targets as a starting framework, not a fixed number - adjust each quarter for attrition, ramp delays, and pipeline reality.
What's a realistic pipeline coverage ratio?
SMB with short cycles and higher win rates: 1.5-2x. Mid-market: roughly 3x. Enterprise with long cycles and lower win rates: 4-5x. Always use weighted pipeline based on stage probabilities - raw deal count inflates coverage by 30-50%.
How do you set targets for a new team with no historical data?
Start with a capacity model - headcount times realistic quota per rep, adjusted for ramp. Use industry benchmarks for win rates and deal sizes. Set activity-based targets for the first two quarters, then shift to revenue targets once you have enough conversion data to calibrate.
How does data quality affect target accuracy?
If 30-40% of your contact data is stale, your pipeline coverage is inflated by the same margin. Verified, regularly refreshed data ensures your pipeline reflects real opportunities rather than dead contacts - the difference between a target grounded in reality and one built on fiction.