Lead Quality vs Quantity: A Data-Driven Framework for 2026
Your SDR just called through 500 webinar leads. One meeting booked. Marketing's celebrating 120% of MQL target while sales hit 60% of quota. Sound familiar?
The lead quality vs quantity debate isn't philosophical anymore - it's settled by math, and the math isn't kind to volume-first teams. Today's B2B deals involve 13 decision-makers on average, with 80% of buyer interactions happening digitally. The answer isn't generating fewer leads. It's generating the same volume, then building systems that separate signal from noise automatically.
The Short Version
- Fix your MQL definition first. The average MQL-to-SQL conversion rate is 15%. That's where quality failures live.
- Build a lead scoring model with positive, negative, and decay scoring. Template below - you can implement it this week.
- Verify your data before you score it. A perfectly scored lead with a dead email is worthless.
The Real Cost of Chasing Volume
A fully loaded SDR costs roughly $80-100k/year - about $40-50/hour. Each unqualified lead takes 8-12 minutes to research, call, and disqualify. That's $5-10 per bad lead in pure labor, before opportunity cost.
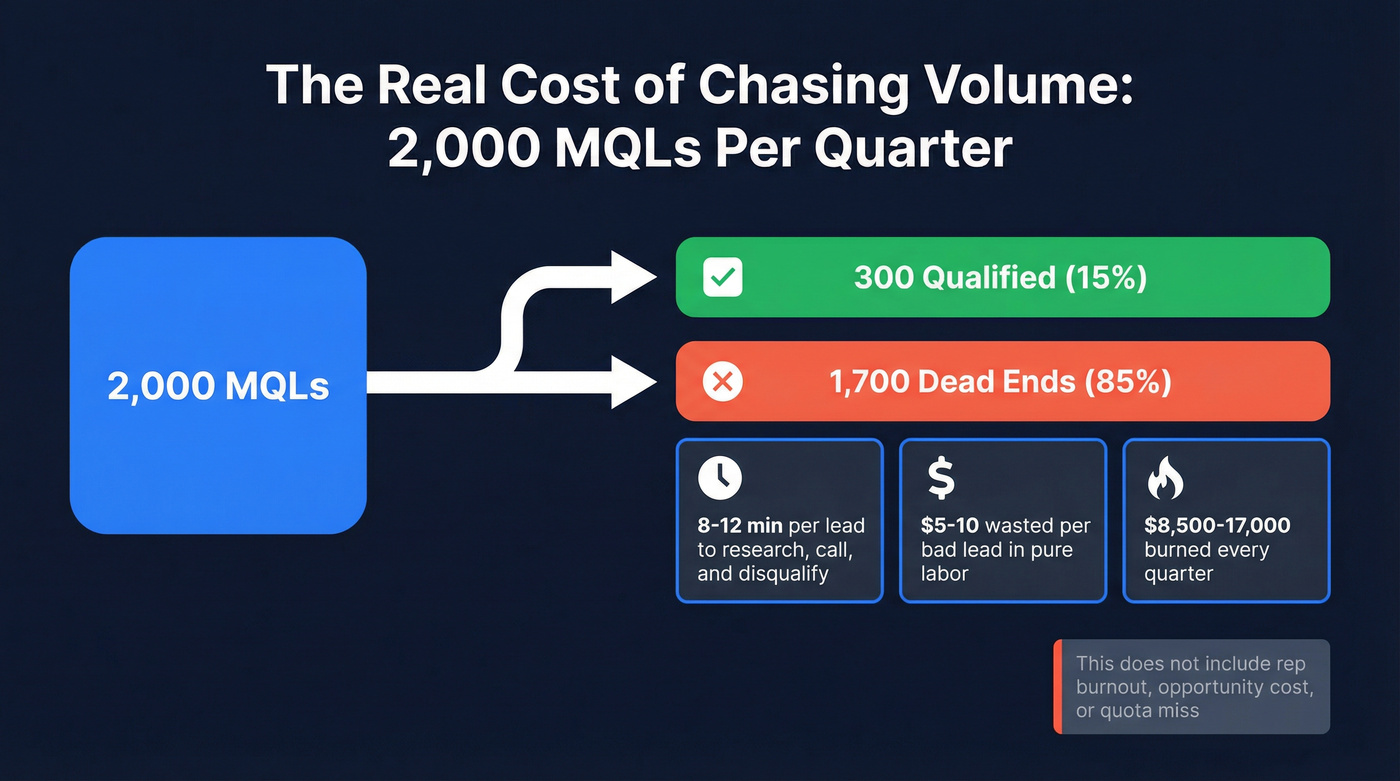
Apply the 15% MQL-to-SQL conversion rate. Out of every 100 MQLs, 85 go nowhere. An SDR team processing 2,000 MQLs per quarter wastes 1,700 on dead ends - $8,500-17,000 in burned time. Every quarter. And that's just direct cost.
It doesn't account for the rep burnout that drives your best people to quit. Sales teams on r/sales consistently report the same frustration: drowning in MQLs that marketing swears are qualified while quota slips further away. The tension between quality and quantity is most visible right at the handoff where marketing metrics and sales reality collide.
Here's the thing: if marketing is celebrating 5,000 new leads while sales says 80% are garbage, you don't have a lead gen problem. You have a definition problem.
2026 Funnel Benchmarks
Stage-by-stage, here's what a typical B2B funnel looks like based on the most recent available benchmarks:
| Stage | Conversion Rate |
|---|---|
| Lead to MQL | 35-45% |
| MQL to SQL | 15% |
| SQL to Opportunity | 25-30% |
| Opp to Closed-Won | 6-9% |
| Overall Lead to Customer | 1.5-2.5% |
That 15% MQL-to-SQL gap is the single biggest leak in most pipelines. For B2B SaaS specifically, opportunity-to-close rates hover around 20-30%, with enterprise sales cycles stretching 6-18 months. Every percentage point of improvement at the MQL-to-SQL handoff compounds downstream.
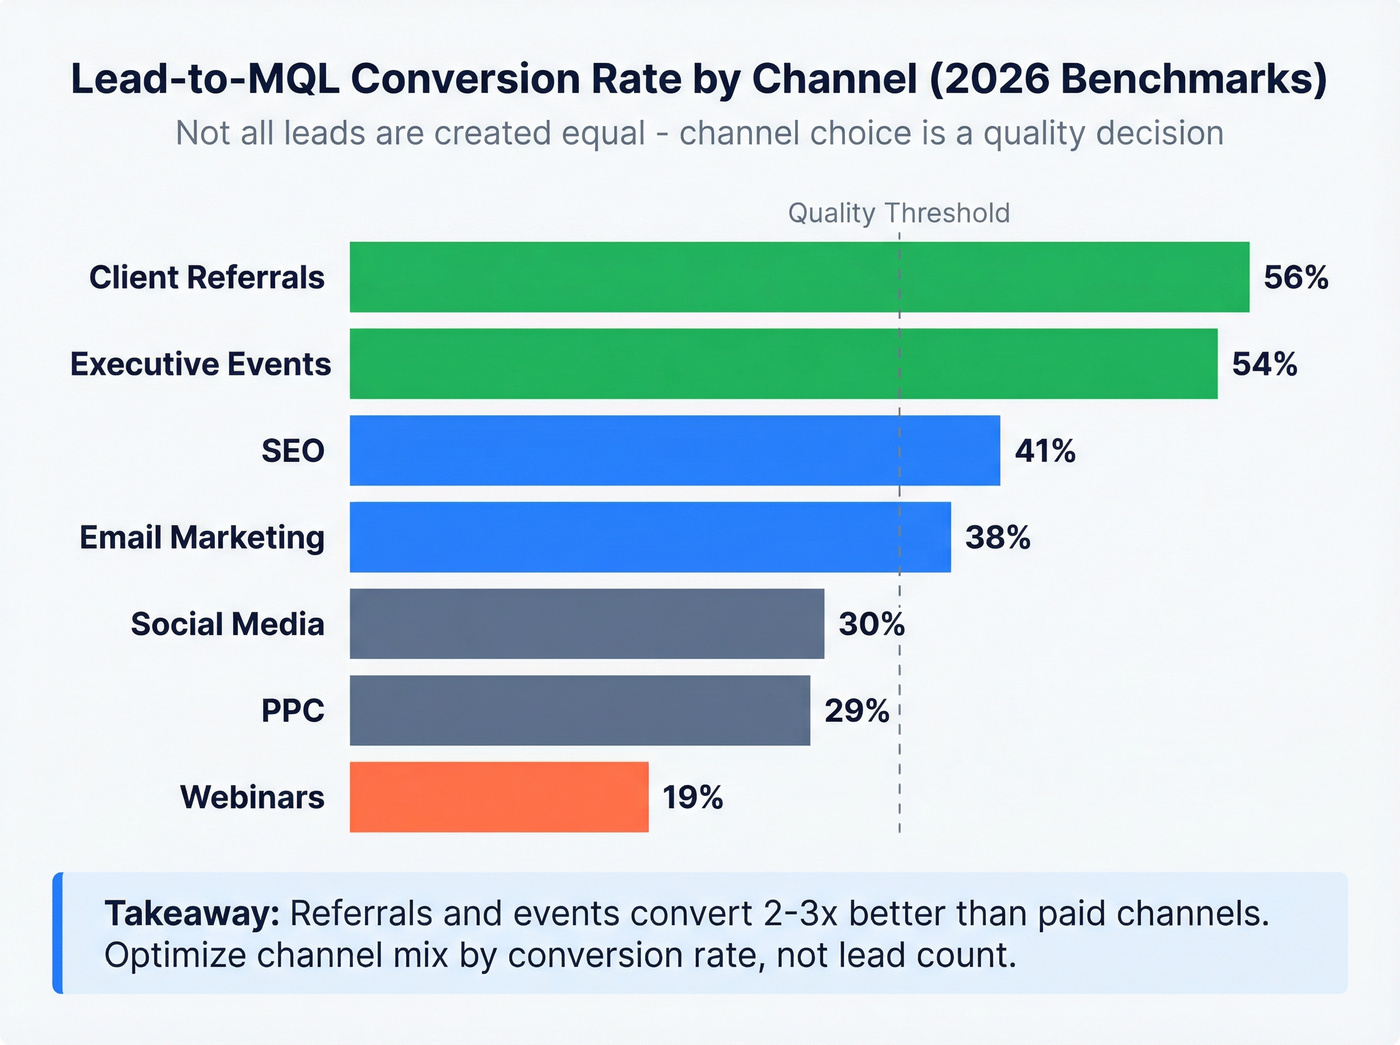
Now look at how channels perform on lead-to-MQL conversion:
| Channel | Lead to MQL Rate |
|---|---|
| Client referrals | 56% |
| Executive events | 54% |
| SEO | 41% |
| Email marketing | 38% |
| Social media | 30% |
| PPC | 29% |
| Webinars | 19% |
Referrals and executive events crush everything else - not because they generate more leads, but because they generate better ones. High-quality leads don't just convert faster; they produce higher lifetime value. Track CLV by lead source and you'll see which channels generate customers who stick versus those who churn at renewal.
The quality-quantity tradeoff is a false choice when you optimize channel mix by conversion rate instead of lead count.
You just read the math: 85 out of 100 MQLs go nowhere, costing your team $8,500-17,000 per quarter. Half that waste comes from bad data - bounced emails, stale contacts, wrong titles. Prospeo's 7-day refresh cycle and 98% email accuracy mean your scoring model grades real buyers, not ghosts.
Verify before you score. Your pipeline depends on it.
Build a Lead Scoring Model This Week
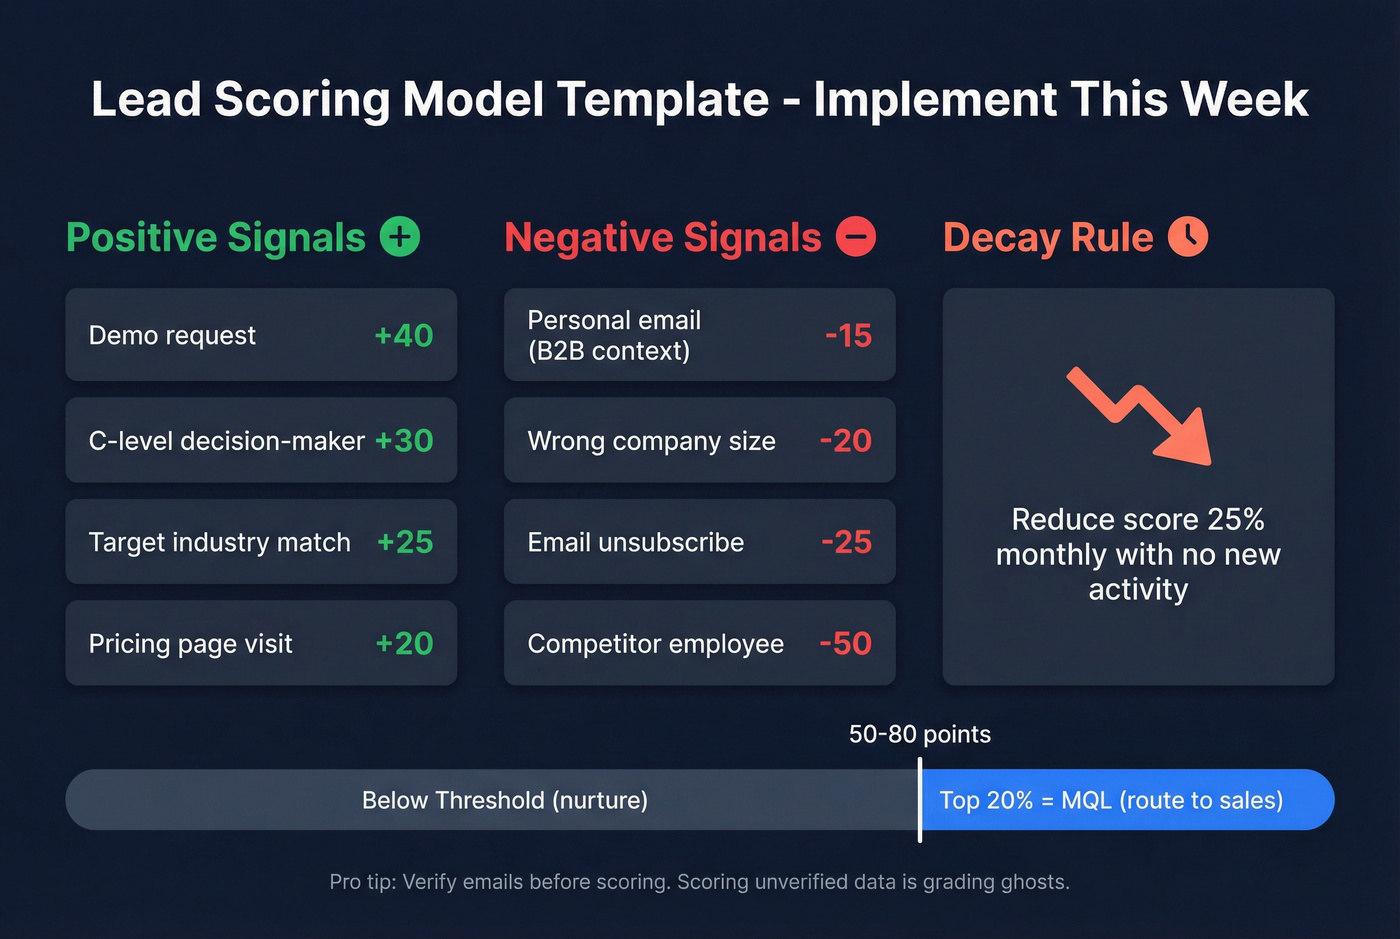
Most teams overthink scoring. Start with 5-7 core criteria. You need positive signals, negative signals, and a decay mechanism. That's it. Eighty-nine percent of revenue orgs now use AI somewhere in their pipeline (up from 34% in 2023), but a simple demographic-behavioral model outperforms no model by a mile.
| Signal | Points |
|---|---|
| Demo request | +40 |
| C-level decision-maker | +30 |
| Target industry match | +25 |
| Pricing page visit | +20 |
| Personal email (B2B context) | -15 |
| Wrong company size | -20 |
| Email unsubscribe | -25 |
| Competitor employee | -50 |
Set your MQL threshold to capture the top 20% of leads by score - typically 50-80 points on a 100-point scale. Add a decay rule: reduce scores 25% monthly without new activity. Stale leads shouldn't clog your pipeline.
Before you score, verify. Run your list through an email verification tool to strip dead emails before they enter the model. We've watched teams build elaborate scoring systems on top of data where a third of the emails bounce. Scoring unverified data is grading ghosts.
One more thing: scoring without routing is a spreadsheet exercise. Every lead that crosses your threshold needs to hit a rep's queue within minutes, not days.
Aligning Sales and Marketing
If your MQL definition hasn't changed since 2019, that explains the 15% MQL-to-SQL rate. Build a sales-marketing SLA with four elements:
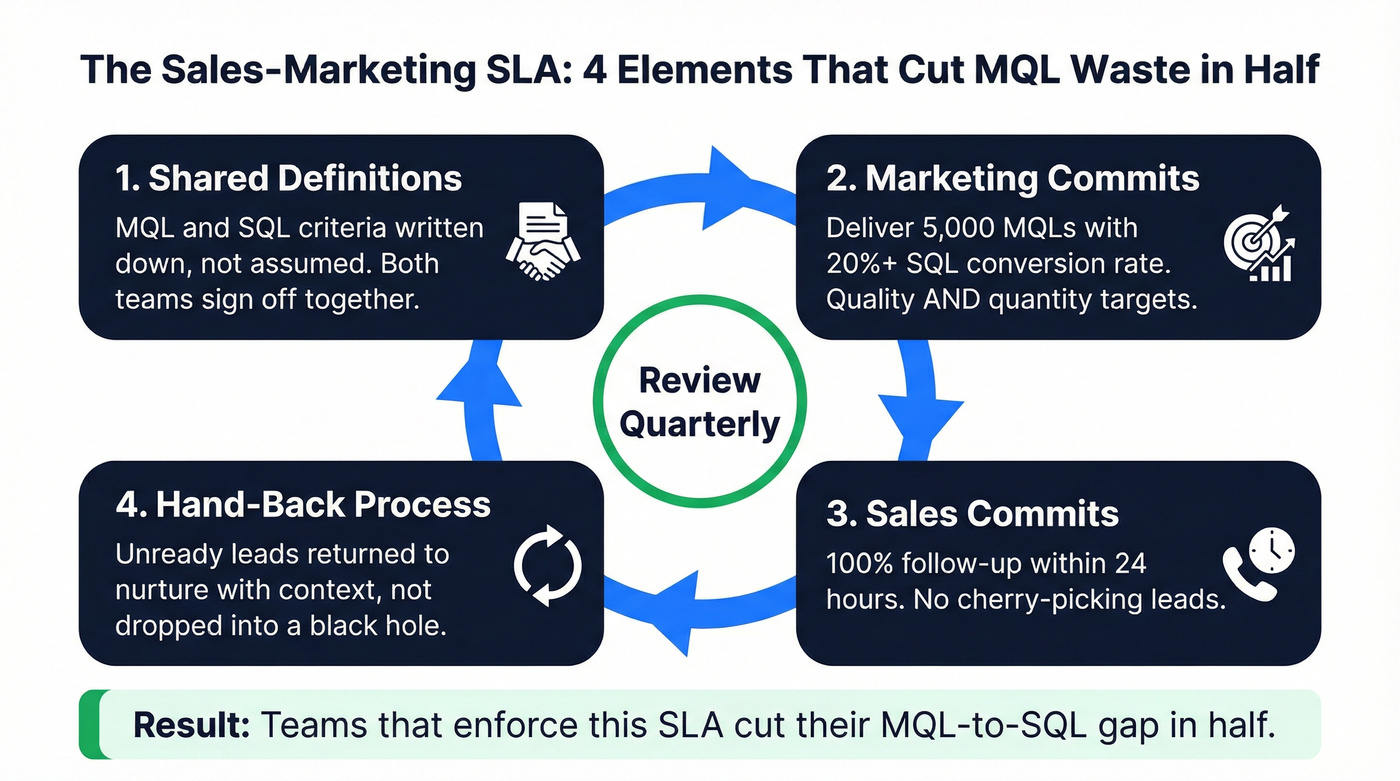
Shared MQL/SQL definitions - written down, not assumed. Both teams sign off. Marketing commits to quantity and quality targets: "deliver 5,000 MQLs with a 20%+ SQL conversion rate." Sales commits to 100% follow-up within 24 hours, no cherry-picking. And you need a hand-back process for leads that aren't ready - returned to nurture with context, not dropped into a black hole.
Review quarterly. We've seen teams cut their MQL-to-SQL gap in half just by updating definitions and enforcing follow-up SLAs. It's not glamorous work, but it's the highest-ROI thing most orgs can do right now.
Using Intent Data as a Quality Signal
Buyers complete 60-90% of their decision-making before they ever contact you, consuming roughly 11 pieces of content along the way. Intent data lets you see that research happening in real time - yet only 25% of companies use intent data tools. Among those who do, 96% report success, with 220% higher CTR and 82% faster conversion.
Three flavors matter. First-party intent tracks behavior on your owned properties - pricing page visits, product milestones, email engagement. Third-party intent captures research happening on external sites and review platforms. Hybrid intent combines both for the highest-confidence signal. 68% of B2B marketers are increasing their intent data investment this year. Layer these signals into your scoring model and you stop guessing who's in-market.
Skip intent data if your team doesn't have the bandwidth to act on the signals within 48 hours. Buying intent data you can't operationalize is just a more expensive way to ignore leads.
Data Accuracy: The Hidden Quality Variable
Let's be honest - if a third of your emails bounce, your scoring model is worthless. This is the piece most teams ignore because it's less exciting than buying a new intent platform or redesigning your scoring rubric.
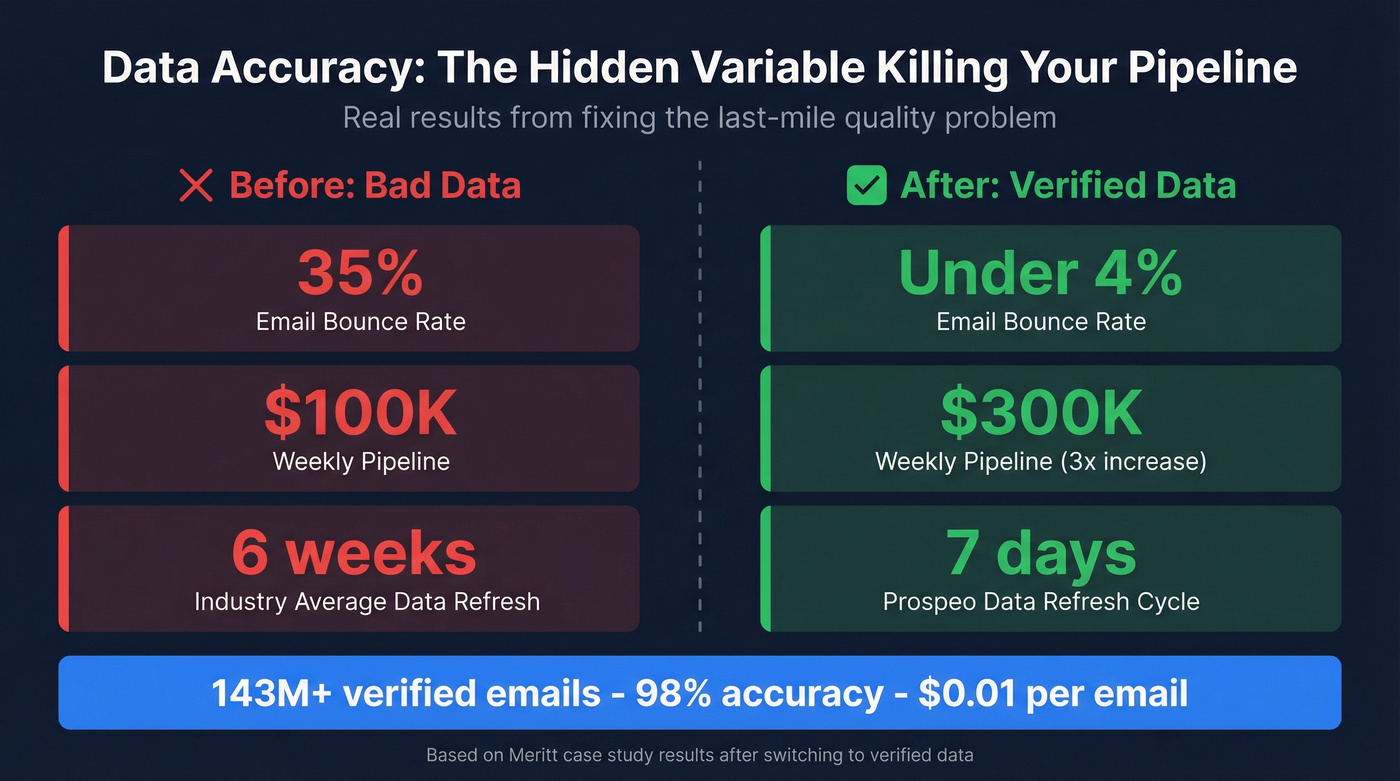
Prospeo runs a 7-day data refresh cycle where the industry average is six weeks. With 143M+ verified emails at 98% accuracy, it solves the last-mile quality problem that quietly undermines everything upstream. One example: Meritt went from a 35% bounce rate to under 4% after switching, and their pipeline tripled from $100K to $300K per week. The free tier lets you test this without a sales call or contract.
If you want to pressure-test your inputs, start with data accuracy and CRM hygiene before you touch scoring weights.
Intent signals are useless if the contact data underneath is dead. Prospeo combines 143M+ verified emails with Bombora intent data across 15,000 topics - so you reach in-market buyers at valid addresses, not bounce into the void. At $0.01 per email, fixing data quality costs less than one bad MQL.
Layer intent on verified data and watch your SQL rate double.
FAQ
What's more important - lead quality or lead quantity?
Quality wins. The average MQL-to-SQL conversion rate is 15%, meaning most pipelines already have a severe quality problem. Tighter targeting consistently outperforms broader reach. Fix scoring, intent signals, and data accuracy before scaling volume.
How do you measure lead quality?
Track MQL-to-SQL conversion (benchmark: 15%), lead-to-customer rate (benchmark: 1.5-2.5%), and CLV by source. Layer in lead score distribution and bounce rate - if bounces exceed 4%, your quality metrics are built on bad data.
What tools help improve lead quality?
A CRM with lead scoring (HubSpot, Salesforce), an intent data provider (Bombora), and a verification platform to ensure scored leads are actually reachable. The combination of scoring plus verification is what separates teams that hit quota from teams that just hit MQL targets.