Lead Velocity Rate: The Metric Your SaaS Board Should See Every Month
Your VP of Sales just told the board the pipeline looks healthy. Deals are moving, reps are busy, and the forecast feels solid. But nobody noticed that qualified lead volume has been flat for three straight months. By the time revenue dips - 90 days from now - everyone's scrambling.
Lead velocity is the metric that catches this before it becomes a crisis. Specifically, lead velocity rate (LVR) is the closest thing SaaS has to a real-time growth predictor.
The Quick Version
The formula: (This Month's Qualified Leads - Last Month's) / Last Month's x 100
Healthy benchmark: 15-25% month-over-month growth in qualified leads.
Track these three metrics this quarter:
- Lead velocity rate - leading indicator of pipeline health
- MQL-to-SQL conversion rate - quality check on those leads
- Net MRR growth - the lagging confirmation it's all working
The biggest mistake teams make: inconsistent definition of "qualified lead." If marketing counts every webinar registrant as an MQL one month and tightens criteria the next, your LVR is noise, not signal.
What Is Lead Velocity Rate?
Lead velocity rate measures month-over-month percentage growth in qualified leads. It's a leading indicator - it tells you where revenue is headed before revenue confirms it. Jason Lemkin popularized the concept on SaaStr, calling it "the most important metric in SaaS." Bold claim, but the logic holds: revenue reflects decisions made months ago, while LVR reflects what's happening right now.
LVR = ((Current Month Qualified Leads - Prior Month Qualified Leads) / Prior Month Qualified Leads) x 100
A practitioner on r/SaaS shared their experience: qualified leads went from 50 to 58 per month - a 16% LVR. Their team initially dismissed it as trivial. But 16% monthly growth compounds to roughly 5x over a year. Small absolute numbers signal serious trajectory changes.
Here's the key insight. LVR predicts revenue with a lag roughly equal to your sales cycle. If your median cycle sits around the benchmark 84 days, strong LVR today means stronger bookings next quarter. If LVR goes flat, you've got about three months before the board starts asking uncomfortable questions.
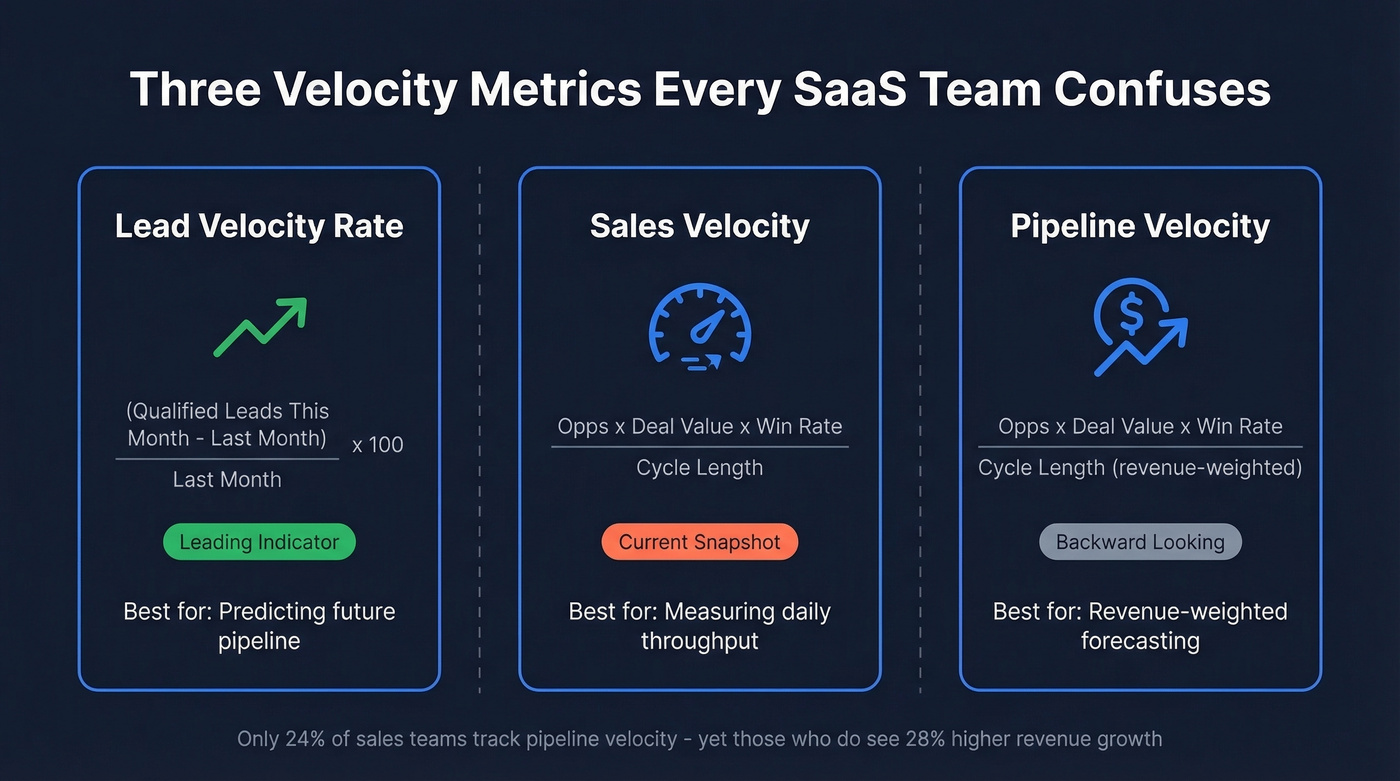
LVR vs. Sales Velocity vs. Pipeline Velocity
These three metrics sound similar but measure fundamentally different things.
| Metric | What It Measures | Formula | Best For |
|---|---|---|---|
| Lead Velocity Rate | MoM growth in qualified leads | (QLs this month - last) / last x 100 | Predicting future pipeline |
| Sales Velocity | Revenue generated per day | Opps x Deal Value x Win Rate / Cycle Length | Measuring current throughput |
| Pipeline Velocity | How quickly pipeline turns into revenue | Opps x Deal Value x Win Rate / Cycle Length | Revenue-weighted forecasting |
LVR is the most actionable of the three when you want an early warning signal - it tells you what's coming before bookings and revenue confirm it. Sales velocity is useful but backward-looking; by the time it drops, the damage is done. Only 24% of sales teams track pipeline velocity at all, and companies that focus on it see 28% higher revenue growth.
The pipeline-dollar variant is worth knowing too. HubSpot's explanation uses an EchoSign example: if qualified pipeline grew from $1.0M to $1.1M month-over-month, that's a 10% pipeline LVR. This version accounts for deal size shifts that a pure lead-count metric would miss entirely.
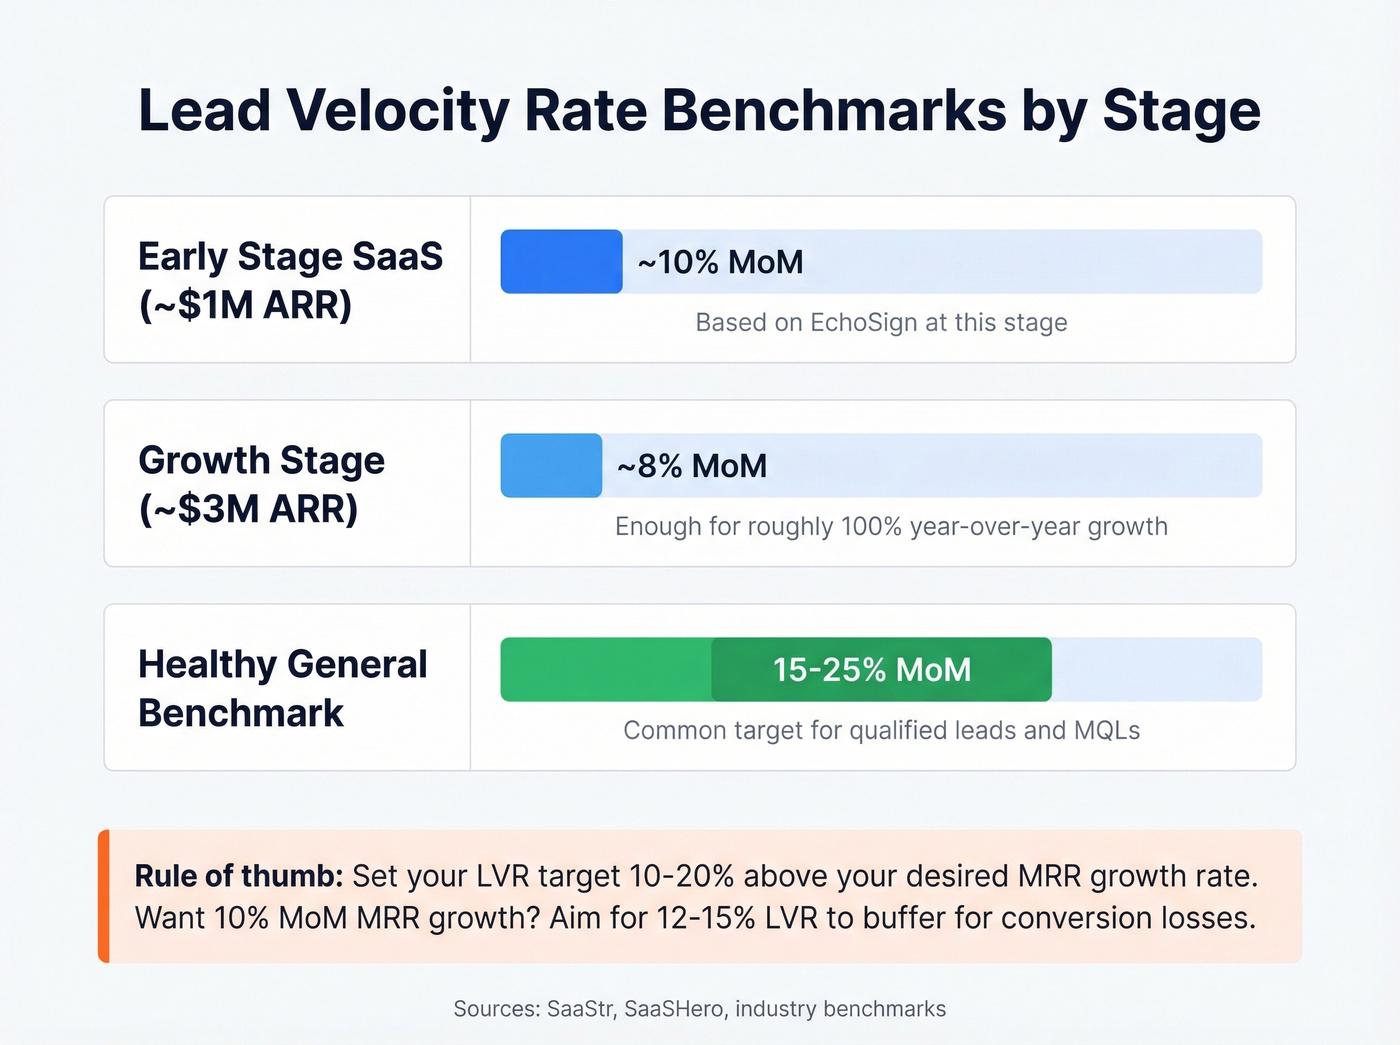
What's a Good LVR Benchmark?
Here are benchmarks you can actually anchor to:
| Company Stage / Context | LVR Target | Context |
|---|---|---|
| General "healthy" benchmark | 15-25% MoM | Common range for qualified leads/MQLs |
| ~$1M ARR run rate | ~10% MoM | EchoSign's target at this stage |
| ~$3M ARR run rate | ~8% MoM | Enough for ~100% YoY growth |
A useful rule of thumb: set your LVR target 10-20% above your desired MRR growth rate. If you want 10% MoM MRR growth, aim for 12-15% LVR to buffer for conversion losses along the funnel.
Here's the thing: if your average deal size is under $10k and your sales cycle is under 30 days, LVR matters more than literally any other metric on your dashboard. Revenue will follow qualified leads almost mechanically at that price point. Stop over-engineering your reporting and just grow the top of the funnel.
Growing lead velocity only matters if those leads are real. Gift-card webinars and loose MQL definitions inflate LVR while bounced emails destroy your domain. Prospeo's 98% verified emails and 30+ ICP filters mean every lead you count actually reaches a real buyer.
Stop inflating LVR with bad data. Start with leads that connect.
Defining "Qualified Lead" for LVR
Most teams don't have an LVR problem. They have a definition problem. We've seen this kill LVR tracking at companies that otherwise had strong data cultures - marketing and sales simply couldn't agree on what "qualified" meant.
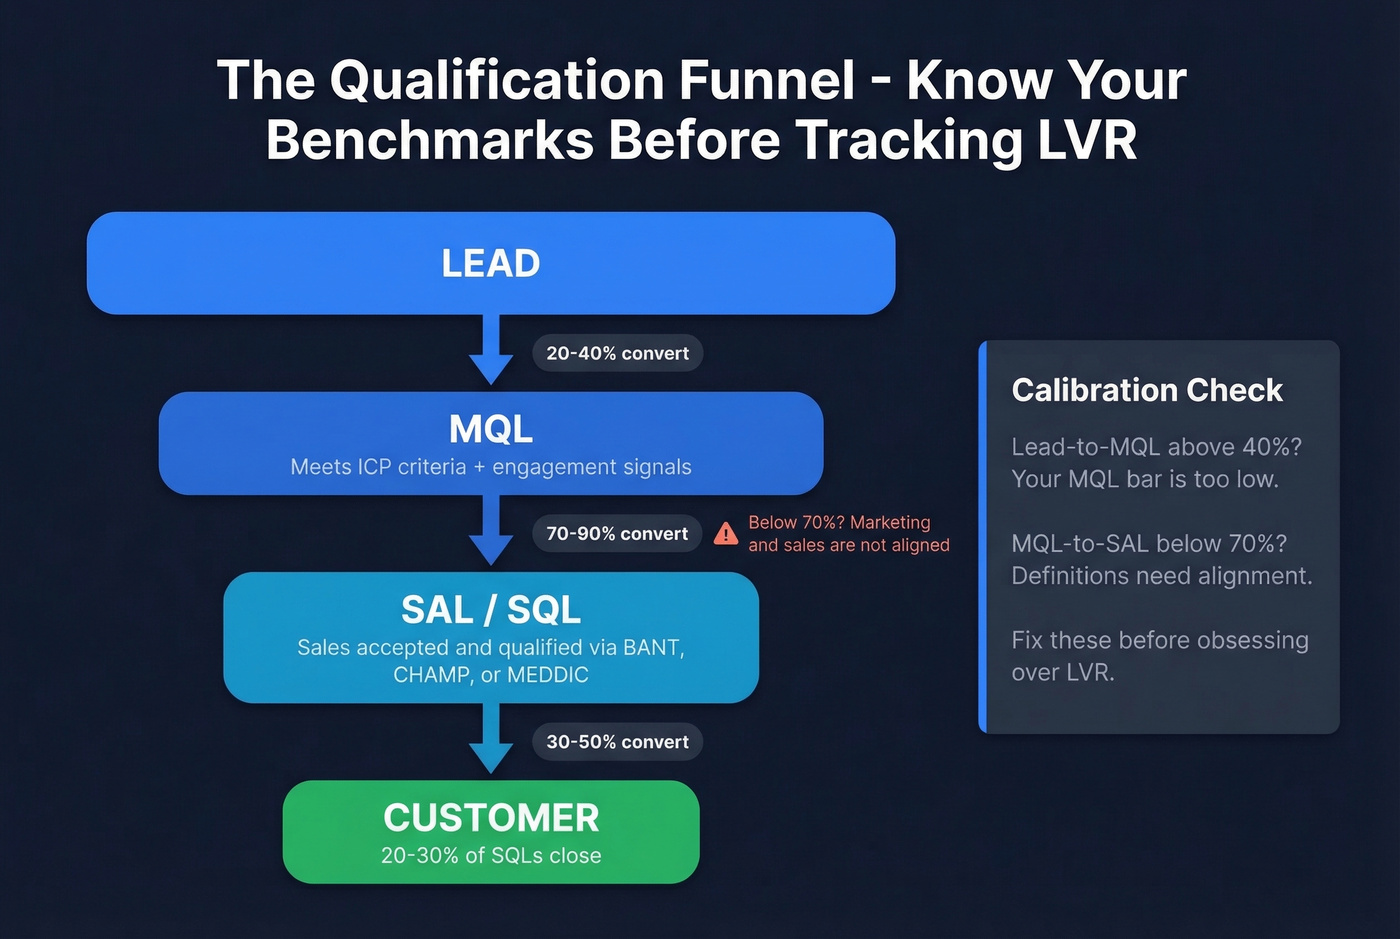
An MQL should meet ICP criteria like company size, industry, and role, plus show engagement signals such as pricing page visits, demo requests, or webinar attendance. An SAL is an MQL that sales has reviewed and accepted. An SQL is sales-confirmed, typically qualified through BANT, CHAMP, or MEDDIC. These conversion benchmarks tell you whether your definitions are calibrated:
| Stage Transition | Benchmark Range |
|---|---|
| Lead to MQL | 20-40% |
| MQL to SAL | 70-90% |
| SAL to SQL | 30-50% |
| SQL to Customer | 20-30% |
If your Lead-to-MQL rate is above 40%, your MQL bar is probably too low. If MQL-to-SAL is below 70%, marketing and sales aren't aligned on what counts. Use these benchmarks as your calibration tool before obsessing over LVR itself.
Five Ways LVR Misleads You
LVR is powerful, but it isn't immune to garbage-in-garbage-out dynamics. In our experience, these are the failure modes that trip up even sophisticated teams.
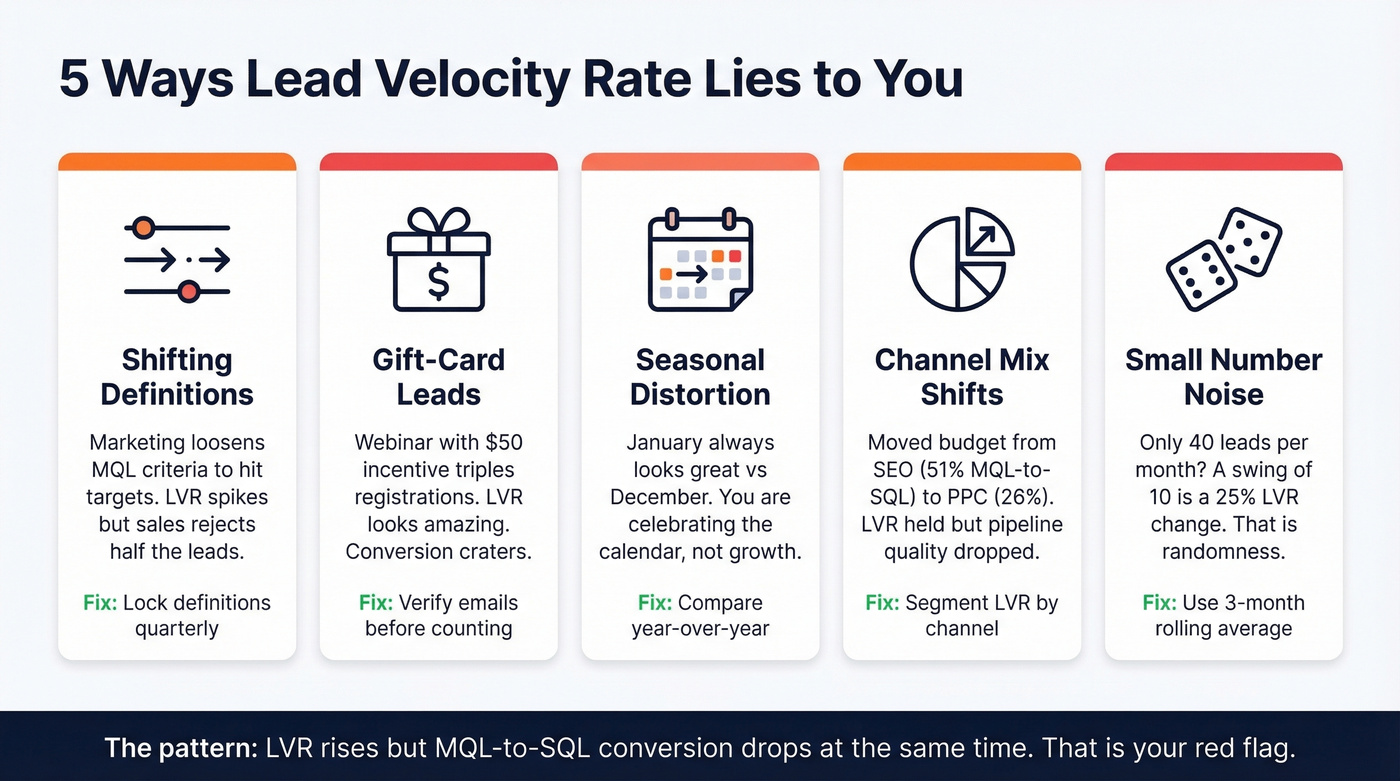
Inconsistent qualification criteria. Marketing loosens MQL definitions to hit targets. LVR spikes. Sales rejects half the leads. Revenue doesn't move. This is the single most common way LVR becomes a vanity metric, and it's frustrating because it's entirely self-inflicted.
Quantity over quality. You ran a webinar with a $50 gift card incentive. Registrations tripled. LVR looks incredible. But when LVR rises and MQL-to-SQL conversion declines simultaneously, you've got a quality problem masquerading as growth. Gift-card leads often submit throwaway emails - run your list through a verification layer before counting anything as qualified.
Seasonal distortion. January always looks great compared to December. Compare year-over-year, not just month-over-month, to separate real growth from calendar effects.
Channel mix shifts. Different channels produce leads at wildly different quality levels:
| Channel | Visitor to Lead | MQL to SQL | Opp to Close |
|---|---|---|---|
| SEO | 2.1% | 51% | 38% |
| PPC | 0.7% | 26% | 35% |
| Webinars | 2.2% | 30% | 33% |
| 1.8% | 46% | 32% | |
| Events | 1.0% | 24% | 40% |
Shift budget from SEO to PPC and your LVR might hold steady while downstream conversion craters. Always segment LVR by channel.
Small-number volatility. Generating 30-50 leads per month? A swing of 10 leads creates a 20-33% LVR change. That's noise. Use a 3-month rolling average to smooth the signal.
How to Improve Lead Velocity
Tighten your ICP targeting first. Broad targeting inflates lead counts but dilutes quality. Narrow your filters to the companies and roles that actually convert, and LVR becomes a meaningful growth signal instead of a volume metric.
Follow-up speed matters more than most teams realize. Leads that sit untouched for 48 hours decay fast - automate routing so sales gets notified within minutes, not days. If you need a repeatable system, keep sales follow-up templates handy so reps don't reinvent the wheel.
What to avoid: chasing lead volume through low-intent channels just to hit an LVR number. A rising LVR built on gift-card webinar leads is worse than a flat LVR built on demo requests. The channel data is clear: SEO converts about 2x better than PPC at the MQL-to-SQL stage (51% vs 26%), and email converts about 2x better than events (46% vs 24%). Invest accordingly.
Your LVR is only as accurate as your lead data. If your CRM is full of unverified emails and disconnected numbers, you're measuring phantom pipeline growth. Prospeo's 98% email accuracy and 7-day data refresh cycle help ensure the leads feeding your LVR calculation are actually reachable, and its 30+ search filters - buyer intent, technographics, headcount growth - let you target the right ICP from the start. If you're evaluating vendors, compare options in our guide to data enrichment services.
Let's be honest about the aggregate number too. It's useful for board decks. The segmented view is useful for decisions. You might discover LVR is growing 30% in mid-market but declining in enterprise - a completely different strategic conversation than "LVR is up 12%."
LVR predicts revenue 90 days out - but only if your qualified leads have accurate contact data. Prospeo refreshes 300M+ profiles every 7 days, so the leads fueling your velocity aren't stale by the time sales calls them. At $0.01 per email, scaling your top-of-funnel costs less than one bad quarter.
Feed your pipeline leads that actually pick up the phone.
The Full LVR Metric Stack
LVR in isolation tells you one thing: are we generating more qualified leads than last month? Necessary but not sufficient. Here's the full stack worth tracking alongside it.
| Metric | Benchmark | Why It Matters |
|---|---|---|
| LVR | 15-25% MoM | Predicts revenue 60-90 days out |
| MQL to SQL | 15-21% | Validates lead definition quality |
| Lead-to-Customer | 2-5% | End-to-end funnel efficiency |
| Median Sales Cycle | 84 days (optimal: 46-75) | Determines LVR-to-revenue lag |
| Win Rate | 20-30% | Sales execution health |
| CAC Payback | 23 mo (top quartile: under 12) | Unit economics check |
| Demo Show-Up Rate | 60-80% | Earliest conversion signal |
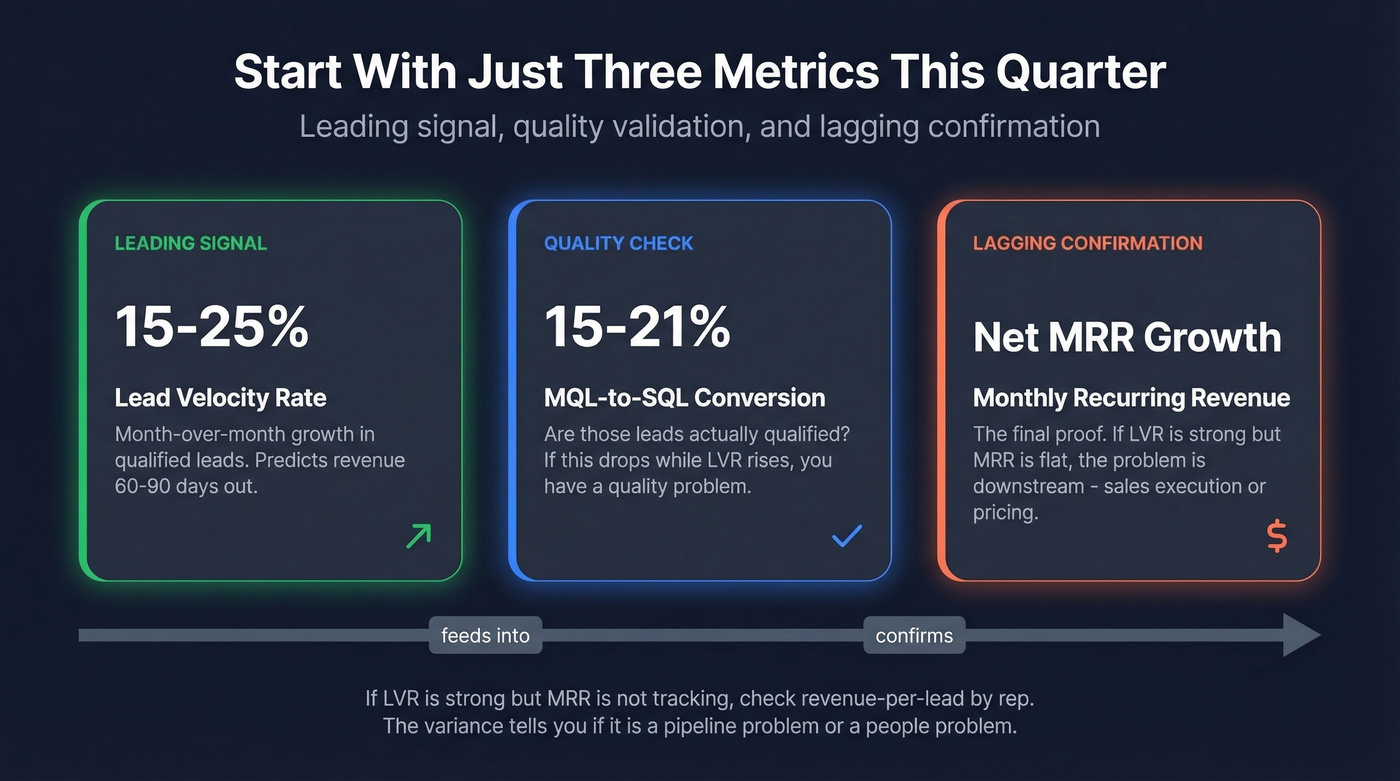
If you're overwhelmed, skip the full stack for now. Track only three this quarter: LVR, MQL-to-SQL conversion, and net MRR growth. Those three give you leading signal, quality validation, and lagging confirmation. Everything else is refinement.
One scenario we've run into more than once: lead velocity is strong but MRR isn't tracking. When that happens, the problem is downstream - sales execution, product-market fit, or pricing. Track revenue-per-lead by rep. The variance will tell you whether it's a pipeline problem or a people problem. If you want a broader view of what to monitor, use a standard set of funnel metrics and align them with your sales operations metrics.
FAQ
Can you track LVR with only 30-50 leads per month?
Yes, but use a 3-month rolling average to smooth volatility. Going from 40 to 48 leads is a 20% swing that might be noise in any single month. Over a quarter, consistent upward movement is a real signal. Don't let small numbers stop you from tracking the trend.
Should LVR be based on MQLs or SQLs?
Use whichever stage has the most consistent definition in your funnel. MQLs work if marketing applies strict ICP and engagement criteria every month. SQLs work if sales acceptance is standardized across reps. Consistency matters far more than which stage you pick.
How do I make sure my LVR reflects real pipeline growth?
Verify your lead data before it enters the CRM. Invalid emails and disconnected phone numbers inflate LVR without adding real pipeline. Clean inputs make LVR predictive instead of noisy - this is where data quality tools earn their keep.
What's the difference between lead velocity rate and pipeline velocity?
Lead velocity rate measures month-over-month growth in qualified leads - a top-of-funnel leading indicator. Pipeline velocity measures how quickly open opportunities convert into revenue, weighted by deal value and win rate. LVR predicts future pipeline; pipeline velocity measures current throughput.