Net Dollar Retention: 2026 Benchmarks, Formula & Guide
Public SaaS companies posted a median NDR above 123% in the first half of 2022. By early 2025, that number had compressed to 108%. The post-ZIRP hangover hit expansion revenue hard, gross retention got worse, and suddenly net dollar retention - the metric every SaaS operator treated as a given - became the one keeping CFOs up at night.
NDR is the single best indicator of whether your existing customer base is growing or shrinking. It captures expansion, contraction, and churn in one number, and it's the metric investors interrogate most aggressively during due diligence. Whether you're prepping for a board meeting, benchmarking against peers, or trying to figure out why your revenue feels stuck despite strong new logo acquisition, this is the metric to understand deeply.
The Short Version
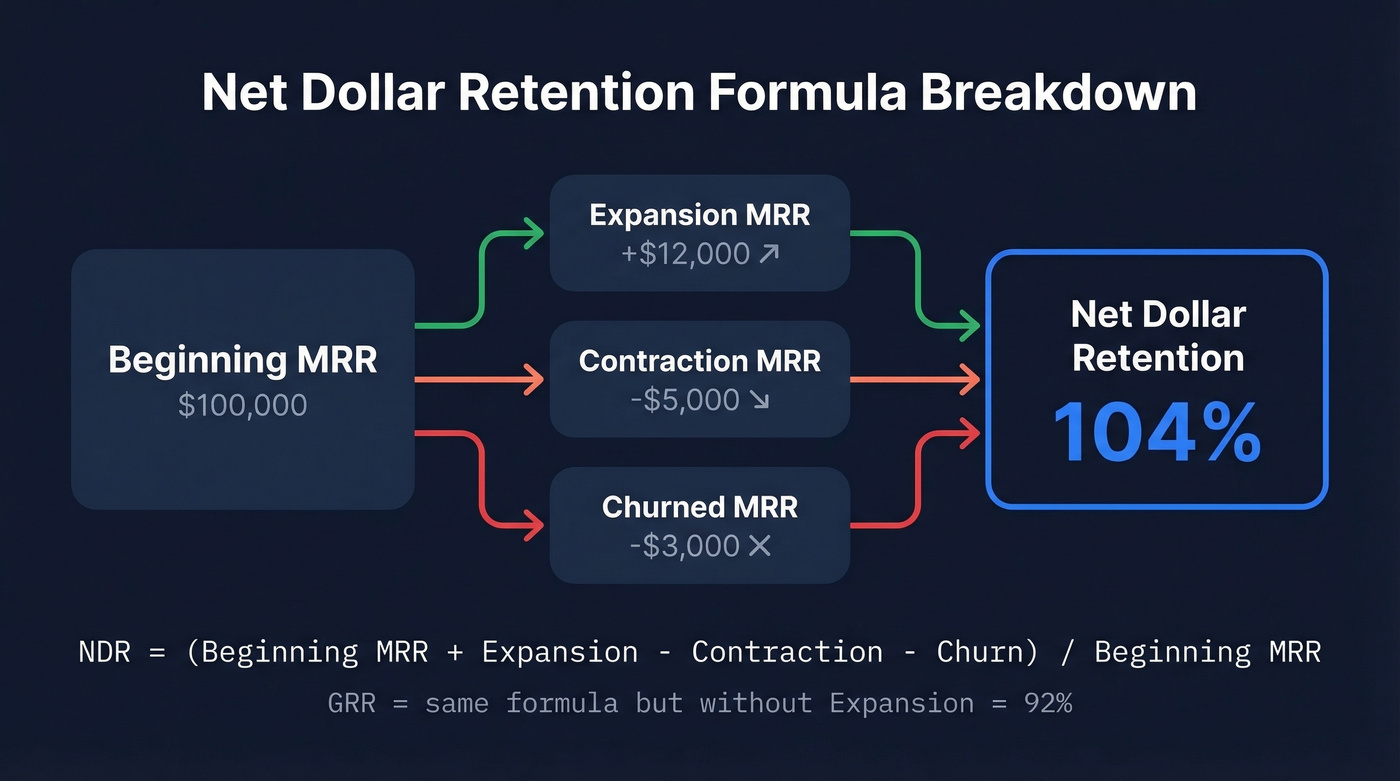
Net dollar retention measures the percentage of recurring revenue retained and expanded from existing customers over a defined period. The formula: (Beginning MRR + Expansion - Churn - Contraction) / Beginning MRR. For private mid-market SaaS with ACV of $25k-$50k, the 2026 median sits around 102%, with top quartile at 111%. Above 100% means your existing customers are worth more this year than last. Below 100% means you've got a leaky bucket.
What Is Net Dollar Retention?
Net dollar retention measures the net change in recurring revenue from your existing customer base over a period - typically 12 months. It accounts for everything that happens after the initial sale: upsells, cross-sells, price increases on the expansion side, downgrades on the contraction side, and customers leaving entirely.
NDR works as a diagnostic because it's intuitive. An NDR of 104% means that even if you acquired zero new customers, your revenue would still grow 4% from the customers you already have. An NDR of 93% means your existing base is eroding, and you're running on a treadmill, needing new logos just to stay flat.
NDR sits alongside two related metrics. Gross revenue retention (GRR) strips out expansion to isolate how much revenue you're keeping before upsells - it can never exceed 100%. Logo retention counts customers rather than dollars, which matters for understanding breadth of churn but misses the revenue impact entirely. A company can lose 15% of logos but maintain 105% NDR if the remaining customers expand enough. All three metrics tell different stories. NDR tells the most complete one.
NDR vs NRR - Are They the Same?
Technically, no. Seth Levine draws the distinction: NDR measures the average percentage change in revenue over a customer's first 12 months, while NRR measures the rolling 12-month retention across all customers regardless of when they signed. In practice, the vast majority of SaaS companies use the terms interchangeably - and most are actually calculating NRR while calling it NDR. This article treats them as synonymous unless otherwise noted.
Levine also makes a point worth internalizing: always separate NDR for your largest accounts from the rest of the base. A handful of enterprise expansions can mask widespread SMB churn, and the aggregate number will lie to you.
The NDR Formula (+ Worked Example)
Core Formula
NDR = (Beginning MRR + Expansion MRR - Contraction MRR - Churned MRR) / Beginning MRR
Each component:
- Beginning MRR: Total monthly recurring revenue from existing customers at the start of the period
- Expansion MRR: Revenue gained from upsells, cross-sells, and price increases
- Contraction MRR: Revenue lost from downgrades - customers paying less without leaving entirely
- Churned MRR: Revenue lost from customers who cancelled entirely
GRR Formula (for Contrast)
GRR = (Beginning MRR - Contraction MRR - Churned MRR) / Beginning MRR
The only difference: GRR excludes expansion. This isolates your ability to retain revenue without relying on upsells to mask churn. GRR can never exceed 100%.
| Component | Included in NDR? | Included in GRR? |
|---|---|---|
| Beginning MRR | Yes | Yes |
| Expansion | Yes | No |
| Contraction | Yes | Yes |
| Churn | Yes | Yes |
Worked Example
Say your company starts January with $100,000 in MRR from existing customers. Over the next 12 months, those customers generate $12,000 in expansion revenue, $5,000 in contraction, and $3,000 in churn.
NDR = ($100,000 + $12,000 - $5,000 - $3,000) / $100,000 = 104%
GRR = ($100,000 - $5,000 - $3,000) / $100,000 = 92%
That 12-point gap between NDR and GRR is worth paying attention to. It means expansion is doing heavy lifting to compensate for an 8% revenue leak. More on why that gap matters below.
How to Calculate NDR Correctly
Getting the formula right is easy. Getting the inputs right is where teams go wrong - and where your net dollar retention rate can swing by several percentage points depending on methodology choices. We've seen teams miscalculate NDR by 5+ points just from including new customer revenue in the denominator.
Five Mistakes That Skew Results
1. Including new customer revenue. This is the most common error. New logos acquired during the measurement period don't belong in the numerator or denominator. NDR measures what happened to customers who existed at the start of the period. Mixing in new revenue defeats the entire purpose.
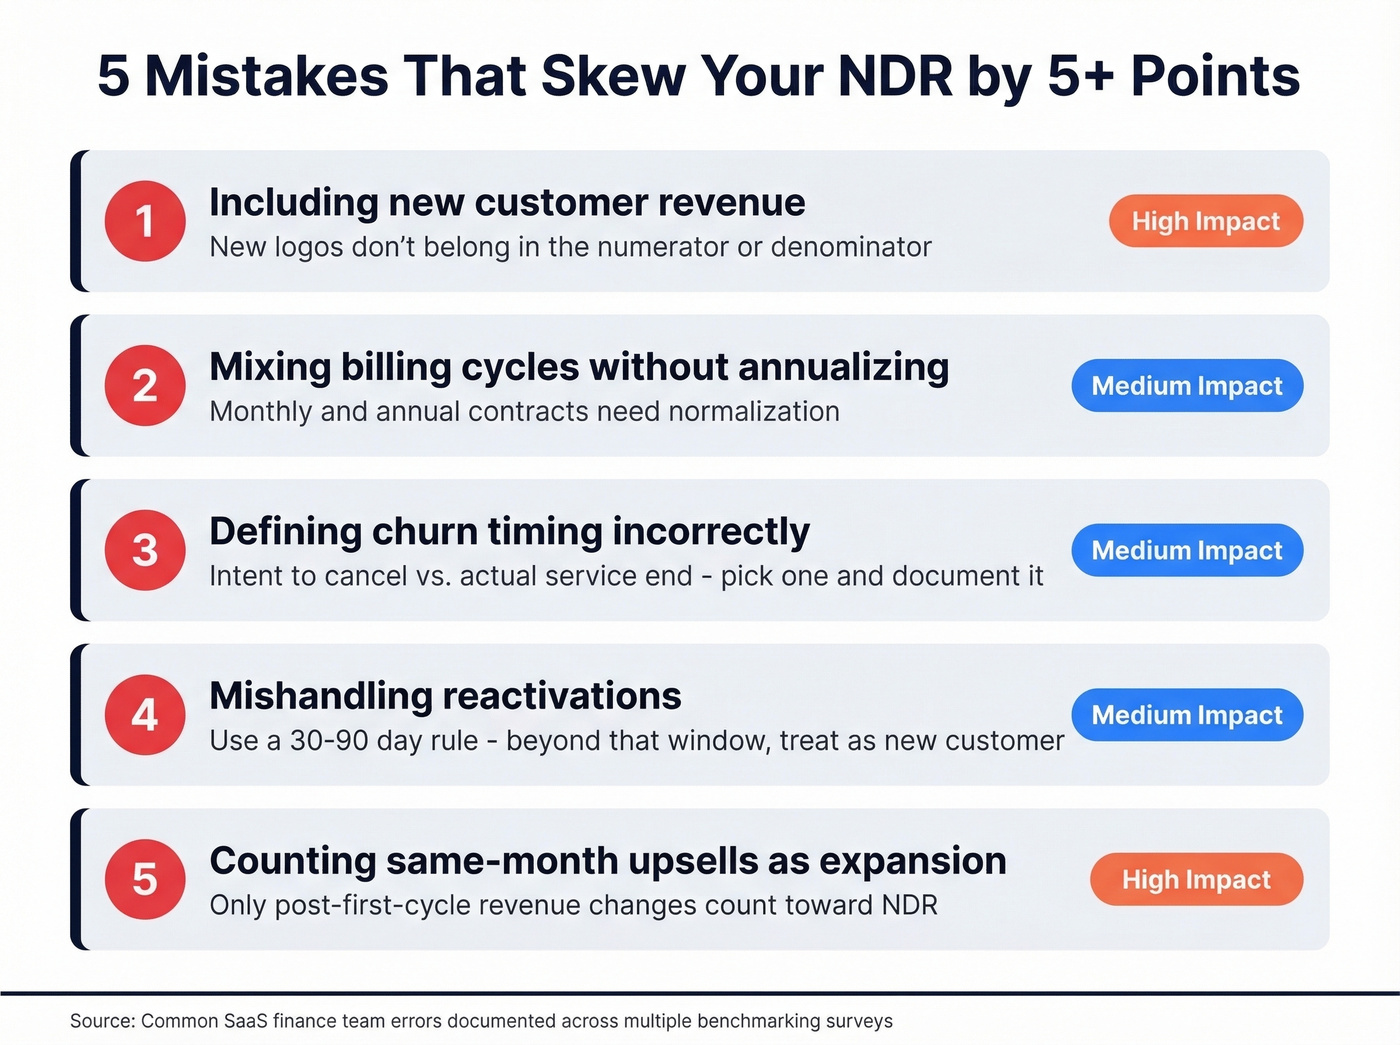
2. Mixing billing cycles without annualizing. If you have monthly and annual contracts in the same cohort, you need to normalize to the same cadence. A monthly customer who churns in month 3 looks very different from an annual customer who doesn't renew, but both need consistent treatment.
3. Defining churn timing incorrectly. Does churn happen when the customer signals intent to cancel, or when service actually ends? The difference can shift churn into a different measurement period. Pick one definition and document it.
4. Mishandling reactivations. This is the most heated debate in SaaS finance teams: does a customer who churns and returns 60 days later count as retention or new acquisition? Churnkey recommends a 30-90 day rule. If they return within that window, treat it as a retention save. Beyond that, it's a new customer.
5. Counting same-month upsells as expansion. If a customer signs a $10k contract and upgrades to $15k in the same month, that $5k is part of the initial sale - not expansion. Only post-first-cycle revenue changes count toward NDR.
Cohort vs. Aggregate - Why They Disagree
The same underlying data can produce materially different NDR numbers depending on how you aggregate it. OPEXEngine demonstrated that three legitimate summarization methods applied to the same dataset yielded results of 0.5%, -1.4%, and -2.6%. That's Simpson's paradox at work - when you average across cohorts of different sizes, the weighting method changes the answer.
There's no industry standard here. Zendesk measures annual change in cohort MRR. Twilio uses quarterly recurring revenue cohorts. Okta and Box look at 12-month bookings changes per cohort. All are defensible. None are directly comparable.
The practical recommendation: pick a method, document it clearly, and stick with it. Benchmark only against companies that measure the same way. Always run both cohorted and uncohorted views - cohorted retention catches segment-level problems that aggregate NDR hides entirely. And segment by your largest accounts vs. the rest, because a handful of enterprise expansions can bury widespread SMB churn that the aggregate number never surfaces.
Different surveys also produce different medians depending on sample composition - SaaS Capital reports 102%, Benchmarkit reports 101%, and other surveys land around 105%. Don't obsess over the exact benchmark number. Focus on whether you're trending up or down relative to a consistent measurement.
Usage-Based Pricing and Q4 Distortion
If you're running a consumption-based model like Snowflake or Twilio-style pricing, a single quiet month can look like contraction even when the customer is healthy. Use a trailing twelve-month average for usage revenue rather than point-in-time snapshots.
Q4 introduces its own distortion. Renewals cluster heavily in Q4 for many SaaS companies, which means churn also concentrates there. Blossom Street Ventures documented a sharp Q3-to-Q4 2022 drop (123% to 115%) driven partly by this renewal clustering effect. If your NDR looks unusually bad in Q4, check whether it's a real signal or a calendar artifact before panicking.
2026 NDR Benchmarks by Segment
This is the section you'll bookmark.
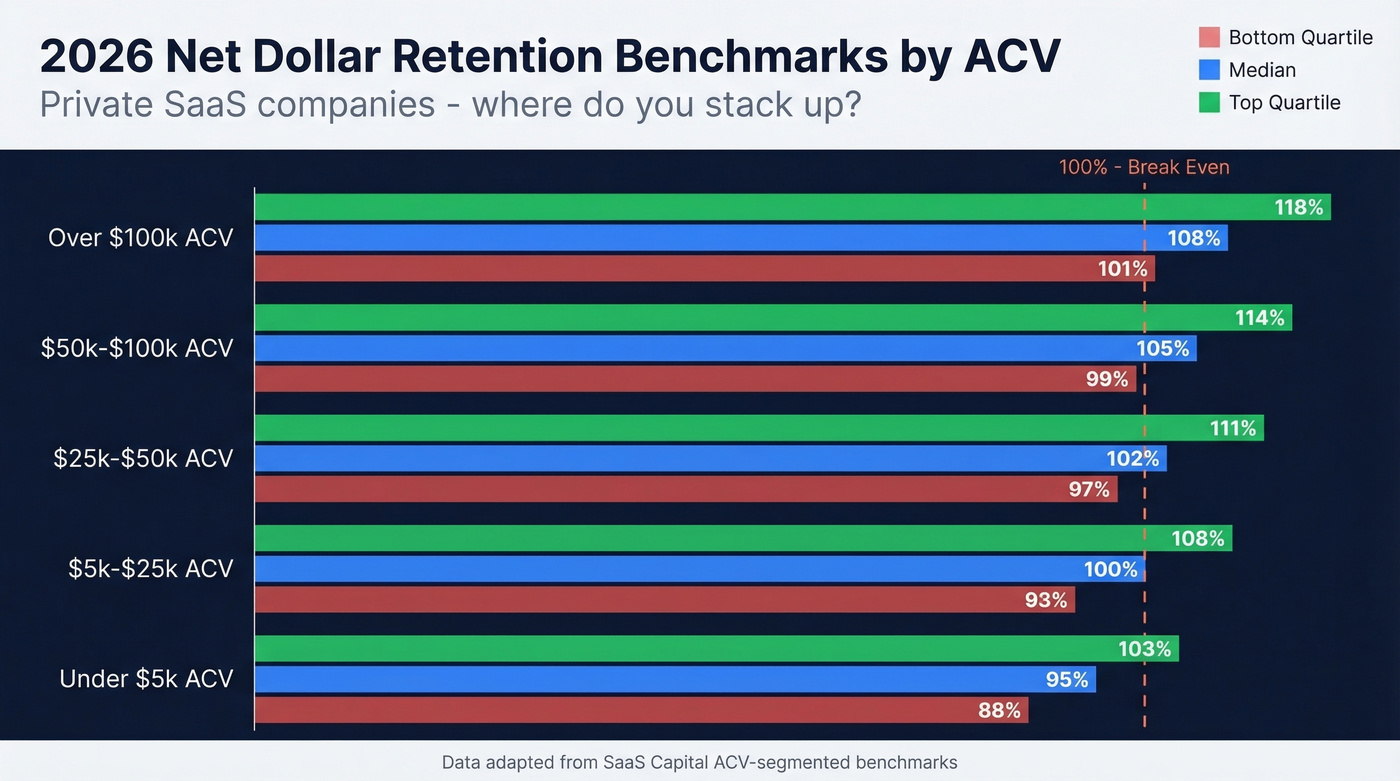
Private SaaS by ACV
SaaS Capital's ACV-segmented data remains the best benchmark for private companies. Higher ACV correlates with higher retention - larger customers expand more and churn less.
| ACV Band | Median NRR | Top Quartile | Bottom Quartile |
|---|---|---|---|
| < $5k | ~95% | ~103% | ~88% |
| $5k-$25k | ~100% | ~108% | ~93% |
| $25k-$50k | 102% | 111% | 97% |
| $50k-$100k | ~105% | ~114% | ~99% |
| > $100k | ~108% | ~118% | ~101% |
If you're mid-market with $30k ACV and your NDR is sitting at 98%, you're in the bottom quartile. That's not a "fine, we'll fix it later" situation - it means your existing customer base is shrinking in revenue terms, and every new logo you close is partially backfilling losses.
Private SaaS Overall
Benchmarkit's 2025 dataset puts overall NRR at 101% across their survey base. More concerning: GRR has declined from 90% to 88% over the past three years, meaning churn is getting harder to control even as companies invest more in customer success.
The silver lining: expansion ARR now represents 40% of total new ARR at the median, up 5 percentage points year-over-year. For companies above $50M in ARR, expansion accounts for more than half of all new revenue. At scale, your existing customers become your primary growth engine, and NDR is the scoreboard.
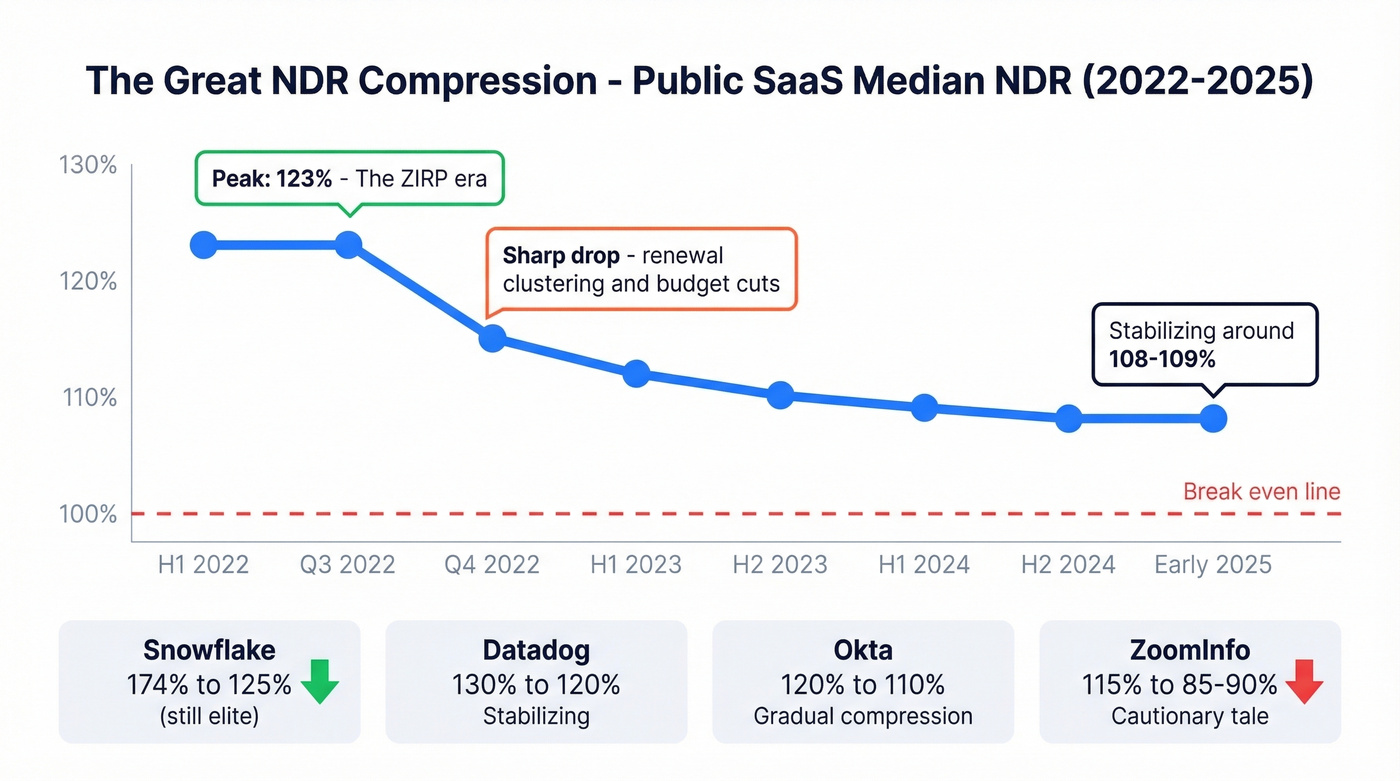
Public SaaS Trend (2022-2026)
The macro story is compression. Median NDR across public SaaS companies tracked by Blossom Street Ventures peaked above 123% in mid-2022, dropped sharply to ~115% by Q4 2022, and has settled around 108-109% through early 2025. The post-ZIRP environment squeezed expansion budgets, lengthened sales cycles, and made customers more aggressive about consolidating vendors.
Individual company trajectories tell a more nuanced story:
| Company | 2022 NDR | 2024-2025 NDR | Trend |
|---|---|---|---|
| Snowflake | 174% | ~125% | Down, still elite |
| Datadog | 130% | ~120% | Stabilizing |
| ZoomInfo | ~115% | ~85-90% | Sharp decline |
| Okta | ~120% | ~110% | Gradual compression |
ZoomInfo's trajectory is the cautionary tale. Going from ~115% to the mid-80s means existing customers are actively shrinking - contraction and churn are outpacing whatever expansion the sales team generates. Snowflake, by contrast, dropped from extraordinary to merely excellent. Very different story.
IPO-Stage Benchmarks
If you're on the IPO track, Crunchbase's analysis of 36 public SaaS companies sets the bar: median NDR of 106.5% at IPO, with the top 5 averaging 133% pre-IPO. The top 10 averaged 125.7%. Current median for those same companies has drifted to 104%.
Let's be honest: if you're targeting an IPO and your NDR is below 120%, investors will ask hard questions about your expansion motion, and you'd better have good answers.
NDR above 100% requires expansion revenue - and expansion starts with reaching decision-makers inside your existing accounts. Prospeo's 300M+ profiles with 30+ filters (buyer intent, headcount growth, department size) help you identify upsell contacts before competitors do.
Stop masking churn with new logos. Expand the accounts you already have.
What Drives Top-Performing SaaS NDR
NDR isn't random, and it's not primarily a function of company size. The two biggest structural drivers are GTM motion and pricing model.
PLG companies tend to post higher NDR than pure sales-led organizations. Product-led growth creates natural expansion paths - users invite teammates, usage grows organically, and tier upgrades happen with less friction. Sales-led motions depend more heavily on CSMs and account managers to drive expansion conversations, which introduces human bottlenecks and inconsistency across the book of business.
Usage-based pricing adds roughly 10 percentage points to NDR compared to pure subscription models. That data point comes from a 2021 State of the Cloud analysis, but the structural logic holds: when revenue scales with consumption, healthy customers automatically expand without anyone sending an upsell email. Companies with usage-based pricing also trade at roughly 50% higher revenue multiples - the market rewards the alignment between customer value and revenue growth.
ACV matters too, and the relationship is straightforward. Higher-ACV customers expand more aggressively because they have bigger budgets and more use cases to unlock. They also churn less frequently because switching costs are higher and procurement cycles are longer.
Here's the thing: if your average deal size is under $10k, obsessing over NDR is the wrong priority. Your GRR is almost certainly the bigger problem. Low-ACV businesses rarely generate enough per-account expansion to offset the naturally higher churn rates at that price point. Fix gross retention first. NDR optimization is a game for companies with enough account value to actually expand into.
Why NDR Matters Beyond the Dashboard
NDR isn't just an operating metric - it's a valuation lever. Each 1% improvement in NRR can increase company valuation by 12-14% over five years, compounding through higher revenue growth and lower customer acquisition cost pressure. In a market where private SaaS multiples run 5-10x ARR, that compounding effect is enormous.
Investors know this. During due diligence, expect them to request three years of NDR data - cohorted, not just aggregate. They'll look for trends, segment-level variation, and the gap between NDR and GRR. A company with 110% NDR and 82% GRR tells a very different story than one with 110% NDR and 95% GRR. The first is masking serious churn with expansion. The second has a genuinely healthy customer base.
For board communication, NDR connects customer success to financial outcomes. It answers the question every board member is really asking: "Are our existing customers becoming more valuable over time, or less?" In our experience, the GRR-to-NRR gap tells you more than either metric alone - and it's the first thing we look at when diagnosing a revenue growth stall.
If your NDR is below 100%, no amount of new logo acquisition fixes that. You're filling a leaky bucket.
How to Improve Net Dollar Retention
Improving NDR isn't a single initiative - it's a system. Here are the highest-leverage tactics, ranked roughly by impact.
1. Track champion changes religiously. The VP of Engineering who championed your deal 14 months ago? There's a decent chance they've moved on. When champions leave, accounts go dark - and dark accounts churn. Cobalt implemented systematic champion tracking and generated $1.7M in new business pipeline plus 8% new logo revenue growth from tracking job changes alone. We've seen similar patterns across dozens of accounts we work with: the moment a champion departs and nobody notices, the renewal conversation goes from routine to rescue mission.
2. Run cross-functional deal review office hours. Get CS, Sales, and Product in a room weekly to review at-risk accounts. CS knows which accounts are disengaged. Sales knows which ones have budget. Product knows which feature gaps are driving contraction. None of them have the full picture alone. The consensus on r/SaaS and r/sales is that most churn surprises aren't actually surprises - someone on the team saw the warning signs, but the information never reached the person who could act on it.
3. Instrument product-led expansion signals. Track feature adoption, seat utilization, and usage patterns that predict expansion readiness. A customer using 90% of their seat allocation is an expansion signal. A customer whose usage dropped 40% last quarter is a churn signal. Both require action - but different action.
4. Build a structured expansion cadence. Don't leave expansion to ad hoc conversations. Set a 13-week revenue cadence: weeks 1-4 for account health scoring, weeks 5-8 for expansion opportunity identification, weeks 9-12 for outreach and negotiation, week 13 for pipeline review. Rhythm beats heroics every time.
5. Keep expansion contact data current. This is the tactic most teams neglect, and it's frustrating how much revenue it silently kills. CRM data decays 30-40% annually - people change roles, leave companies, get promoted. The champion you sold to last year may have left, and nobody on your team noticed. Your expansion rep sends three emails to a dead inbox, marks the account as "unresponsive," and moves on. That's not an unresponsive account. That's a data problem.
Tools like Prospeo solve this with a 7-day data refresh cycle and 98% email accuracy across 300M+ professional profiles, so your expansion team always has current verified emails and direct dials instead of bouncing off stale records. At roughly $0.01 per verified email, the ROI is obvious when a single expansion deal is worth $20k+.
The thread connecting all five: expansion revenue depends on reaching the right people at the right time with the right context. Every broken link in that chain - a departed champion, a stale email, a missed usage signal - is lost NDR.
The gap between your GRR and NDR tells you how much expansion is compensating for churn. Prospeo's intent data tracks 15,000 topics so your CS and AM teams spot in-market signals inside existing accounts - at $0.01 per verified email, not $1.
Identify upsell-ready accounts with real-time buyer intent signals.
NDR vs GRR - Which to Optimize
The honest answer is both, but the emphasis depends on your stage and strategy.
Optimize for NDR when you're focused on growth efficiency, building tiered packaging, or trying to prove to investors that your customer base compounds. An NDR focus drives segmentation, tiered experiences, and pricing innovation. It rewards teams that identify and capture expansion opportunities.
Optimize for GRR when you're seeing dangerous churn rates, your product experience is inconsistent across segments, or you need to shift retention accountability upstream to Sales and Marketing because you're acquiring the wrong customers. Skip the NDR obsession entirely if your GRR is below 85% - you've got a structural retention problem that expansion can't outrun, and pouring energy into upselling frustrated customers will only accelerate their departure.
The contrarian take: the GRR-to-NRR gap is the real diagnostic metric. A narrow gap - say, NDR 108% and GRR 95% - means you're retaining well and expanding on top of a healthy base. A wide gap, like NDR 112% and GRR 80%, means you're papering over serious churn with aggressive upselling. That works until it doesn't. Eventually you run out of expansion headroom in accounts that are already frustrated, and the whole thing collapses in a single bad quarter.
ChurnZero's framework puts it well: GRR tends to decline as companies grow because the customer base diversifies and more churn opportunities emerge. That makes NDR increasingly important at scale - but only if GRR stays healthy enough to build on.
FAQ
What's a good net dollar retention rate?
For private SaaS at mid-market ACV ($25k-$50k), the median is 102% and top quartile is 111%. Above 110% is strong; below 100% means your existing base is shrinking in revenue terms. Enterprise companies with $100k+ ACV should target 108%+ at the median, while SMB-focused products will find 95-100% acceptable given naturally higher churn rates.
What's the difference between NDR and NRR?
NDR technically measures first-12-month cohort revenue change, while NRR measures rolling 12-month retention across all customers. In practice, most SaaS companies use the terms interchangeably, and the majority calculate NRR while labeling it NDR. Unless you're in an investor presentation where precision matters, the distinction rarely changes anything operationally.
Can NDR exceed 100%?
Yes - NDR above 100% means expansion revenue from existing customers exceeds the revenue lost to churn and contraction. The best public SaaS companies sustain 120%+. Snowflake hit 174% at its peak. Even after the post-2022 compression, elite companies maintain 115-130%.
How often should I measure NDR?
Monthly for internal tracking, quarterly for board reporting. Use cohorted views to catch segment-level problems that aggregate numbers mask. Align your measurement window to your dominant billing cycle - annual contracts warrant annual cohorts, while usage-based models benefit from trailing-twelve-month smoothing.
How does contact data quality affect expansion revenue?
Expansion depends on reaching new stakeholders in existing accounts - the new VP who just joined, the team lead who replaced your original champion. CRM data decays 30-40% annually, stalling outreach and turning warm accounts cold. Keeping that data fresh with tools that verify contacts on a weekly cycle means your expansion team actually reaches the right person instead of bouncing off dead inboxes.