Customer Acquisition Cost (CAC): How to Calculate, Benchmark, and Reduce It
Your board deck says CAC is $200. Your CFO runs the same numbers and gets $600. Neither of them is wrong - they're just counting different things, over different time windows, with different definitions of "customer." This is the core problem with Customer acquisition cost: everyone calculates it, almost nobody calculates it correctly.
Your CAC is probably wrong. Most teams undercount costs, ignore the time lag between spend and conversion, and use blended numbers when they need channel-level data. What follows is the correct set of formulas, 2026 benchmarks across 29 industries, and the five mistakes to fix before you optimize anything.
What Is Customer Acquisition Cost?
Customer acquisition cost is the total cost of converting a stranger into a paying customer. The basic formula is deceptively simple:
CAC = Total Sales & Marketing Costs / New Customers Acquired
One fraction. And yet it's the metric investors use to judge whether your growth engine is efficient or burning cash. A low CAC relative to LTV means your growth engine is self-funding; a high one means you're subsidizing every deal with investor capital, and eventually, that stops.
The problem isn't the formula. It's what people put into it.
The CAC Formula (And What to Include)
Most teams treat CAC as "ad spend divided by signups." That's not CAC - that's a media efficiency metric. Real customer acquisition cost includes every dollar your organization spends to win a customer, whether or not it shows up in your ad platform dashboard.
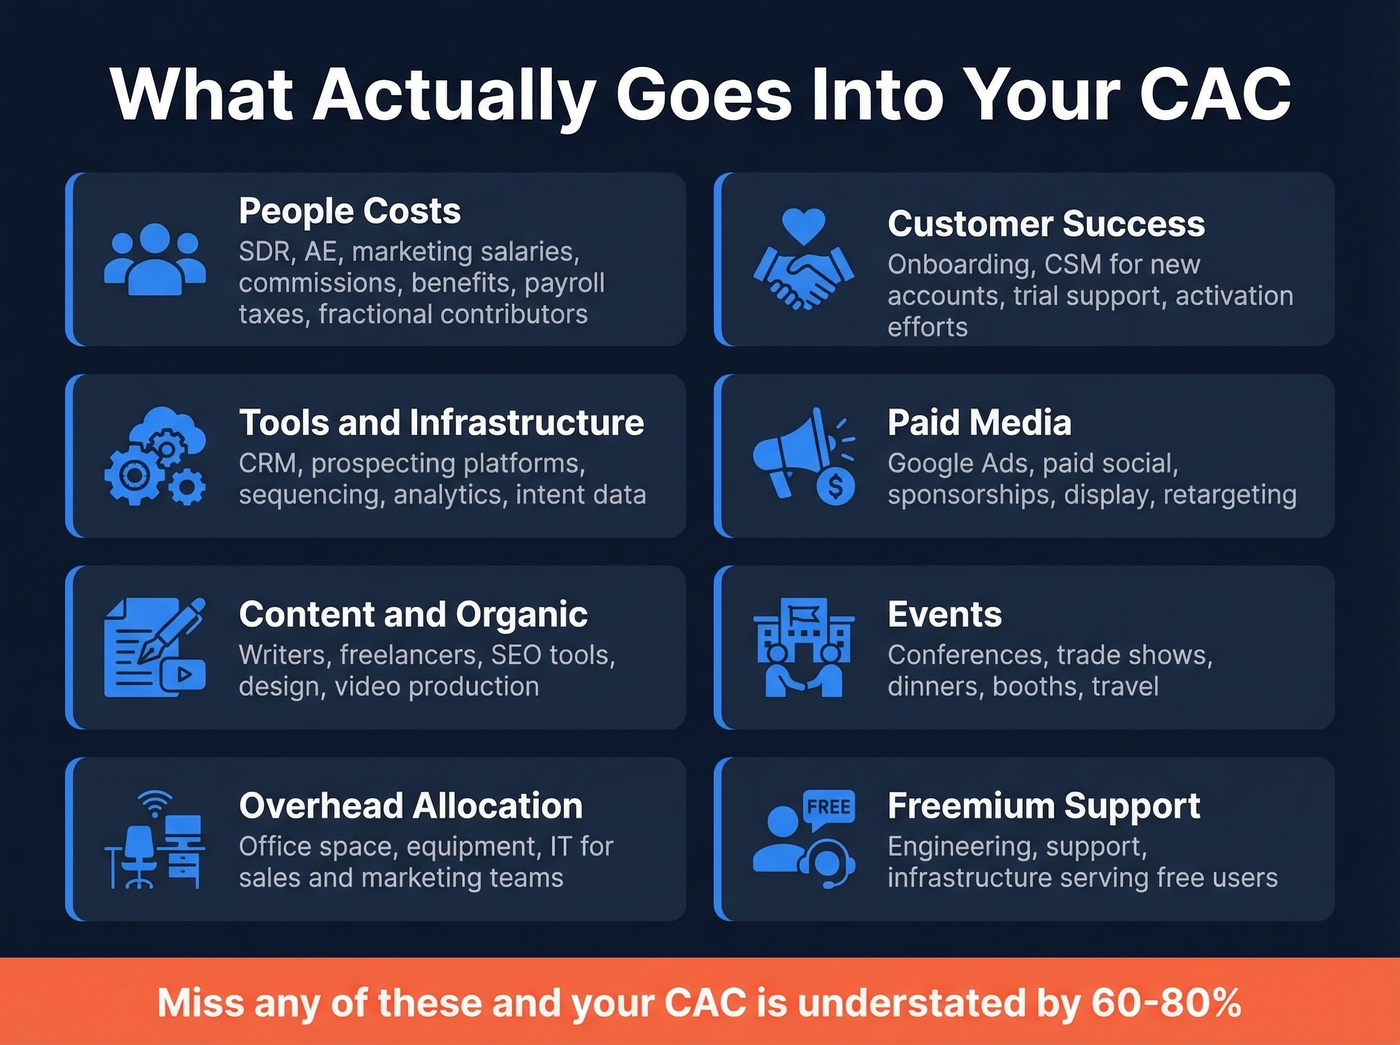
Here's the full cost checklist. If you're not including all of these, your number is understated:
- People costs: SDR, AE, and marketing salaries, commissions, bonuses, benefits, and payroll taxes. Include fractional contributors - if your CEO spends 30% of their time on sales, 30% of their comp goes into CAC.
- Customer success (acquisition-related): Onboarding, CSM salaries for new accounts, trial support, and any CS effort aimed at converting prospects or activating new users.
- Tools and infrastructure: CRM licenses, prospecting platforms, sequencing tools, analytics software, call recording, intent data subscriptions.
- Paid media: Google Ads, paid social, sponsorships, display, retargeting.
- Content and organic costs: Writer salaries or freelance fees, SEO tools, design, video production.
- Events: Conferences, trade shows, dinners, booth costs, travel.
- Overhead allocation: Office space, equipment, and IT for sales and marketing teams.
- Freemium support costs: If you run a free tier, the engineering, support, and infrastructure costs of serving free users are acquisition costs - they exist to convert free users into paying ones.
Miss any of these line items and you're lying to yourself about unit economics.
A Worked Example
Say your B2B SaaS company spends the following in Q1:
- Salaries (S&M team): $120,000
- Tools (CRM, prospecting, sequencing): $15,000
- Paid ads: $40,000
- Content production: $10,000
- Events: $5,000
- Overhead allocation: $10,000
Total: $200,000. You close 250 new customers in Q1. Your fully-loaded CAC is $200,000 / 250 = $800 per customer. If you'd only counted ad spend, you'd have reported $160 - off by 5x. That's the gap between a vanity metric and a real one.
Three Types of CAC You Should Track
Blended CAC is the number most teams report. It's also the least useful one.
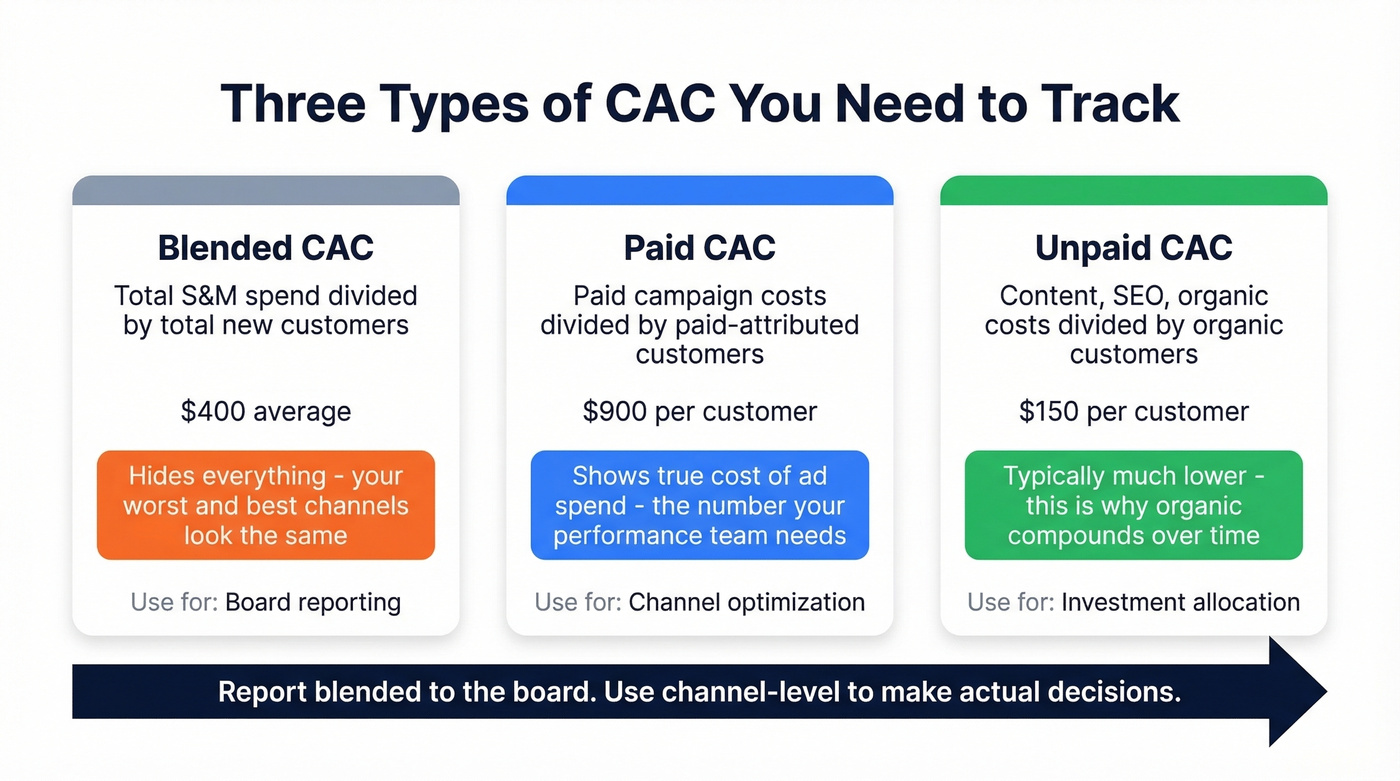
Blended CAC is total sales and marketing spend divided by total new customers. It tells you the average cost across all channels and motions. The problem? It hides everything. A blended figure of $400 might mean your organic channel acquires at $150 and your paid channel acquires at $900 - two very different stories, and blended numbers tell you neither.
Paid CAC isolates paid campaign expenses divided by customers acquired through those campaigns. This is what your performance marketing team should obsess over. It answers one question: is our ad spend generating customers at an acceptable cost?
Unpaid CAC captures everything else - content, SEO, organic social, word-of-mouth - divided by customers who came through non-paid channels. It's typically much lower than paid CAC, which is exactly why organic investment compounds so well over time.
Here's the thing: if you're only tracking blended numbers, you're flying blind. Track all three, report blended to the board, and use channel-level figures to make actual decisions.
CAC vs CPA
These get conflated constantly, and the confusion leads to real budget misallocation.
CAC is the cost to acquire a paying customer. CPA (cost per acquisition) is the cost to acquire any conversion event - a lead, a trial signup, an activated free user, a demo request. The distinction matters because a $50 CPA on trial signups sounds great until you realize only a small fraction convert to paid. If 8% convert, your actual CAC is $625.
When teams conflate CPA and CAC, they overspend on top-of-funnel channels that generate cheap conversions but expensive customers. Before you calculate anything, define what "customer" means in your model. Is it a paying user? A contracted account? An activated subscriber? Get this wrong and every downstream metric is garbage.
Your tools line item feeds directly into CAC. Prospeo replaces expensive prospecting platforms at $0.01/email - 90% cheaper than ZoomInfo - with 98% verified accuracy. That means fewer bounces, less wasted spend, and a denominator that actually grows.
Stop inflating your CAC with overpriced data. Start free today.
Five CAC Calculation Mistakes
1. Only Counting Ad Spend
The most common mistake and the easiest to fix. If your "CAC" only includes Google and Meta spend, you're ignoring 60-80% of your actual acquisition costs. Your SDR team's $400K annual cost doesn't disappear just because it doesn't show up in Google Ads.
2. Ignoring the Time Lag
You spend money in January. The lead enters your pipeline in February. They close in March. If you divide January's spend by January's new customers, you're matching costs to the wrong cohort.
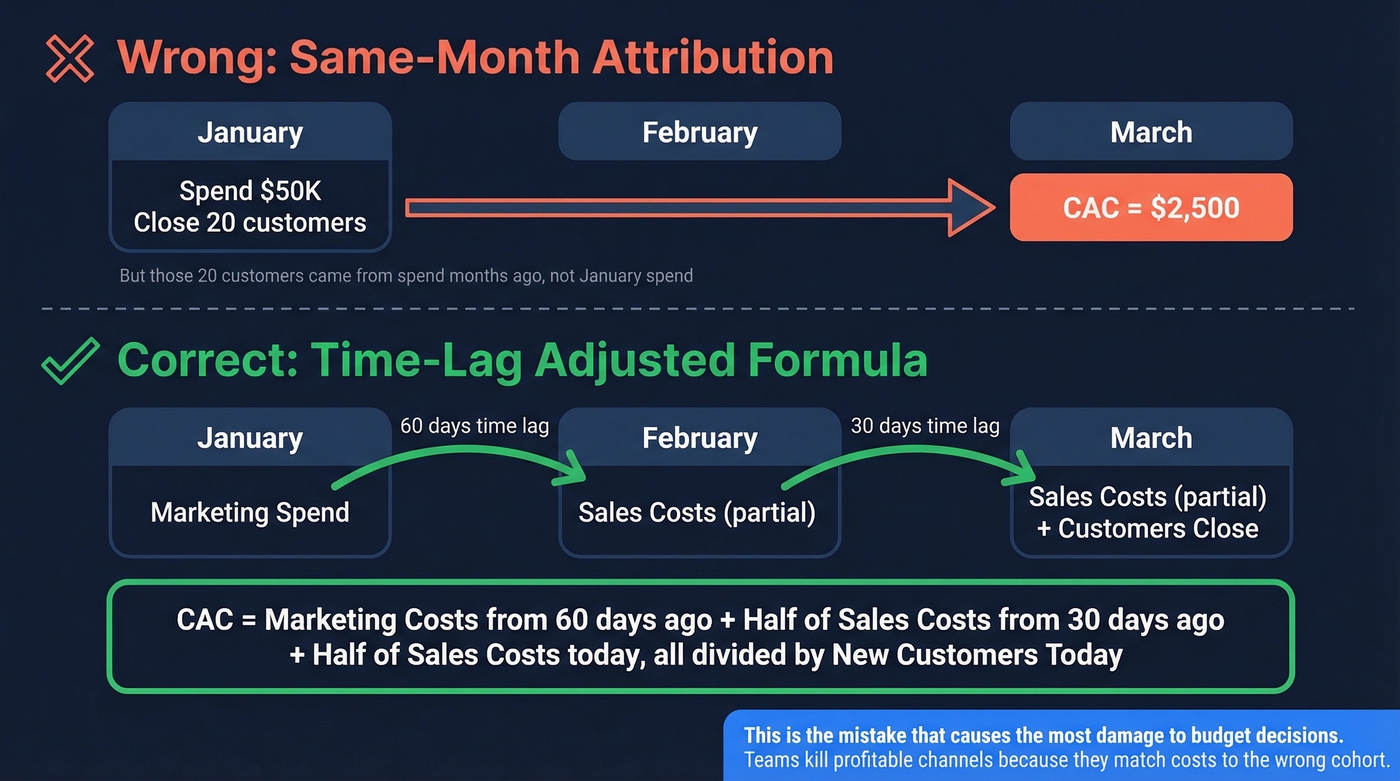
In our experience, this is the mistake that causes the most damage to budget decisions. Teams kill channels that are actually profitable once the pipeline matures. One commonly used time-lag formula looks like this:
CAC = (Marketing Expenses (n-60) + 1/2 Sales Costs (n-30) + 1/2 Sales Costs (n)) / New Customers (n)
Your specific lag will vary. But this is dramatically better than same-month attribution for any sales cycle running 60+ days.
3. Counting Existing Customers
Your denominator should only include new customers. If you're dividing by total customers including renewals, expansions, and reactivations, you're artificially deflating CAC. Expansion revenue has its own cost structure - don't let it subsidize your acquisition math.
4. Missing Freemium Support Costs
If you run a free tier, every dollar spent supporting free users is an acquisition cost. Server infrastructure, support tickets, onboarding emails, product development for the free experience - all of it exists to convert free users into paying ones. Freemium upgrades often take months, which means these costs accumulate before a single dollar of revenue appears. Excluding them makes your numbers look 20-40% lower than reality.
5. Using Blended When You Need Channel-Level
Your blended CAC is $350. Great. But your paid search CAC is $1,100 and your content-driven CAC is $180. Blended masks channel performance and prevents you from reallocating budget to what's actually working.
Look, most teams don't have a CAC problem. They have a channel mix problem. Their blended number looks fine while one channel bleeds money and another prints it. You'll never see this in a blended report.
2026 CAC Benchmarks by Industry
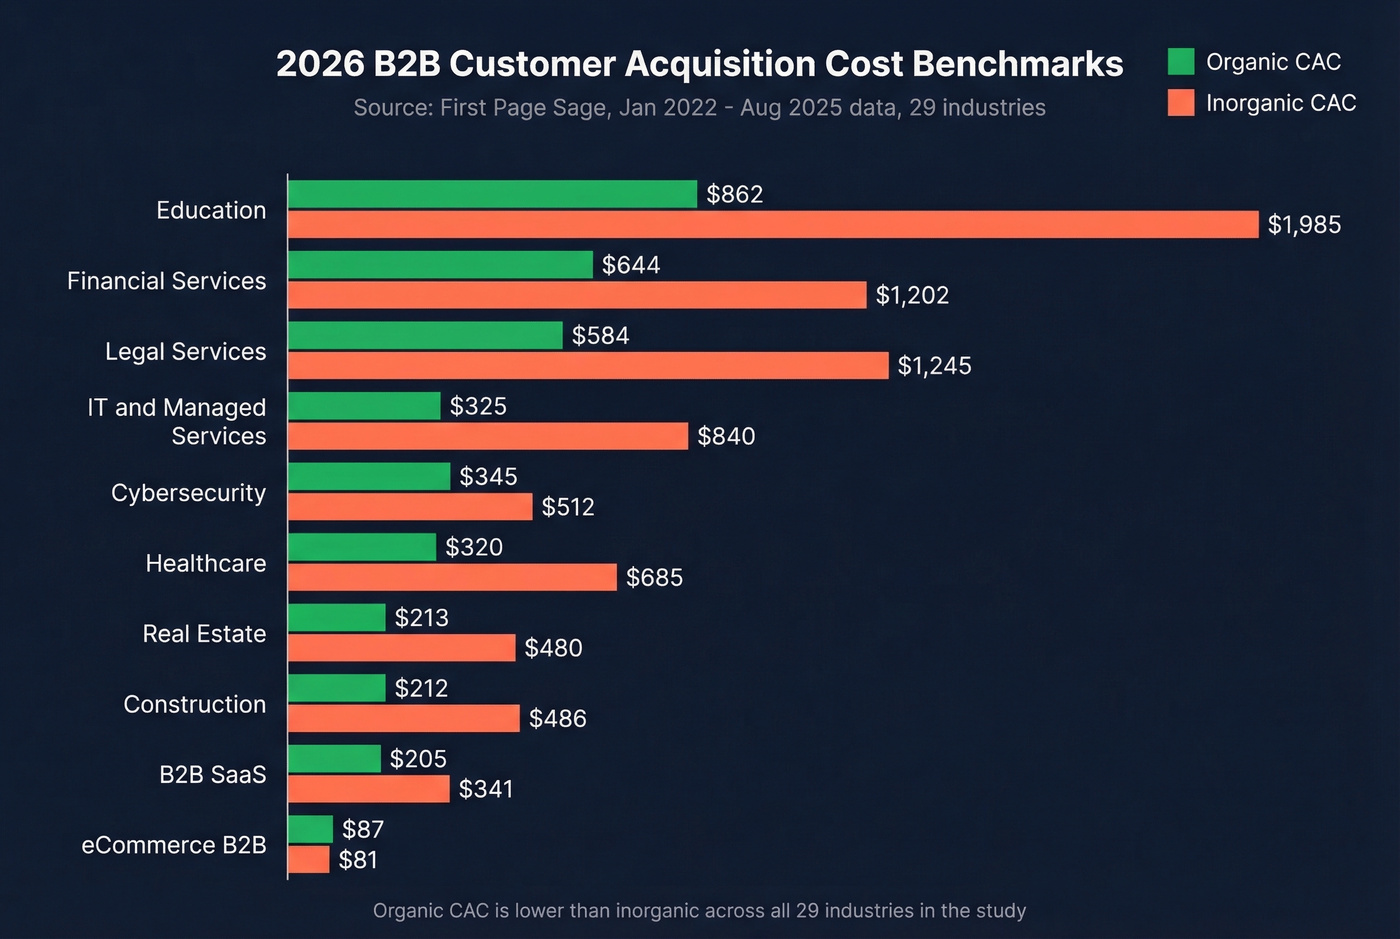
First Page Sage published updated benchmarks in January 2026, covering 29 B2B industries based on client data from January 2022 through August 2025. Their methodology weights the combined average 75% organic / 25% inorganic, with organic skewed toward SEO and inorganic toward PPC/SEM.
| Industry | Organic CAC | Inorganic CAC | Combined CAC |
|---|---|---|---|
| B2B SaaS | $205 | $341 | $239 |
| eCommerce (B2B) | $87 | $81 | $86 |
| Education | $862 | $1,985 | $1,143 |
| Legal Services | $584 | $1,245 | $749 |
| Financial Services | $644 | $1,202 | $784 |
| IT & Managed Services | $325 | $840 | $454 |
| Cybersecurity | $345 | $512 | $387 |
| Construction | $212 | $486 | $281 |
| Healthcare | $320 | $685 | $411 |
| Real Estate | $213 | $480 | $280 |
Across all 29 industries in the report, organic CAC is lower than inorganic. Education shows one of the most dramatic gaps - organic acquisition costs less than half of paid.
For additional context, Baremetrics reports that SaaS companies spend an average of $273 per customer, while enterprise-level acquisition costs regularly exceed $5,000. We've seen teams panic over benchmark comparisons without accounting for methodology differences - First Page Sage's "organic" and "inorganic" categories exclude email marketing, in-person events, direct mail, outdoor advertising, and similar channels due to insufficient data. Use them as directional benchmarks, not gospel.
Acquisition costs have risen materially over the past five years across many categories. If your numbers are higher than these tables, you're not alone - but you should still be working to bring them down.
LTV:CAC Ratio and Payback Period
LTV:CAC Ratio
CAC in isolation is meaningless. A $500 acquisition cost is fantastic if your customer lifetime value is $5,000. It's catastrophic if LTV is $400.
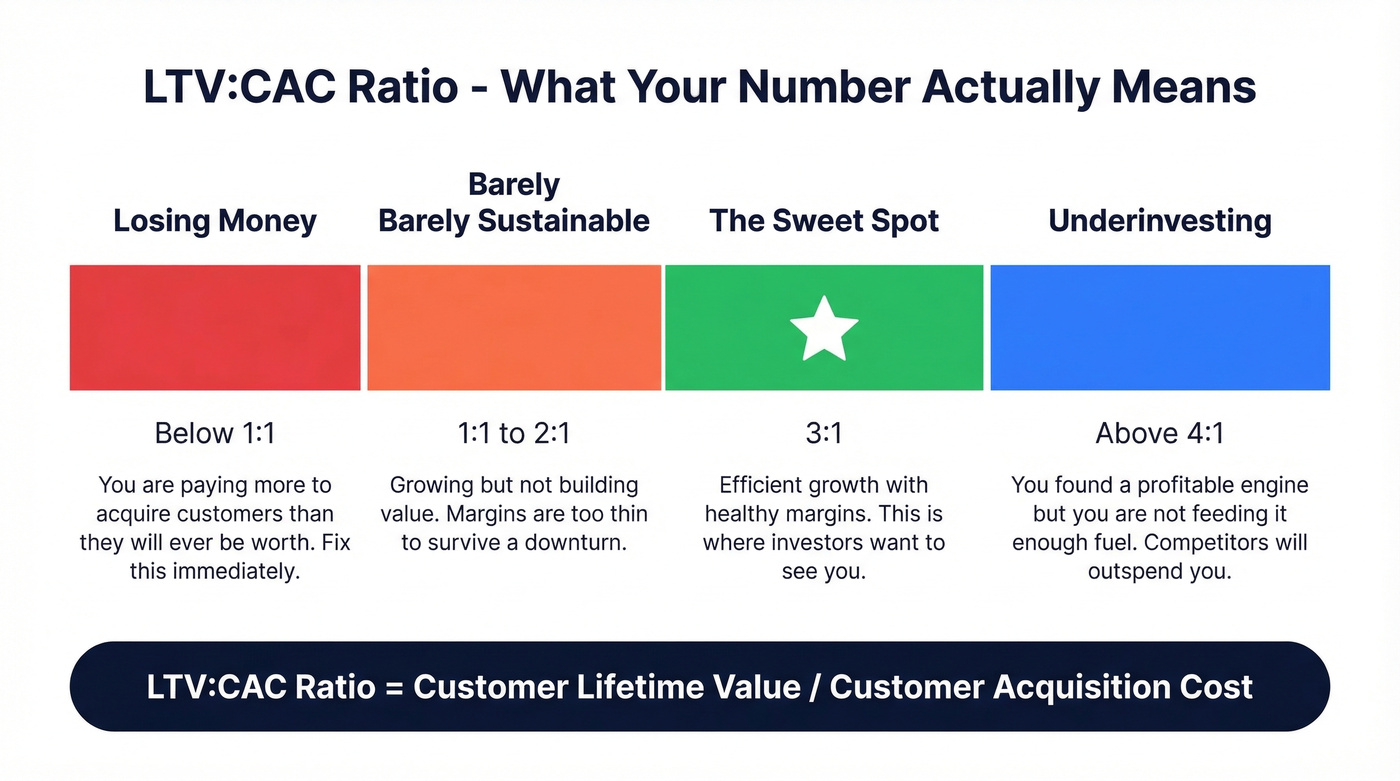
LTV:CAC Ratio = Customer Lifetime Value / Customer Acquisition Cost
The standard benchmark is 3:1. Here's how to read the spectrum:
- Below 1:1 - You're losing money on every customer. Fix this immediately.
- 1:1 to 2:1 - Barely sustainable. You're growing but not building value.
- 3:1 - The sweet spot. Efficient growth with healthy margins.
- Above 4:1 - You're probably underinvesting in growth. You've found a profitable engine and you're not feeding it enough fuel. Competitors will outspend you.
CAC Payback Period
Payback period answers a different question: how many months until a customer's revenue covers their acquisition cost? A more rigorous version incorporates gross margin:
CAC Payback (months) = CAC / (ACV x Gross Margin %) x 12
This matters because revenue isn't profit. If your gross margin is 70%, a $500 CAC takes longer to recover than a simple MRR formula suggests.
Payback benchmarks by SaaS vertical and customer size:
| SaaS Industry | SMB Avg / Good | Enterprise Avg / Good |
|---|---|---|
| Fintech | 12 mo / 7 mo | 23 mo / 18 mo |
| Security | 13 mo / 8 mo | 25 mo / 19 mo |
| Retail | 19 mo / 10 mo | 31 mo / 24 mo |
| eCommerce | 9 mo / 4 mo | 18 mo / 14 mo |
Two limitations worth noting. Payback period ignores churn - if customers leave before payback, you never recover CAC. It also ignores the time value of money - a 24-month payback ties up working capital that could be deployed elsewhere. Both factors mean your effective payback is longer than the formula suggests.
How to Reduce CAC
Stop obsessing over reducing CAC until you're measuring it correctly. Once you are, here are the five highest-impact tactics.
1. Fix your data quality. Every bounced email and disconnected phone number is wasted spend that inflates acquisition costs with zero return. If your SDR team works a list with a 35% bounce rate, more than a third of their effort produces zero pipeline. Teams using Prospeo's 98% verified emails cut bounce rates to under 5% - and in customer results like GreyScout (pipeline up 140%) and Snyk (AE-sourced pipeline up 180%), better data quality translated directly into more pipeline at lower cost per deal.
2. Build referral loops. Referral programs cut acquisition costs by roughly 15% while delivering higher-quality leads. Referred customers already have social proof and convert faster with less sales touch. If you don't have a structured referral program, you're leaving the cheapest channel on the table.
3. Invest in organic and content. The benchmark data is unambiguous - organic CAC is lower than inorganic across all 29 industries First Page Sage tracks. A blog post that ranks keeps generating leads for years at zero marginal cost. Paid channels don't compound. Content does. (If you want a tighter system, start with B2B content marketing.)
4. Optimize conversion rates. Doubling your conversion rate cuts CAC in half without spending an additional dollar on acquisition. Look at every stage of your funnel - landing page to signup, signup to activation, activation to paid. Small gains stack fast, and this is often the cheapest lever to pull because you're improving what you already have rather than buying more of what you don't. Use a simple set of funnel metrics to keep the work focused.
5. Personalize outreach to convert more with less spend. McKinsey's research shows personalization reduces acquisition costs by up to 50%. The retention math reinforces the point: retaining customers is 5-25x cheaper than acquiring new ones. Invest in onboarding, customer success, and personalized outreach to reduce churn and shift your growth mix toward expansion revenue. The cheapest customer to acquire is the one who never leaves.
Skip the "reduce CAC" playbook entirely if you haven't first confirmed your numbers are fully loaded. We've worked with teams that spent months optimizing a metric that was wrong from the start - they were solving the wrong problem. If you're rebuilding your outbound motion, start with proven sales prospecting techniques and a clean lead generation workflow.
Every bounced email is acquisition spend that produced zero customers - pure CAC inflation. Prospeo's 5-step verification and 7-day data refresh keep bounce rates under 4%, so more of your spend converts into pipeline instead of dead addresses.
Cut your bounce rate and your CAC drops with it.
FAQ
What's a Good CAC?
There's no universal "good" number - it depends on your industry, business model, and LTV. Aim for at least a 3:1 LTV:CAC ratio. A $500 acquisition cost is excellent if LTV is $2,000 and terrible if LTV is $400. Use the 2026 benchmarks above to calibrate, then pair with payback period for the full picture.
How Often Should You Calculate CAC?
Track channel-level CAC monthly and blended CAC quarterly. Monthly blended figures are too noisy - a single large deal or seasonal ad swing distorts the picture. Always account for time lag between spend and close. Don't kill a paid channel after one month when your sales cycle runs 90 days.
Does Bad Contact Data Really Affect CAC?
Every bounced email and wrong number is wasted spend that inflates your acquisition costs with zero return. Teams switching to verified data sources routinely cut bounce rates from 35%+ to under 5%, reclaiming a third of their outbound budget overnight. Fixing data quality is one of the fastest ways to lower CAC without changing your strategy or spend.