Net Recurring Revenue: The Metric Everyone Reports and Nobody Defines the Same Way
A founder on r/SaaS posted their NRR last year: 127%. Looked incredible. Then they broke it down - 15 percentage points came from price increases, not usage growth or expansion. Organic NRR was 112%. Still good, but a very different story than the headline number told the board.
That gap between what net recurring revenue says and what it means is the whole problem. Let's fix it.
The Short Version
Net recurring revenue is easiest to think about as a dollar amount, not a percentage: what your existing customer base generates after expansion, contraction, and churn. The percentage version is what most teams mean by "NRR%" - also called NDR%, NDR, DBNRR, and half a dozen other acronyms. More on the naming chaos below.
A "good" NRR% depends on your ACV and subscriber count. In the tracked IPO cohort Blossom Street Ventures follows, the median NDR in Q1 2025 was 108%, down from 123%+ in H1 2022. Always report GRR alongside NRR, segment by ACV band, and separate organic NRR from price-driven NRR. One number alone will mislead you.
What It Actually Means
Net recurring revenue answers one question: "What would top-line revenue do if you didn't gain one more customer?" That framing, borrowed from SaaS Capital, is the cleanest way to think about it.
In dollar terms, it's the total recurring revenue your existing customers produce after expansion through upsells, cross-sells, and seat additions, minus contraction from downgrades and churn from cancellations. New customers don't factor in. This is purely about the health of the base you already have.
Most people use "NRR" to mean the rate. But the underlying dollar movement matters just as much - dollars show magnitude, the rate shows trajectory. Report both.
The Formula
Dollar calculation:
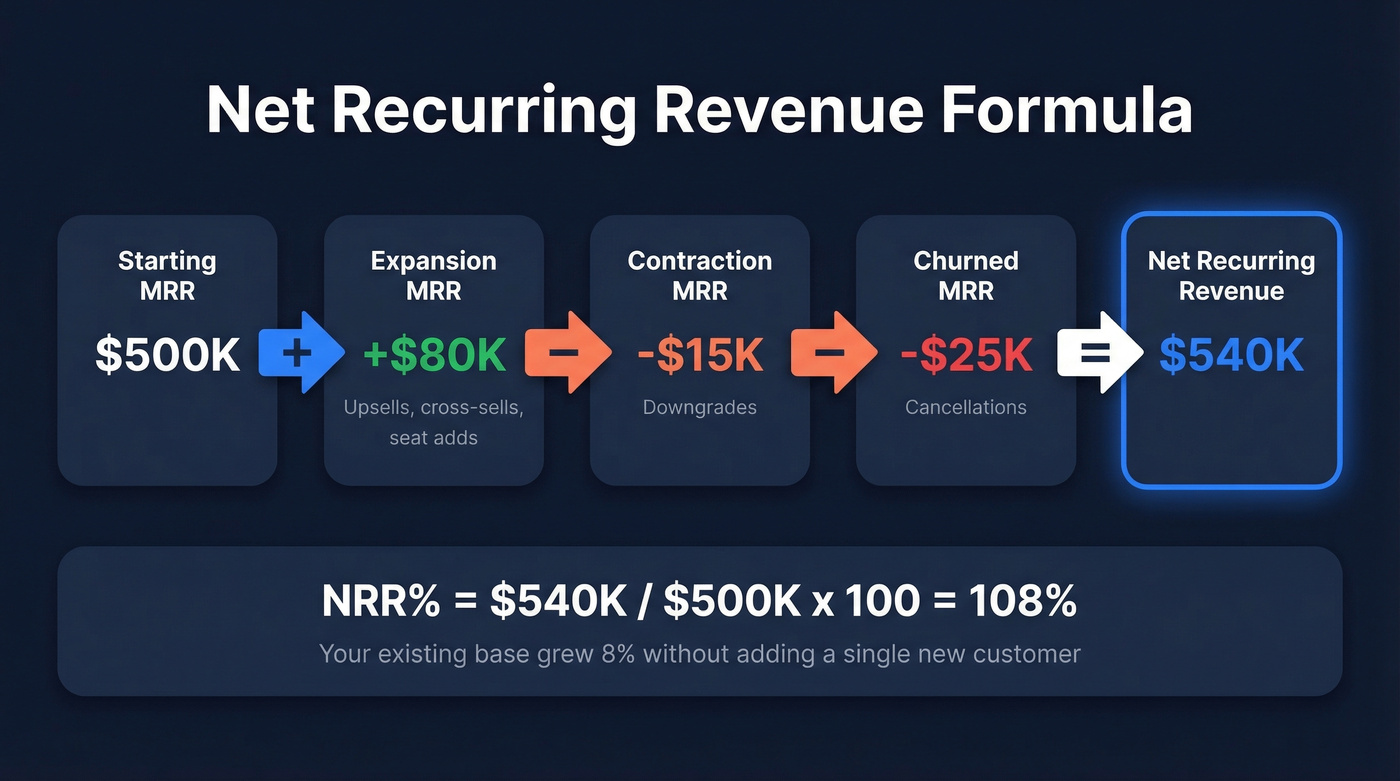
Starting MRR + Expansion MRR - Contraction MRR - Churned MRR = Net Recurring Revenue
NRR% (the rate):
Net Recurring Revenue / Starting MRR x 100 = NRR%
Say you started the year with $500K in MRR from existing customers. Over the period, those customers added $80K in expansion, contracted $15K in downgrades, and $25K churned entirely.
Net recurring revenue = $500K + $80K - $15K - $25K = $540K
NRR% = $540K / $500K = 108%
That 108% means your existing base grew 8% without a single new logo. But here's the thing: two companies can both hit 108% with wildly different dynamics. One might have 2% churn offset by 10% expansion. Another might have 15% churn masked by 23% expansion. Same rate, very different retention health, and very different risk profiles if expansion slows down.
The Terminology Mess
There's no standard name for this metric. Ordway analyzed 150+ publicly traded companies and found surprising diversity in how companies label what is fundamentally the same calculation.
| Name | Abbreviation | Share of Filings |
|---|---|---|
| Dollar-Based Net Retention | DBNRR | ~30% |
| Net Dollar Expansion Rate | NDER | ~17% |
| Net Revenue Retention Rate | NRRR | ~16% |
| Net Dollar Retention Rate | NDRR | ~13% |
| Other variants | - | ~24% |
It gets worse. Forte distinguishes net recurring revenue retention by excluding what it classifies as non-recurring revenue - including one-time purchases, upsells, and cross-sells. That directly contradicts how most SaaS companies treat expansion MRR, which is exactly why cross-company comparisons break unless you read the fine print.
If you can't explain your cohort rules in one paragraph, your NRR isn't comparable to anyone else's.
Expansion revenue now drives 40% of growth for scaling SaaS companies. That means your team needs to reach existing accounts with the right upsell message at the right time. Prospeo gives you 98% accurate emails, 125M+ verified mobiles, and buyer intent data across 15,000 topics - so your expansion plays actually land.
Stop leaking NRR because your contact data is stale.
NRR vs GRR: You Need Both
Use NRR when you want the full picture - how your base is growing or shrinking after all forces, expansion included. This is the number investors fixate on because it captures compounding potential.
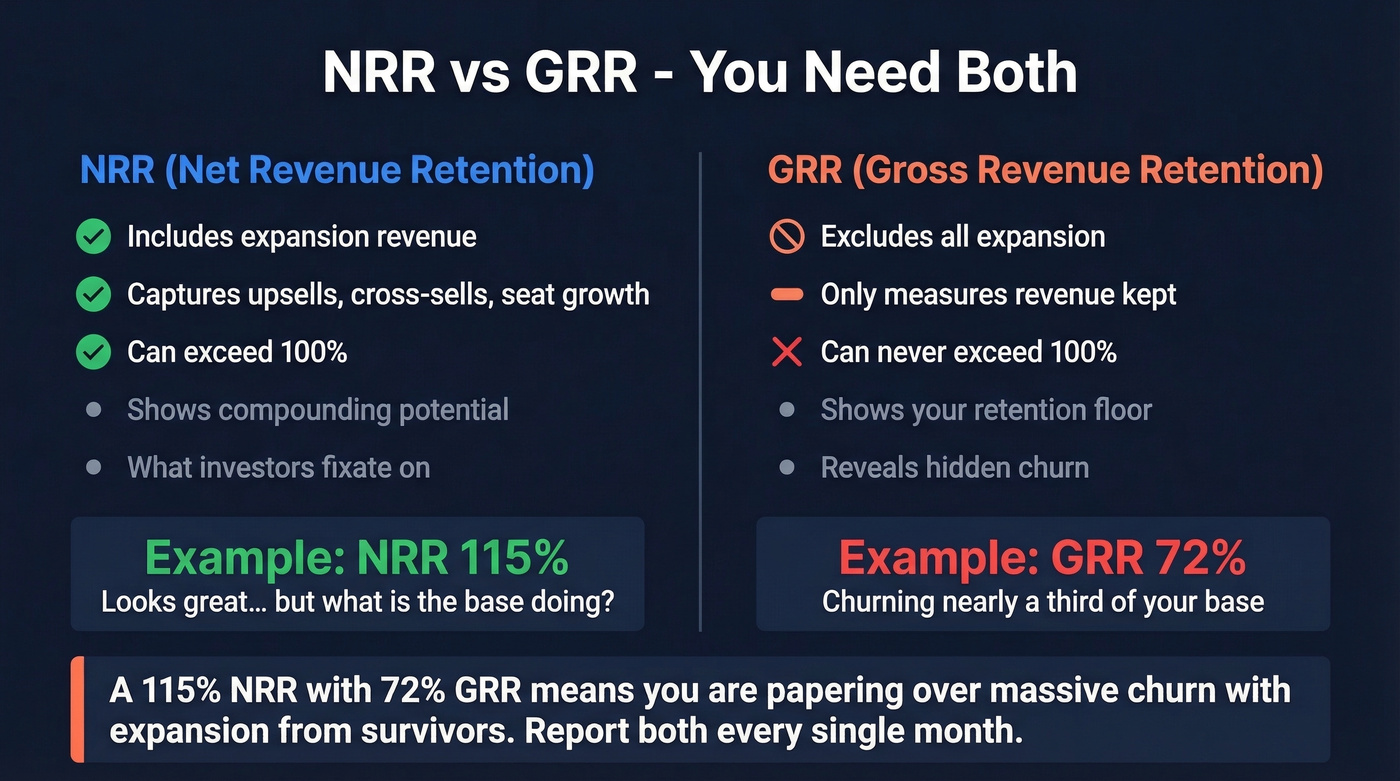
Use GRR when you want the retention floor. Gross renewal rate strips out expansion entirely. It only measures how much of your starting revenue you kept. GRR can never exceed 100%.
NRR without GRR is like reporting net income without revenue. A 115% NRR looks great until you realize GRR is 72%, meaning you're churning nearly a third of your base and papering over it with expansion from the survivors. We've seen this pattern repeatedly in portfolio companies that look healthy on the surface and are quietly bleeding out underneath. Report both every single month.
2026 Benchmarks
All benchmarks below reflect the most recent aggregate data available - primarily 2024 through Q1 2025.
By ACV (Private SaaS)
ACV is the best benchmarking lens for private companies. For companies with ACV in the $25K-$50K range, the median NRR is 102%, top quartile hits 111%, and bottom quartile sits at 97%.
That top-quartile number - 111% - is a long way from the "120% is great" mantra that dominates SaaS Twitter. For most private companies selling mid-market deals, breaking 110% puts you in elite territory. Adjust your targets to your ACV band, not to Snowflake's S-1.
By Subscriber Count
ChartMogul's analysis of 2,500+ SaaS businesses reveals something most benchmark posts ignore: subscriber count crushes NRR at scale. In H1 2024, top-quartile companies with 1,500 or fewer subscribers achieved roughly 100% NRR. Companies with more than 12,000 subscribers? NRR dropped to about 76%.
Stop chasing 120% as a universal goal. For most SaaS businesses past a few thousand subscribers, 100-110% is the realistic "excellent" band. The math of large denominators works against you, and pretending otherwise just sets your team up to chase a number that doesn't match your business model.
Public-Company Trend
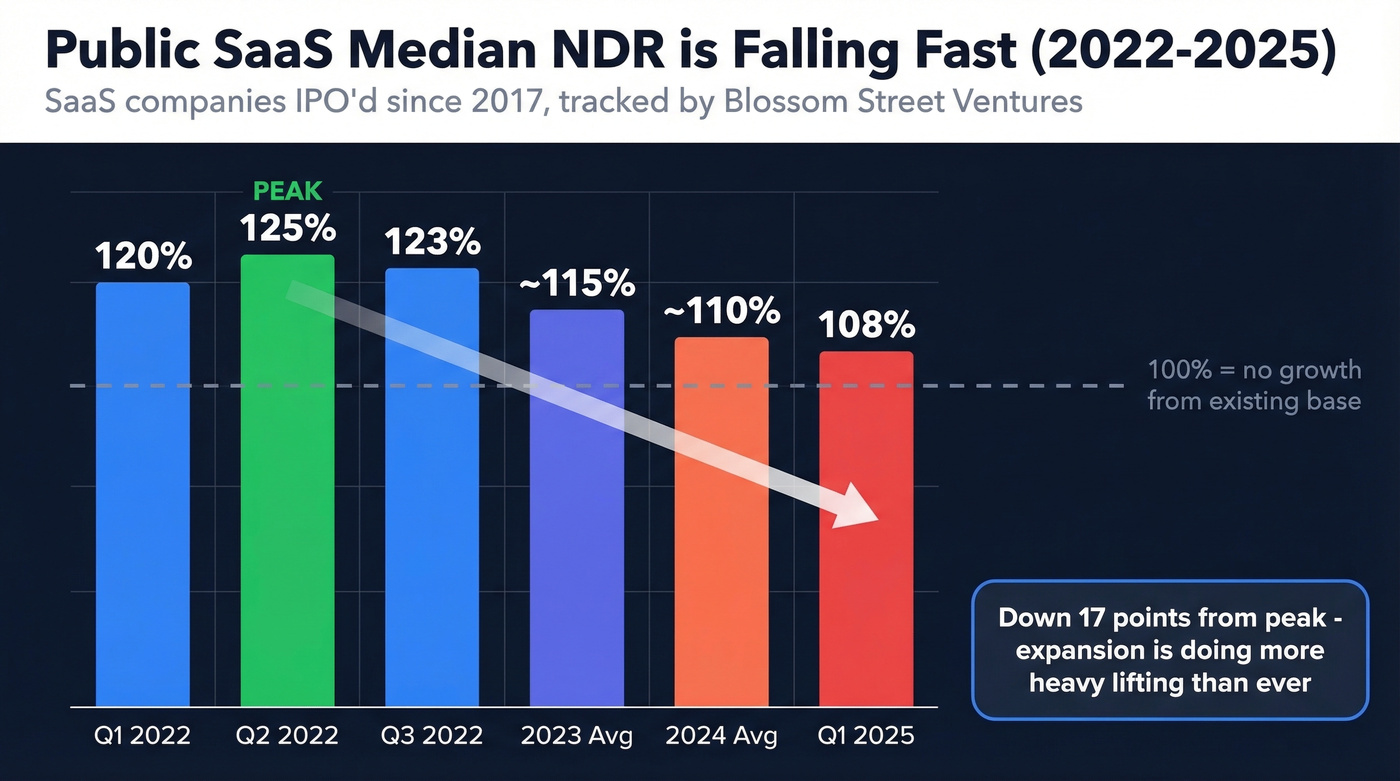
The macro picture is sobering. Blossom Street Ventures tracks SaaS companies IPO'd since 2017, and the median NDR in Q1 2025 was 108% - down sharply from the 2022 highs.
| Period | Median NDR |
|---|---|
| Q1 2022 | 120% |
| Q2 2022 | 125% (peak) |
| Q3 2022 | 123% |
| 2023 avg | ~115% |
| 2024 avg | ~107-112% |
| Q1 2025 | 108% |
Expansion is doing more heavy lifting than ever. ChartMogul found that companies at $15M-$30M+ ARR now derive about 40% of growth from expansion, up from roughly 30% in early 2021. Tracking quarterly renewed ARR alongside expansion gives finance teams a clearer picture of whether growth is coming from existing commitments or new upsells. Expansion isn't a bonus anymore - it's structural.
Why Investors Obsess Over NRR
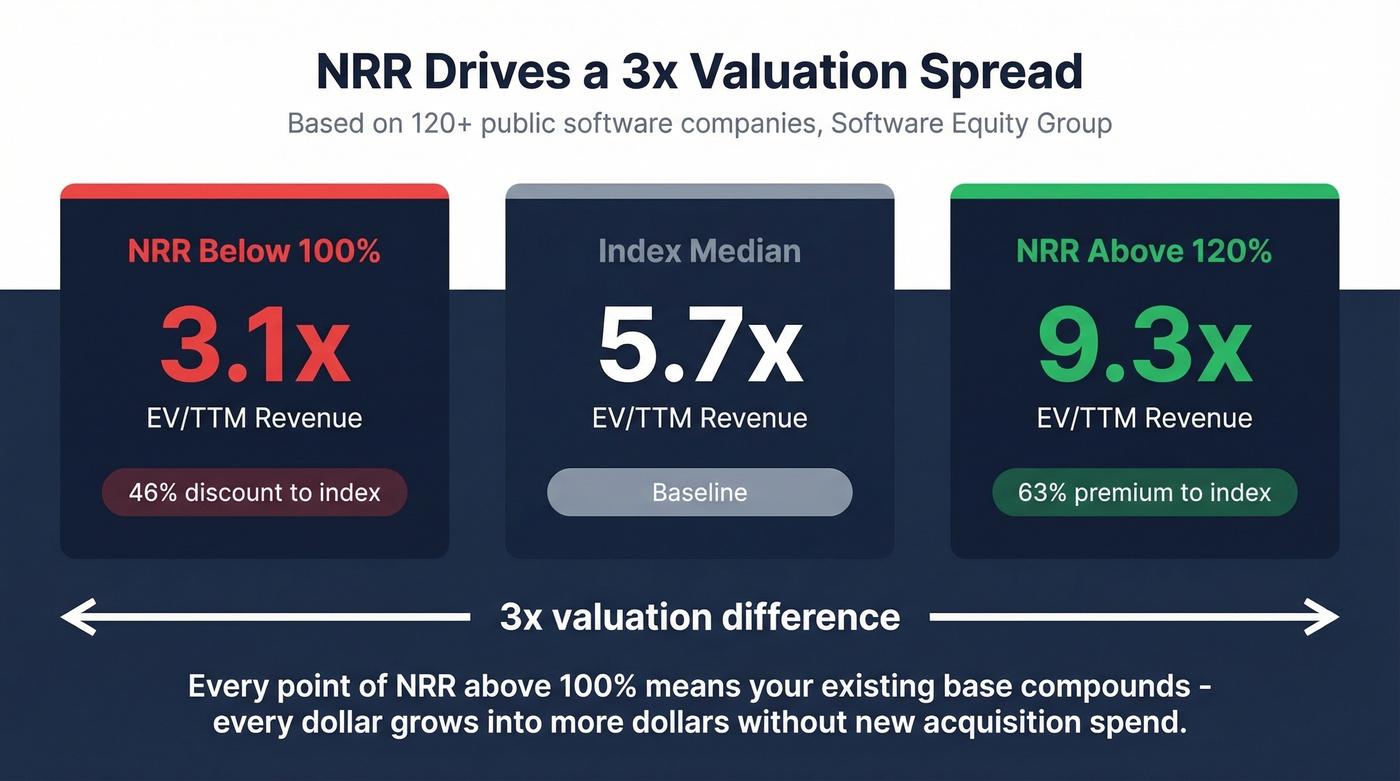
The valuation math is brutal. Software Equity Group's analysis of 120+ public software companies found that NRR below 100% correlates with a median EV/TTM revenue multiple of 3.1x - a 46% discount to the 5.7x index median. NRR above 120%? Median multiple of 9.3x, a 63% premium. That's a 3x valuation spread driven by a single metric.
The 2025 valuation framework from SaaS Capital uses three core inputs: public market multiples, ARR growth rate, and NRR. Their index median sits at 7.0x run-rate revenue entering 2025, down roughly 60% from the 2021 peak but stabilized in the 6-7x range.
NRR above 100% means your existing base compounds - every dollar grows into more dollars without new acquisition spend. Below 100%, you're running on a treadmill, spending to replace what's leaking. Multiply that 8% organic growth across a $5M base and you're looking at $400K in free revenue. That's why investors care so viscerally about this number.
How This Metric Lies to You
Price-Inflated NRR
That r/SaaS founder we mentioned up top broke down their 127% NRR: +8% from usage growth, +11% from seat additions, +15% from price increases, -7% from churn. Strip out the price hikes and organic NRR drops to 112%.
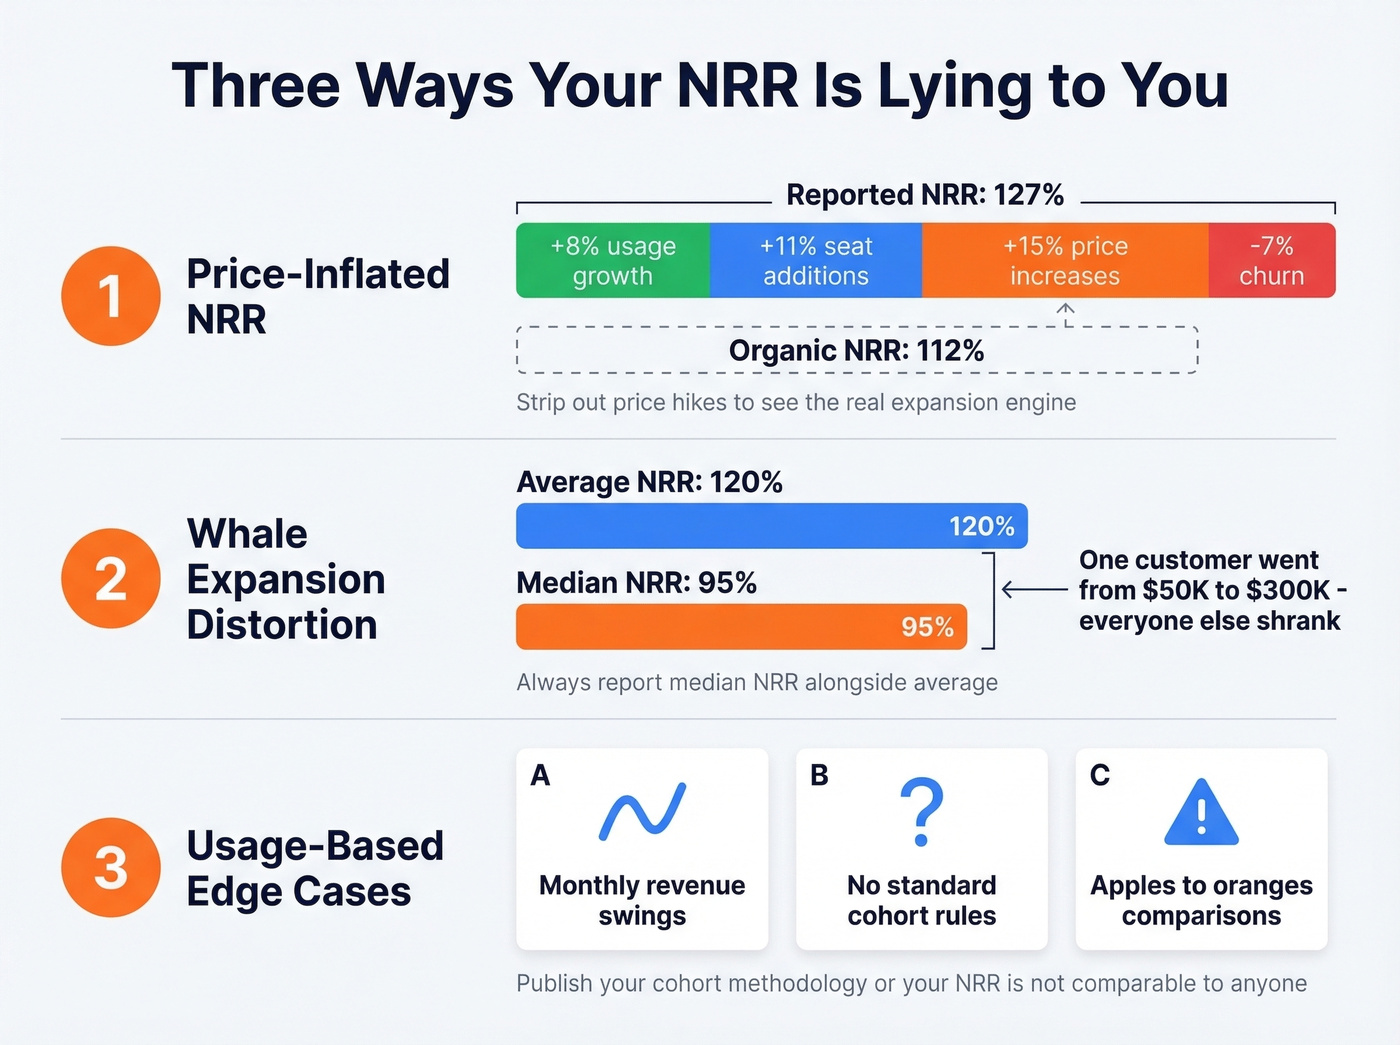
Imagine presenting that 127% to your board without the breakdown. The board thinks you've built an incredible expansion engine. In reality, you raised prices and customers haven't left yet. Always separate price-driven NRR from organic NRR in your reporting.
Whale Expansion Distortion
Another operator reported 120% NRR - driven almost entirely by one customer expanding from $50K to $300K ARR. The rest of the cohort sat at roughly 95%. If that whale churns, NRR craters overnight.
The fix: report median NRR alongside the average. Median strips out outlier distortion and shows what your typical customer is doing.
Usage-Based Edge Cases
If you're on usage-based pricing, there's no single standard for how to calculate NRR. Pay-as-you-go customers with no commitment, capacity contracts with minimums and overages, monthly revenue swings that make cohort comparisons noisy - some companies smooth this with trailing-twelve-month averages, others don't.
Look, if your pricing model is usage-based, your NRR is only meaningful if you publish your cohort methodology alongside it. Otherwise you're comparing apples to something that isn't even fruit.
Building a Retention Strategy That Protects Revenue
If we had to pick three retention views, they'd be GRR, NRR, and segmented NRR by ACV band. Fourth: organic NRR excluding price increases.
DemandMaven's retention framework offers the most actionable diagnostic we've seen. Split churn into qualified vs. unqualified. Wrong-fit customers who churn? Healthy - you don't want them. Right-fit customers who churn? Alarming. Interview 5-10 customers per bucket and the patterns will tell you whether your problem is onboarding, product-market fit, or pricing.
Segment NRR by plan type, acquisition channel, and ACV band. A team selling $5K deals through inbound might have 95% NRR while $50K deals from outbound run at 115%. Those require completely different interventions.
Here's the lever most teams miss: wrong-fit acquisition drives churn. If your outbound targets stale contacts or mismatched ICPs, you acquire accounts that never fully activate - and they churn fast, dragging net recurring revenue down. Tightening your ICP and ensuring contact data is accurate and fresh is a retention lever, not just a pipeline lever. Prospeo's 98% email accuracy and 7-day data refresh cycle help teams reach the right buyers with deliverable contact data, so retention metrics aren't fighting upstream data quality problems.
NRR below 100% costs you a 46% valuation discount. Every churned account you could have saved - and every expansion you missed - starts with a failed conversation. Prospeo refreshes data every 7 days (not 6 weeks) so your CS and expansion reps always reach real people at real numbers. At $0.01 per email, the ROI math is obvious.
Reach every account before they churn - with data that's never more than a week old.
FAQ
What's the difference between net recurring revenue and NRR?
Net recurring revenue is the dollar amount your existing customers generate after accounting for expansion, contraction, and churn. NRR is the percentage version - that dollar figure divided by starting recurring revenue, multiplied by 100. Report both: dollars show magnitude, the rate shows trajectory.
What's a realistic NRR target for 2026?
For private SaaS with ACV $25K-$50K, the median is 102% and top quartile is 111%. In the tracked IPO cohort Blossom Street Ventures follows, median NDR sat at 108% as of Q1 2025. Chasing 120%+ is unrealistic for most businesses past roughly 1,500 subscribers - benchmark against your ACV band instead.
Can better prospecting data improve NRR?
Yes - wrong-fit customers churn fastest. If your outbound targets stale contacts or mismatched ICPs, you acquire accounts that never activate fully. Cleaning up your data quality upstream means the customers you close are the ones who stay.
How does gross renewal rate differ from NRR?
Gross renewal rate measures the percentage of recurring revenue retained without counting expansion - your retention floor. NRR layers expansion on top, which can mask high churn. A company with 75% GRR and 115% NRR is losing a quarter of its base every cycle and relying on survivors to expand aggressively. Report both for an honest picture. SaaS Capital's benchmarking guide breaks this down in more detail.