Pipeline Coverage: What It Is, Why the 3x Rule Is Wrong, and How to Fix It
It's week three of the quarter. Your CRM says 3.8x pipeline coverage. Feels safe - until you realize 60% of that pipeline is sitting in Discovery, half the close dates haven't been updated since last month, and three of your biggest deals haven't had a meeting in six weeks. That 3.8x is fiction. You're about to miss.
Most advice on this metric comes from people selling pipeline management software. They want you to believe it's simple: hit 3x, you're golden. It's not. Your actual target depends on your win rate, sales cycle, CRM hygiene, and whether your pipeline is built on real prospects or phantom contacts nobody can actually reach.
The One Thing You Need to Know
Your coverage target = 1 / (week-3 pipeline conversion rate). Not 1 / win rate. That single change will give you a more accurate target than any "3x rule" ever will. The rest of this guide covers segment benchmarks, weighted pipeline math, CRM setup for Salesforce and HubSpot, and the five mistakes that silently wreck your ratio.
What Is Pipeline Coverage?
Pipeline coverage measures whether you have enough open opportunities to hit your revenue target for a given period:
Total Open Pipeline / Revenue Target = Coverage Ratio
If your team has $3M in open pipeline and a $1M quarterly target, your coverage ratio is 3x. You need to close one-third of your pipeline to hit quota.
The metric works as a leading indicator for revenue-dependent businesses. When sales coverage drops below a healthy threshold, you're looking at a miss two to three months from now - long before it shows up in closed-won numbers. That early warning is the whole point. But "healthy threshold" is where things get complicated, and where most advice goes wrong.
Why It Matters (And When It Doesn't)
This ratio is the closest thing sales orgs have to a check-engine light. A team running at 1.5x for next quarter isn't going to magically close its way to target. The math doesn't allow it. Seeing that number early - while there's still time to generate, accelerate, or reallocate - is the difference between a recoverable quarter and a fire drill in month three.
The metric matters most when your sales cycle is longer than your measurement period. Enterprise teams with 6-9 month cycles measuring quarterly coverage? That's the sweet spot. The pipeline that'll close this quarter was mostly created last quarter, so the ratio gives you a genuine read on what's coming.
Where it breaks down: velocity models with 30-day sales cycles, expansion-heavy revenue motions where upsells get created and closed in the same week, and PLG companies where pipeline is a lagging artifact of product usage. If most of your revenue comes from expansion deals that enter the CRM at Stage 4, your coverage ratio will always look thin - and that's fine. Coverage is a tool, not a religion.
Why the 3x Rule Is Wrong
Every article says "aim for 3x." Dave Kellogg, who's written more rigorously about this than anyone in SaaS, has a different take: when a CRO says they need 3.5x, 4x, or 5x coverage, it's not a generation problem. It's a quality problem.
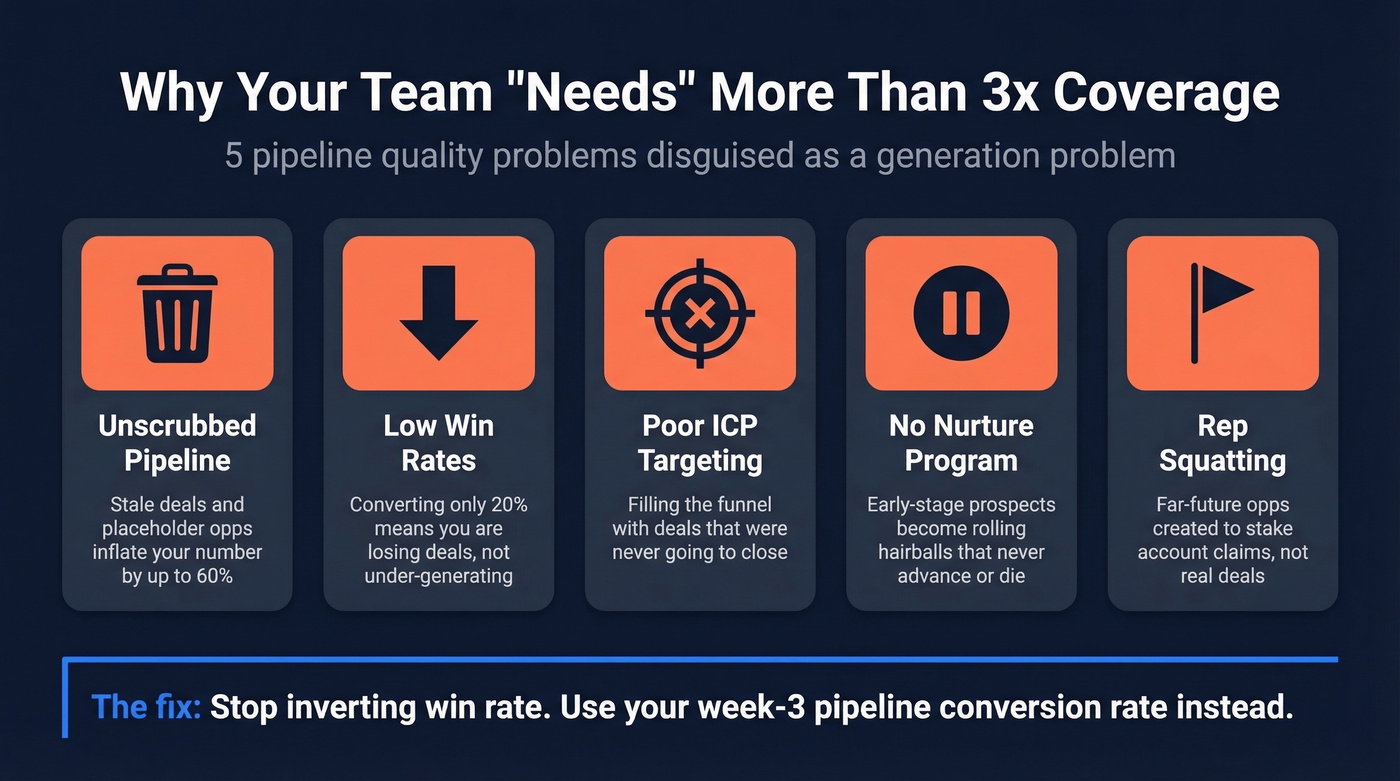
Here's the diagnostic. If your org "needs" more than 3x, at least one of these five things is true:
The pipeline isn't scrubbed. Junk opportunities - stale deals, placeholder opps, deals with no next step - inflate the number. One sales leader managing 150 reps reported their pipeline was inflated by roughly 60% due to wrong values, outdated info, and incorrect close dates. That r/salesforce thread is worth reading; the operational frustration is palpable, and the replies confirm this isn't an outlier.
You lose too much. If you're converting 20% of pipeline, the answer isn't "generate 5x." It's fix your win/loss analysis, messaging, and sales training.
The pipeline is low quality. ICP and targeting issues mean you're filling the funnel with deals that were never going to close. Tighten qualification with MEDDIC before you generate more top-of-funnel.
There's no nurture program. Without nurture, early-stage prospects become "rolling hairballs" - fake opportunities that sit in pipeline for quarters, never advancing, never dying.
Reps are squatting. Creating far-future opportunities to stake account claims, not because there's a real deal.
Now here's the math mistake that makes it worse. Most teams calculate their coverage target by inverting their win rate. Win rate is 25%? Must need 4x. Win rate drops to 20%? Better generate 5x.
This is wrong, for three reasons. First, "win rate" is ambiguous - narrow win rate excludes no-decisions and derails, while broad win rate includes them, and the difference can be 15+ percentage points. Second, deals slip. The "win a third, lose a third, slip a third" dynamic means a chunk of your pipeline doesn't resolve within the measurement period at all. Third, there's a timing mismatch: you assess coverage at the start of the quarter, but win rate is calculated from terminal outcomes within the quarter.
The fix? Stop inverting win rate. Use week-3 pipeline conversion rate instead.
How to Set Your Coverage Target
Week-3 Conversion Rate Method
Instead of asking "what's our win rate?", ask: "of the pipeline we had at week 3 of last quarter, how much actually closed that quarter?" That's your week-3 pipeline conversion rate.
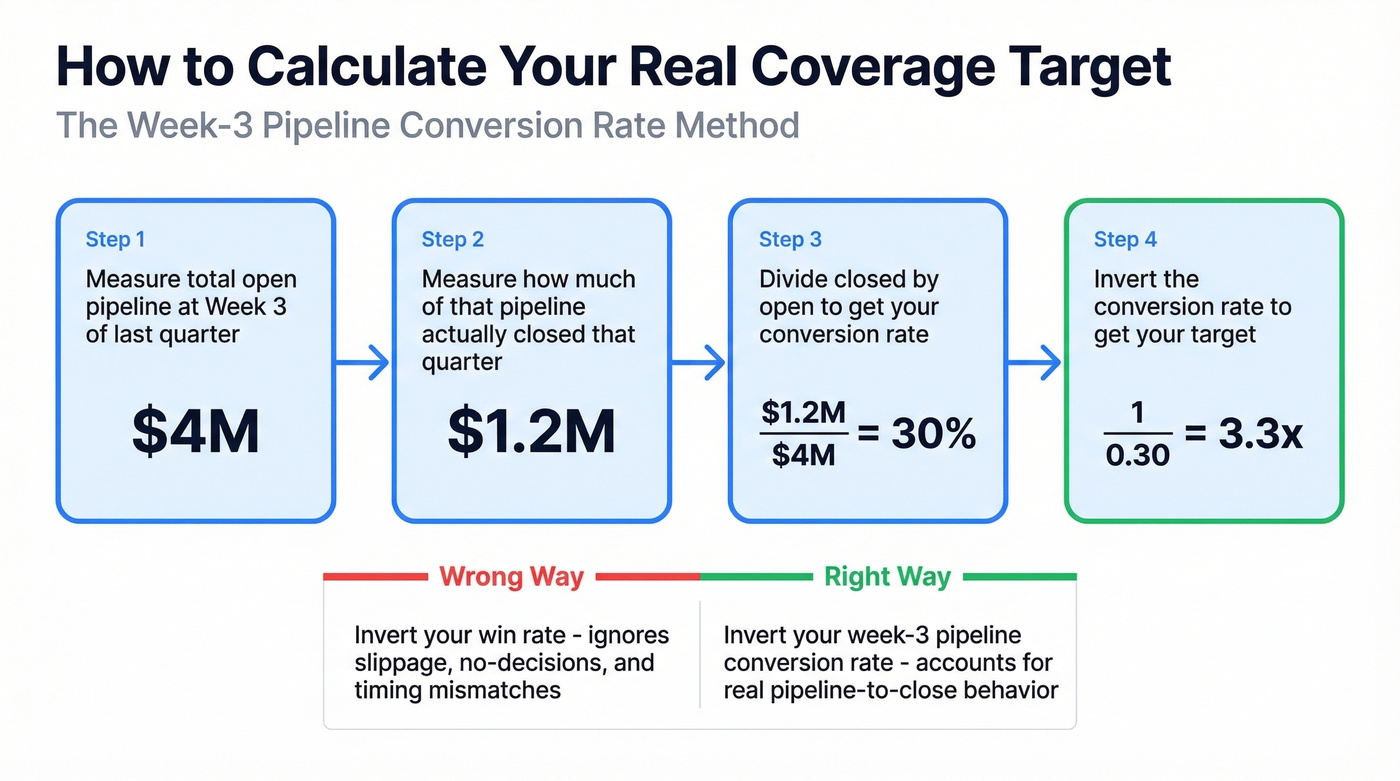
Say you started Q1 week 3 with $4M in pipeline and closed $1.2M that quarter. Your conversion rate is 30%. Invert that: 1 / 0.30 = 3.3x. That's your coverage target - derived from actual pipeline-to-close behavior, not from a theoretical close rate. This method accounts for deals that slip, stall, or get no-decisioned. It's grounded in your org's real conversion dynamics.
In our experience, teams that adopt this approach discover their "real" target is 0.5-1x different from what they'd been using. Sometimes higher, sometimes lower. Either way, it's a number they can actually trust.
Period-Specific Targets
Not every month needs the same coverage. A deal that's closing this month is almost certainly already in late-stage pipeline. A deal closing in four months might not exist yet.
| Time Horizon | Coverage Target | Why |
|---|---|---|
| Current month | ~1.3x | Most revenue already committed |
| Next month | ~2x | Pipeline mostly created |
| Month 3 | ~3x | Buffer needed for slippage |
| Month 4+ | 3-5x | Highest uncertainty |
The further out you look, the more pipeline you need because more of it hasn't been created yet. Simple as that.
Segment-Specific Benchmarks
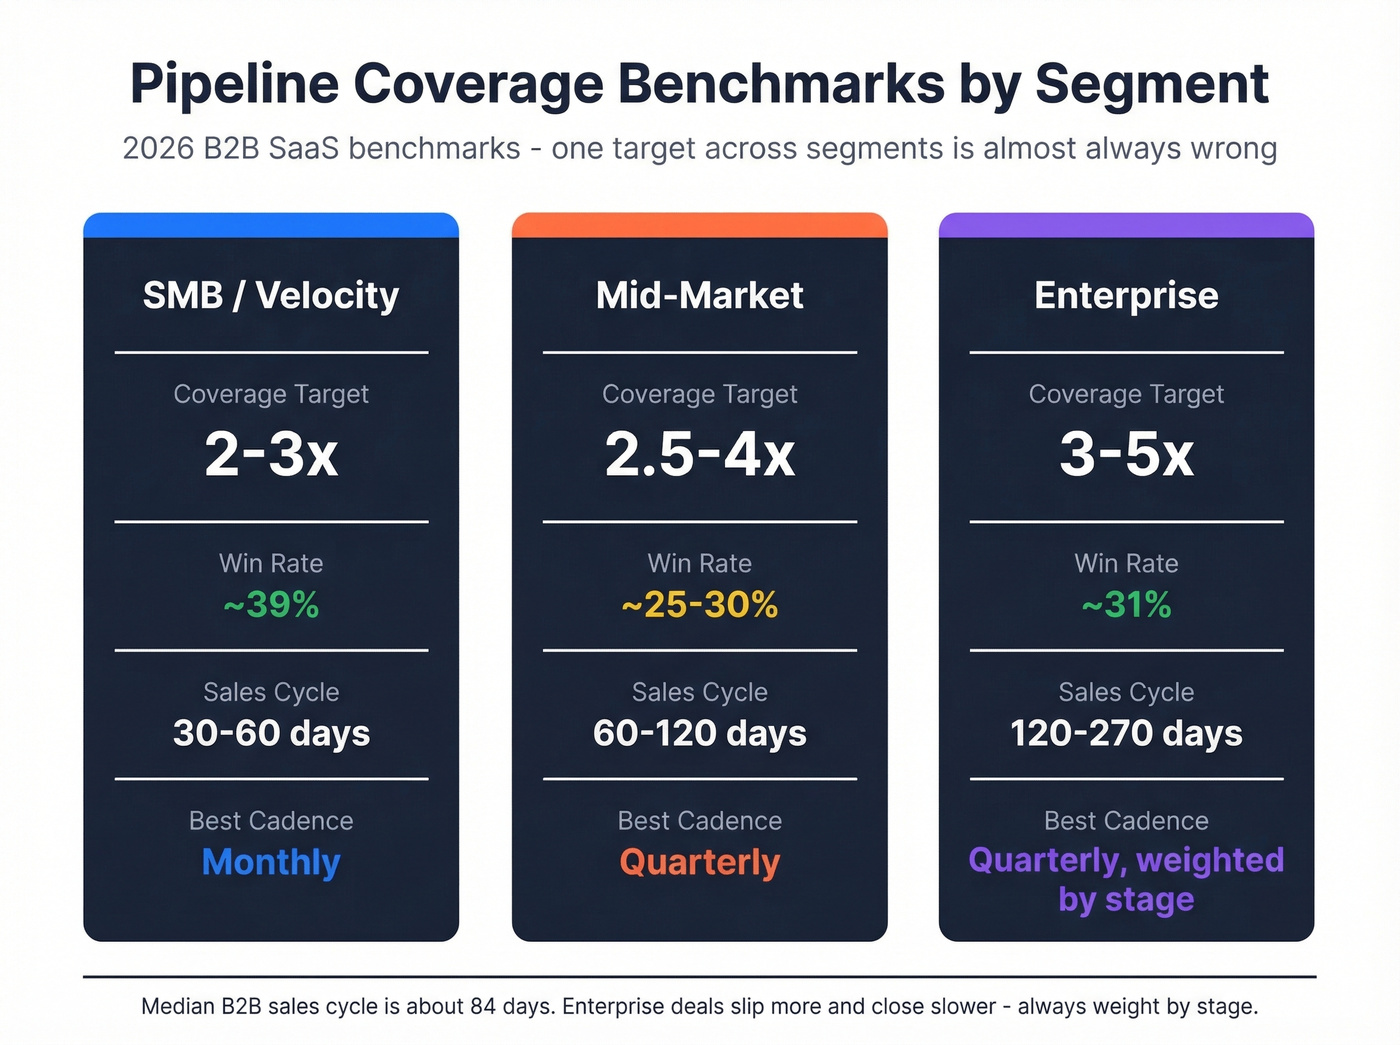
Your coverage target should also vary by segment. Enterprise deals slip more, close slower, and convert at lower rates than SMB velocity deals:
| Segment | Coverage Target | Typical Win Rate | Avg Sales Cycle | Notes |
|---|---|---|---|---|
| SMB / Velocity | 2-3x | ~39% | 30-60 days | Monthly cadence |
| Mid-Market | 2.5-4x | ~25-30% | 60-120 days | Quarterly works |
| Enterprise | 3-5x | ~31% | 120-270 days | Weight by stage |
Median B2B sales cycle sits around 84 days, with enterprise opportunity-to-close rates around 31% and SMB closer to 39%. The point isn't to memorize a number. It's to recognize that a single target across segments is almost always wrong.
Your coverage ratio is only as good as the pipeline behind it. If deals stall because reps can't reach decision-makers, you're inflating a number that will never convert. Prospeo gives you 98% verified emails and 125M+ direct dials - so every opportunity in your CRM has a real human attached to it.
Stop covering quota with phantom contacts. Start with data that connects.
Weighted vs. Unweighted Coverage
Unweighted coverage treats every dollar of pipeline equally. A $500K deal in Qualification counts the same as a $500K deal in Negotiation. That's obviously wrong - but it's how most teams report the ratio.
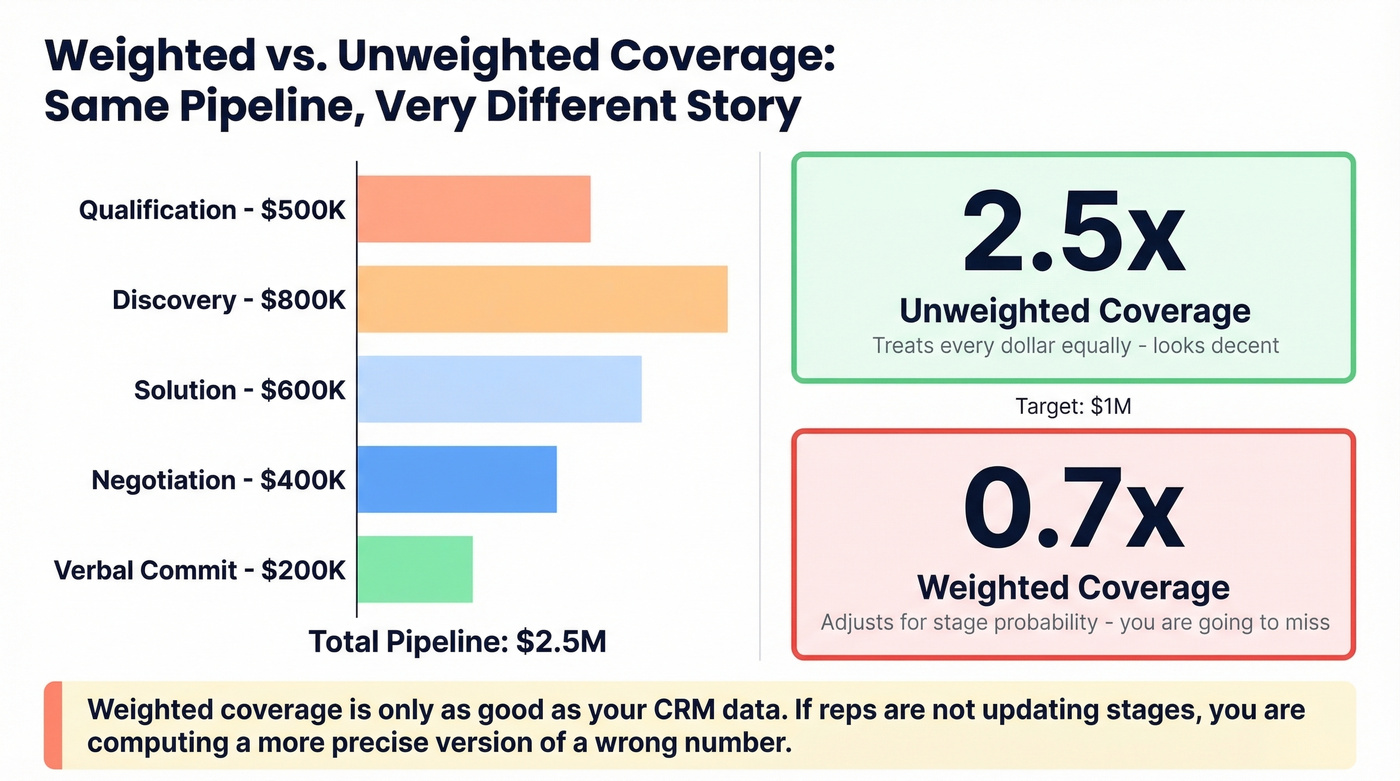
Weighted coverage multiplies each deal's value by its stage probability, giving you a more realistic picture of what's likely to close. Here's a worked example against a $1M target:
| Stage | Pipeline Value | Win Probability | Weighted Value |
|---|---|---|---|
| Qualification | $500K | 5% | $25K |
| Discovery | $800K | 10% | $80K |
| Solution | $600K | 30% | $180K |
| Negotiation | $400K | 60% | $240K |
| Verbal Commit | $200K | 90% | $180K |
| Total | $2.5M | - | $705K |
Unweighted coverage: $2.5M / $1M = 2.5x. Looks decent. Weighted coverage: $705K / $1M = 0.705x. You're going to miss.
Let's be honest: weighted coverage is only as good as your CRM data. If reps aren't updating stages, if probabilities are default values nobody's calibrated, if deals sit in Discovery for 90 days with no activity - you're computing a more precise version of a wrong number.
We've audited dozens of CRMs and seen teams invest weeks building weighted coverage dashboards only to realize the underlying stage data was garbage. Get the data right first. Then build the dashboard.
Coverage for Short Sales Cycles
If your average sales cycle is 30 days, quarterly pipeline coverage is basically meaningless. Most of the pipeline that'll close in months two and three hasn't been created yet. Measuring it at week 3 tells you almost nothing.
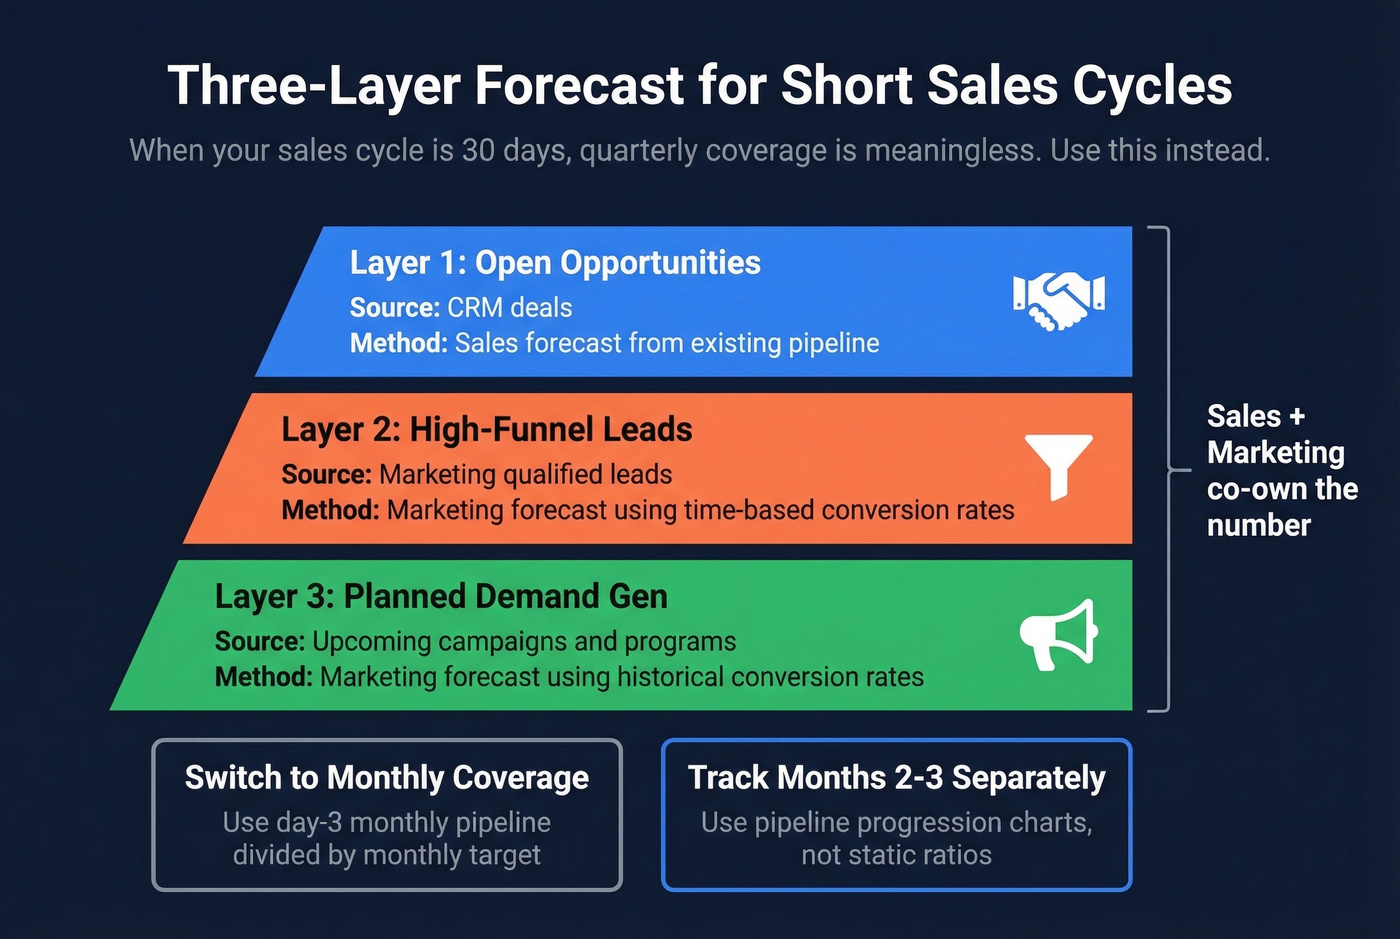
Switch to monthly coverage. Use day-3 monthly pipeline divided by monthly target. Treat months two and three like out-quarter pipeline - track them with pipeline progression charts rather than static ratios.
For velocity models, a three-layer forecast approach works best:
| Layer | Source | Method |
|---|---|---|
| Layer 1 | Open opportunities in CRM | Sales forecast from existing deals |
| Layer 2 | High-funnel leads | Marketing forecast using time-based conversion rates |
| Layer 3 | Planned demand gen | Marketing forecast using historical conversion rates |
This forces marketing and sales to co-own the pipeline number. It also makes coverage a living metric rather than a quarterly snapshot that's stale by week four.
How to Track Coverage in Your CRM
Salesforce
Salesforce makes this relatively straightforward. The Expected Revenue field - Amount multiplied by Opportunity Probability - gives you weighted pipeline out of the box. Build a report grouped by close date period, sum the Expected Revenue column, and compare it to your target.

For unweighted coverage, a simple Opportunities report filtered to open deals with close dates in the target period, summed by Amount, gets you there. Dashboard it with a gauge component showing pipeline vs. quota and you've got a real-time coverage view.
If you're still evaluating tools, it helps to start with a few examples of a CRM to sanity-check what "good reporting" should look like.
HubSpot
HubSpot's Forecast tool shows coverage, but there's a frustrating limitation: Goals can't be joined to Deals in custom reports. You can see coverage in the Forecast view, but you can't build a custom report that pulls both your goal number and your pipeline total into one visualization.
Workarounds, in order of sophistication: export goals and pipeline totals to Google Sheets - quick and dirty, but it works. Create custom deal properties to store goal amounts and compute coverage via calculated fields. If you have Operations Hub, use scheduled workflows to calculate coverage and write it to a property. None of these are elegant. It's the kind of gap that makes RevOps teams quietly resentful.
Spreadsheet Fallback
If you're on a CRM that doesn't support this natively, a spreadsheet works fine. Use the weighted example from the previous section as your template. List every open deal, its stage, its value, and the stage probability. Multiply, sum, divide by target. Update it weekly. Takes 15 minutes and it's more accurate than a dashboard built on dirty CRM data.
Mistakes That Wreck Your Ratio
Five patterns we see repeatedly that make coverage ratios useless:
No pipeline hygiene cadence. If you're not scrubbing pipeline at least biweekly, your coverage number is fiction. That 60% inflation figure isn't unusual - we've seen it in nearly every CRM audit we've done. Set a rule: any deal with no activity in 30 days gets flagged. Any deal past its close date by 14 days gets moved or killed. Reps will push back. Do it anyway.
Ignoring stage distribution. 3x coverage where 50%+ sits in early stages isn't the same as 3x where half is in Negotiation. Look at the shape of your pipeline, not just the total. When your weighted number tells a different story than your unweighted number, you've got a stage distribution problem.
Treating all pipeline equally. High-ICP accounts make up only about 23% of total pipeline for many organizations. That means 77% of your pipeline is lower-fit deals that convert at lower rates. If you're not segmenting coverage by ICP tier, your 3x is really more like 1.5x of pipeline that matters. (If you need a starting point, use an ideal customer profile scoring rubric.)
The "generate more" reflex. When coverage drops, the instinct is to create more pipeline. Sometimes that's right. But if your win rate is 15% and your pipeline is 60% inflated, generating more top-of-funnel just adds noise. Fix quality first.
Bad upstream data creating ghost pipeline. This one's insidious. SDRs prospect a list, book meetings, create opportunities - and then half the contacts bounce on the first email sequence. Those opportunities were never real. They're phantom pipeline built on unverified data.
If your team's outbound bounce rate is running 30-35%, a meaningful chunk of your pipeline is built on contacts you can't reach. That's a data quality problem, not a coverage problem. Verify emails before you prospect. (If you want benchmarks and fixes, see email bounce rate.) Prospeo's 98% email accuracy and 7-day data refresh cycle catch bad contacts at the source - Meritt dropped bounce rates from 35% to under 4% after switching, and their pipeline quality transformed overnight.
Low-quality pipeline is the #1 reason teams need 5x coverage instead of 3x. When your ICP targeting is off and contact data bounces, you're generating volume to compensate for bad data. Prospeo's 30+ filters - buyer intent, technographics, headcount growth, funding - let you build pipeline that actually converts at the rates your model assumes.
Fix your pipeline quality and your coverage ratio fixes itself.
Most Teams Don't Have a Coverage Problem
Here's something nobody selling pipeline software will tell you: if your deal sizes are under $15K and your sales cycle is under 60 days, you probably don't need to obsess over pipeline coverage at all. Your energy is better spent on lead quality, speed-to-lead, and conversion rate optimization. The metric becomes critical when deals are large enough and slow enough that you need a two-month early warning system. For everyone else, it's a nice-to-have that can easily become a vanity number.
Skip the coverage dashboards if that's you. Focus on what actually moves revenue.
If you want a broader set of leading indicators beyond coverage, track pipeline health alongside stage distribution and conversion rates.
FAQ
What is pipeline coverage?
Pipeline coverage is the ratio of total open pipeline to your revenue target for a given period - typically a quarter. A $3M pipeline against a $1M quota equals 3x. It acts as an early warning system, flagging revenue shortfalls two to three months before they hit closed-won numbers.
What's a good coverage ratio?
3x is a common starting point, but your real target depends on win rate, sales cycle, and CRM hygiene. Use the week-3 pipeline conversion rate method to derive your actual number from historical data. SMB velocity teams often operate at 2x; enterprise orgs with longer cycles need 4-5x.
How often should you measure it?
Weekly for current-quarter pipeline, monthly for next quarter. Teams with sales cycles under 90 days should use monthly or even weekly cadence - quarterly measurement is nearly meaningless when most deals get created and closed within the same month.
What's the difference between pipeline and forecast coverage?
Pipeline coverage measures what's possible: all open opportunities divided by target. Forecast coverage measures what's probable: committed and best-case deals divided by target. Pipeline is the broader number; forecast is tighter and more reliable. Tools like Clari help bridge the gap between the two.
How do you improve coverage without adding more deals?
Improve win rates through better qualification with MEDDIC or BANT. Clean stale deals from your CRM so the ratio reflects reality. Verify contact data before outreach so you're not building pipeline on contacts who'll never receive your emails. Focus reps on high-ICP accounts, which convert at meaningfully higher rates.