Positive Response Rate: Benchmarks and How to Improve It
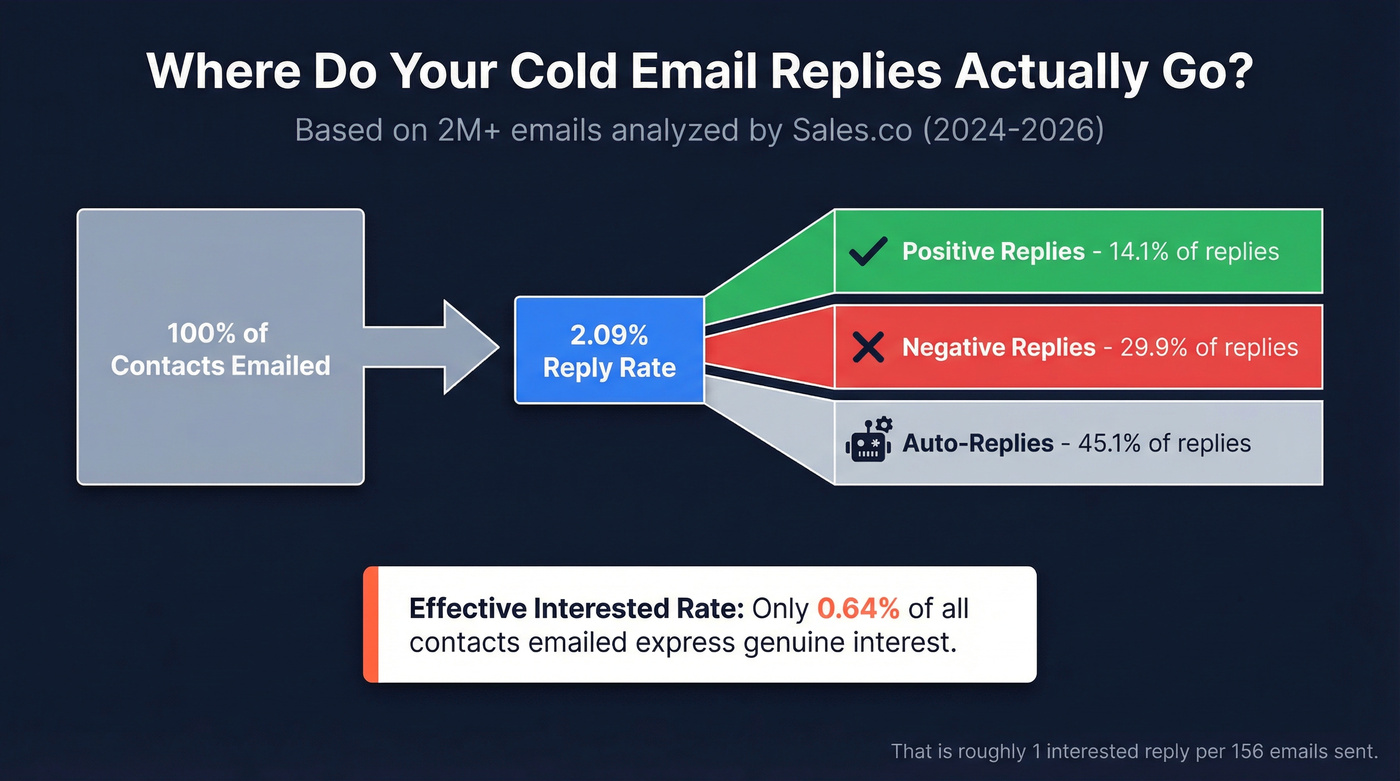
You sent 10,000 cold emails last month. You got 200 replies - until you realized only 28 expressed actual interest. The rest were auto-replies, "not interested," and "please remove me."
That gap between reply rate and positive response rate is where most outbound teams lose the plot. Only about 14.1% of cold email replies are genuinely positive, which translates to roughly 0.64% of all contacts emailed. In surveys, a "good" response rate runs 20-30%+. Let's break down the numbers.
What This Metric Actually Means
Most search results for this term use it in a survey or voice-of-customer sense. If you're in outbound sales, skip to the next section.
In sales outbound, positive response rate measures the percentage of replies expressing genuine interest - a meeting request, a pricing question, a referral to the right person. It's distinct from raw reply rate, which counts every response including "stop emailing me." Understanding the difference between reply rate vs positive reply rate is critical: a high reply rate can mask terrible results if most responses are negative or automated. We've seen teams celebrate a 5% reply rate that was 80% unsubscribes.
In surveys and VOC programs, people typically use the phrase to mean survey response rate) - how many people completed the survey out of those invited.
In clinical trials, response rate refers to measurable outcomes like tumor shrinkage. Different universe entirely.
Cold Email Benchmarks for 2026
Sales.co analyzed 2M+ cold emails across 1.37M contacts from 2024 through early 2026. The average reply rate was 2.09%. Of those replies, only 14.1% were positive, 29.9% were negative, and 45.1% were auto-replies. The effective interested rate across all contacts? Just 0.64%.
| Source | Dataset | Reply Rate | Positive Reply Rate | Effective Interested Rate |
|---|---|---|---|---|
| Sales.co | 2M+ emails (2024-early 2026) | 2.09% | 14.1% of replies | ~0.64% |
| Belkins | 16.5M emails across 93 domains | 5.8% | Not segmented | - |
| Instantly | Billions of interactions across thousands of workspaces | 3.43% avg | Not segmented | - |
Belkins' data shows reply rates dropped from 6.8% in 2023 to 5.8% in 2024 - a 15% year-over-year decline. Instantly's 2026 benchmark report puts the average at 3.43%, with the top 25% hitting 5.5%+ and the top 10% clearing 10.7%. The first email generates the vast majority of replies: 58% per Instantly's data, and up to 79% per Sales.co.
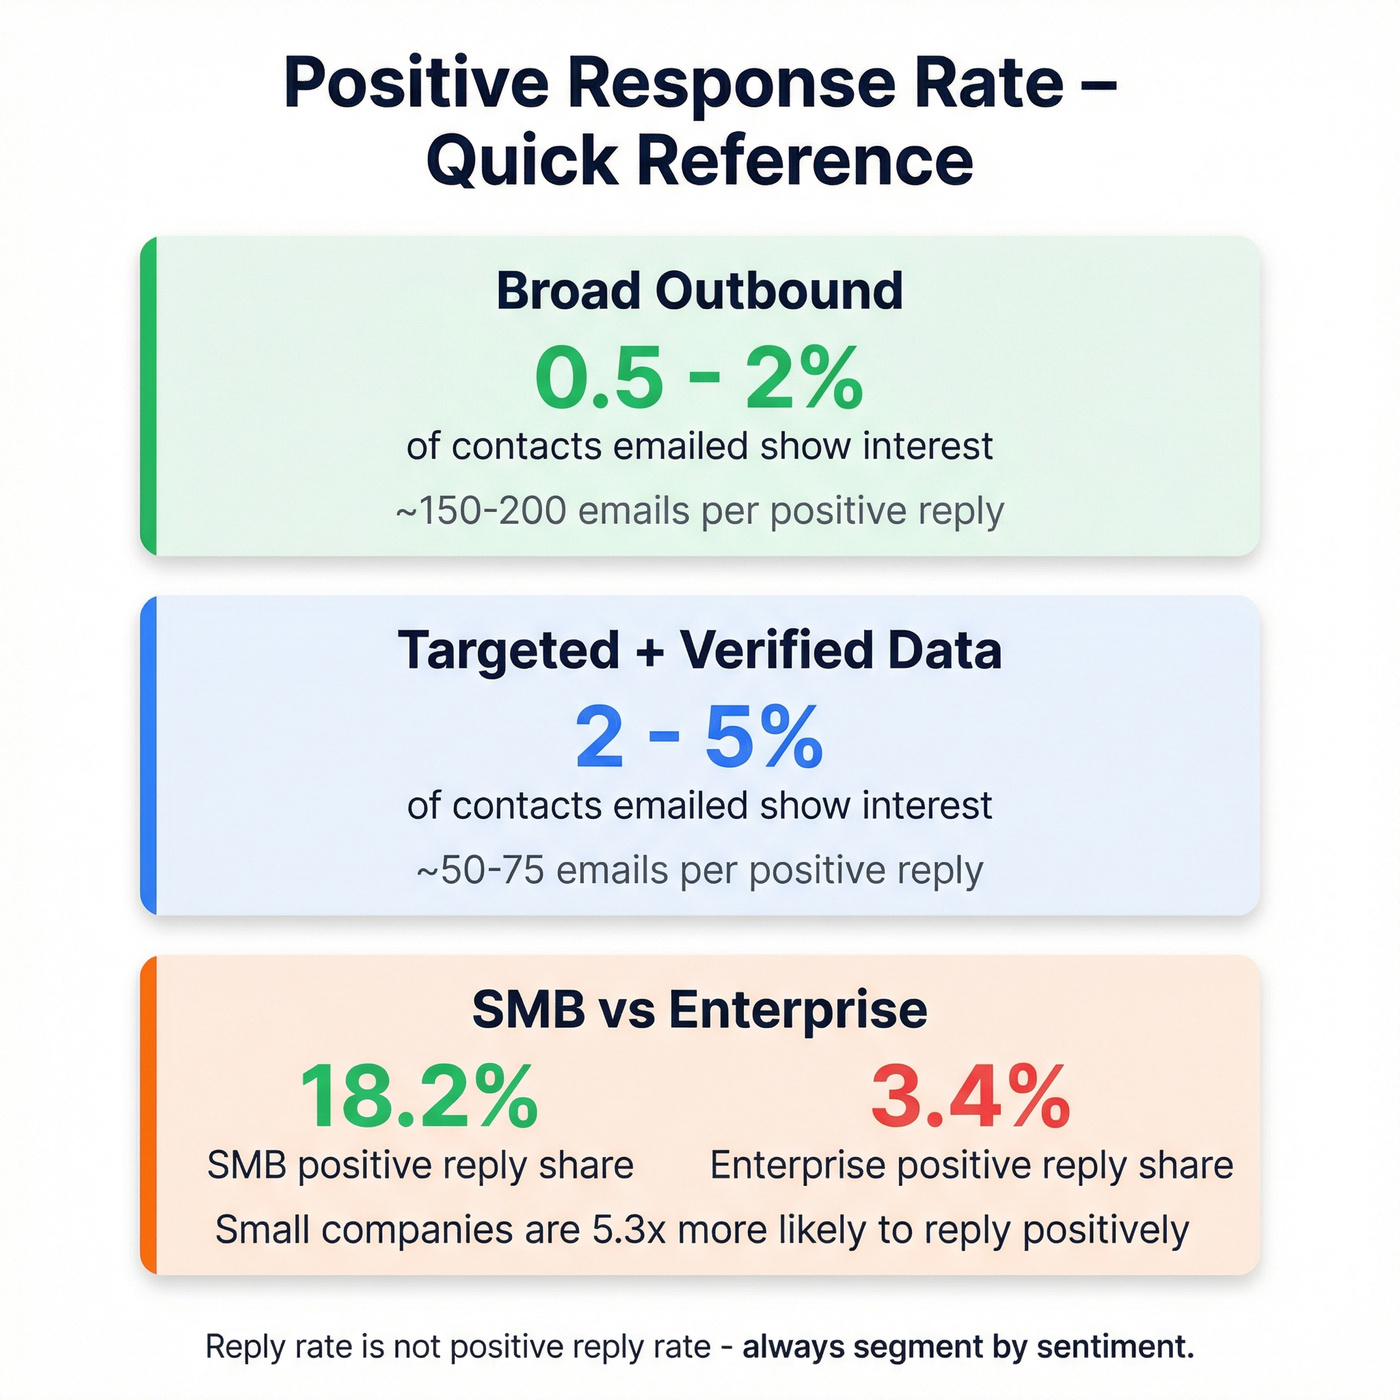
A typical practitioner range for positive rates is 0.5-2% of contacts emailed for broad outbound, which aligns with Sales.co's numbers. Working backward, most teams send roughly 150-200 emails per interested response when running untargeted campaigns.
The segment breakdown tells the real story:
| Company Size | % of Replies That Are Positive |
|---|---|
| SMB (1-10 employees) | 18.20% |
| Enterprise (10K+) | 3.43% |
Small companies are 5.3x more likely to reply positively than enterprises. In our experience, that gap widens further when you factor in multithreading and gatekeeper layers at large orgs. If you're prospecting into Fortune 500 accounts and wondering why your interested-reply rate is abysmal, this is why.
Here's the thing: most teams don't have a messaging problem. They have a targeting problem. A mediocre email sent to the right 500 people will outperform brilliant copy blasted to 10,000 loosely-matched contacts every single time.
You just saw the math: 150-200 emails per interested reply with untargeted lists. Prospeo's 30+ search filters and 98% email accuracy cut that to 50-75 by putting verified contacts in front of the right buyers. Snyk's bounce rate dropped from 35% to under 5% - and their pipeline jumped 180%.
Stop emailing dead inboxes. Start generating positive replies.
Why Reply Sentiment Matters More Than Volume
Most teams optimize for open rates and total replies when the only metric that actually matters is positive replies. Tracking reply sentiment forces you to confront the quality of your responses, not just the quantity.
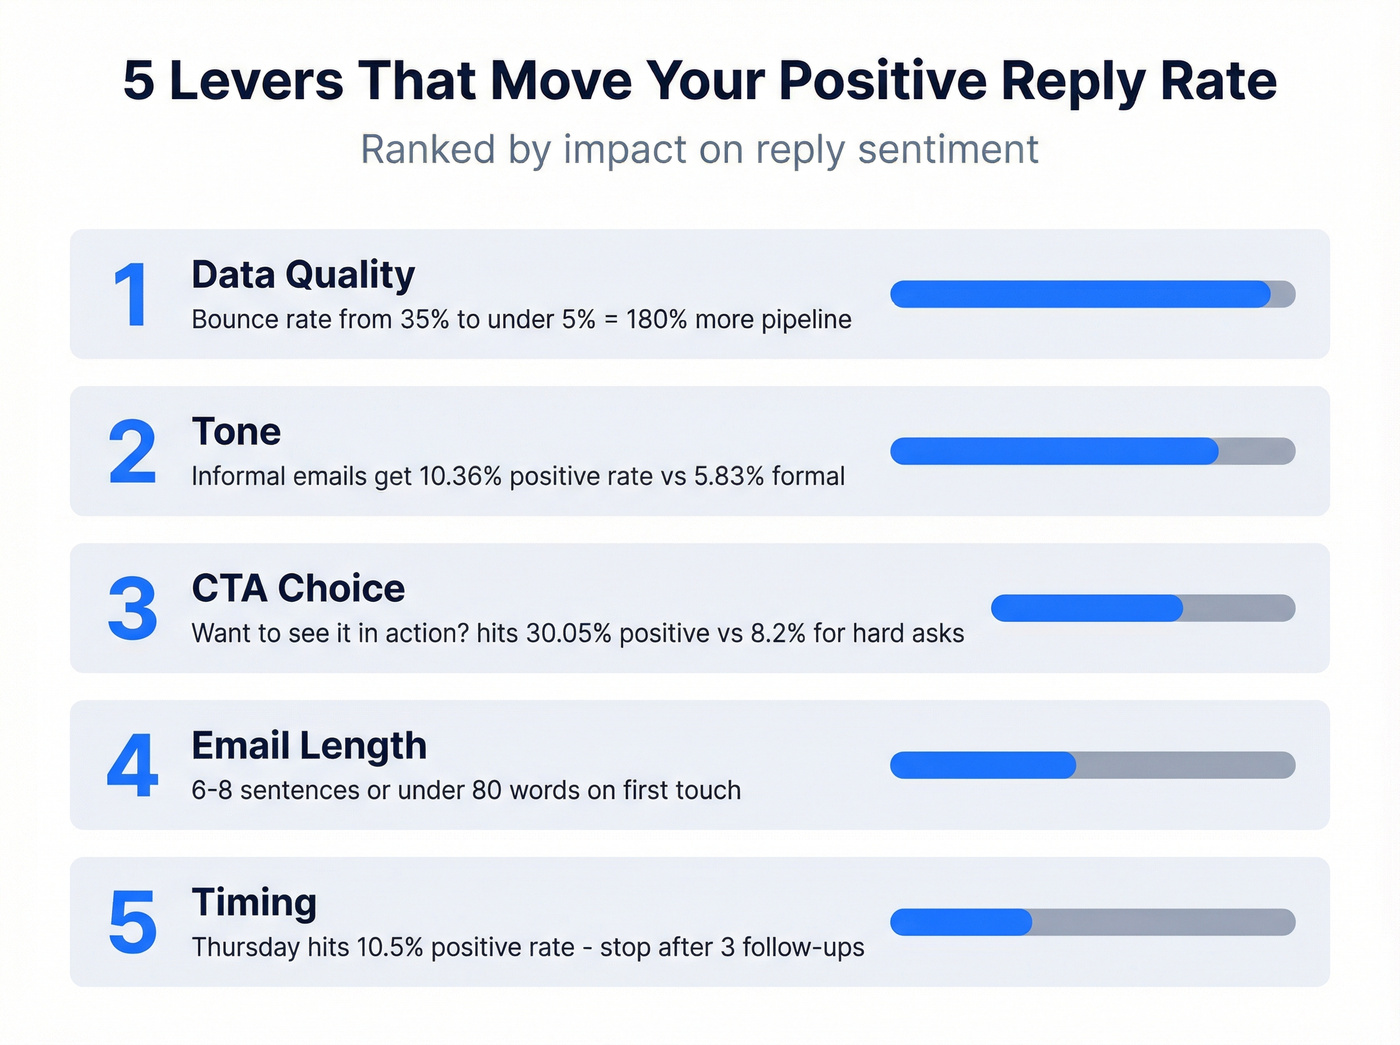
Here are the five levers that move that number, ranked by impact.
1. Data Quality
Bounced emails produce zero replies. We've seen teams running campaigns with 30%+ bounce rates wondering why their numbers look terrible - and the answer isn't their subject line or their offer, it's that a third of their list doesn't exist. Prospeo's 98% email accuracy and 7-day data refresh cycle eliminate dead contacts before they tank your metrics. Snyk cut their bounce rate from 35-40% to under 5% after switching, and their AE-sourced pipeline jumped 180%.

2. Tone
Informal emails generate a 10.36% positive reply rate versus 5.83% for formal ones - nearly double. Drop the corporate speak. (If you're still opening with "I hope this email finds you well," use these alternatives.)
3. CTA Choice
The phrase "Want to see it in action?" produced a 30.05% positive rate among replies in Sales.co's dataset. Soft, curiosity-driven CTAs crush hard asks. Compare that to "Are you available for a 15-minute call this week?" which landed at just 8.2%. The difference is massive, and it costs nothing to change.
4. Length
Belkins found 6-8 sentences hit a 6.9% reply rate. Instantly's top performers averaged under 80 words on the first touch. Shorter isn't always better, but bloated emails almost always underperform. If you want examples that stay tight, start with an outreach email template and adapt it to your ICP.
5. Timing
Thursday generates the highest positive rate at 10.5%. But don't over-follow-up - spam complaint rates climb from 0.5% on the first email to 1.6% by the fourth. Three follow-ups is the sweet spot for most sequences. After that, you're burning domain reputation for diminishing returns. (For a deeper breakdown, see the best time to send prospecting emails.)
Survey Response Rate Benchmarks
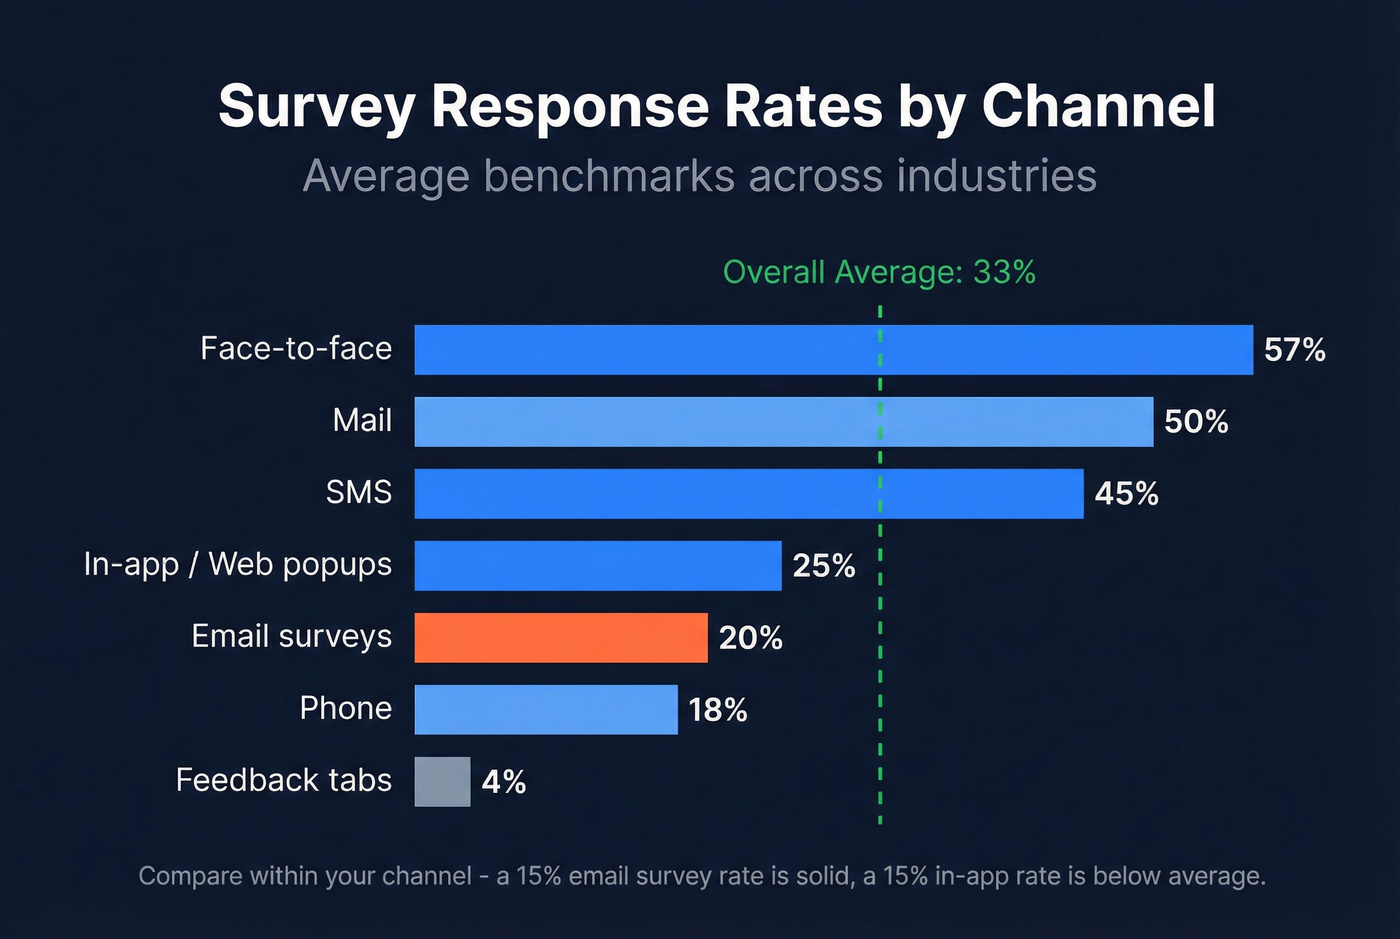
If you're on the survey side, the average response rate across all channels sits around 33%. That number hides massive variation by channel, though.
| Channel | Response Rate |
|---|---|
| Face-to-face | ~57% |
| ~50% | |
| SMS | 40-50% |
| In-app/web popups | 20-30% |
| 15-25% | |
| Phone | ~18% |
| Feedback tabs | 3-5% |
A Refiner study of 1,382 in-app surveys found an average response rate of 27.52%, with mobile apps outperforming web at 36.14% versus 26.48%. Many enterprises set a minimum threshold of 15-30% before trusting the data.
Compare within your channel and industry. A 15% email survey response rate is solid; a 15% in-app rate is below average.
FAQ
What's a good positive response rate for cold email?
About 14.1% of cold email replies are positive. In terms of contacts emailed, expect 0.5-2% for broad outbound. Tight ICP targeting with verified data can push that to 2-5%.
How is it different from reply rate?
Reply rate counts every response including auto-replies and unsubscribes. Positive response rate counts only interested replies. A 2% reply rate typically means just 0.3-0.5% are actually interested - that's why comparing reply rate vs positive reply rate is essential for honest reporting.
How many emails per positive response should I expect?
For broad, untargeted outbound, plan on 150-200 emails per interested reply. Tightly targeted campaigns with verified data and strong personalization can bring that down to 50-75. This is one of the most honest efficiency metrics in outbound - the consensus on r/coldemail is that anyone claiming better than 1 in 50 on cold lists is either lying or selling something.
How does email data quality affect results?
Every invalid address dilutes your positive response rate and damages sender reputation. Verifying contacts before sending ensures every email reaches a real inbox. Tools like Prospeo, Neverbounce, or ZeroBounce can keep bounce rates under 5% and protect your domain health.
Your positive response rate is a data quality problem disguised as a messaging problem. Prospeo refreshes 300M+ profiles every 7 days - not every 6 weeks like competitors. At $0.01 per verified email, cleaning up your pipeline costs less than one bounced campaign.
Every invalid email dilutes your positive reply rate to zero. Fix the source.