How to Size Your Potential Addressable Market (With Templates and Real Examples)
A reviewer who analyzed 82 pitch decks in four months found inadequate market analysis in 45 of them. That's 55% of founders walking into investor meetings with a TAM slide that actively hurts their credibility. Sizing your potential addressable market correctly isn't complicated - it's just rigorous.
What You Need (Quick Version)
"Potential addressable market" is TAM (Total Addressable Market) - Total Addressable Market - in plain English. No separate framework exists. If you're Googling this term, you're looking for the total revenue opportunity available if you captured 100% of your target market. You'll also see it called the potential available market. Same concept, same math.
Three things to know right now. First, use bottom-up analysis as your primary method - it's what investors trust. Second, cross-check it with a top-down estimate from industry reports. Third, if your two numbers diverge by more than 3x, one of them has a faulty input. Fix it before you put it in a deck.
What This Term Actually Means
Your potential addressable market is the total revenue you'd capture if every possible customer bought your product. It's the ceiling - theoretical, aspirational, and useful primarily as a framing device.
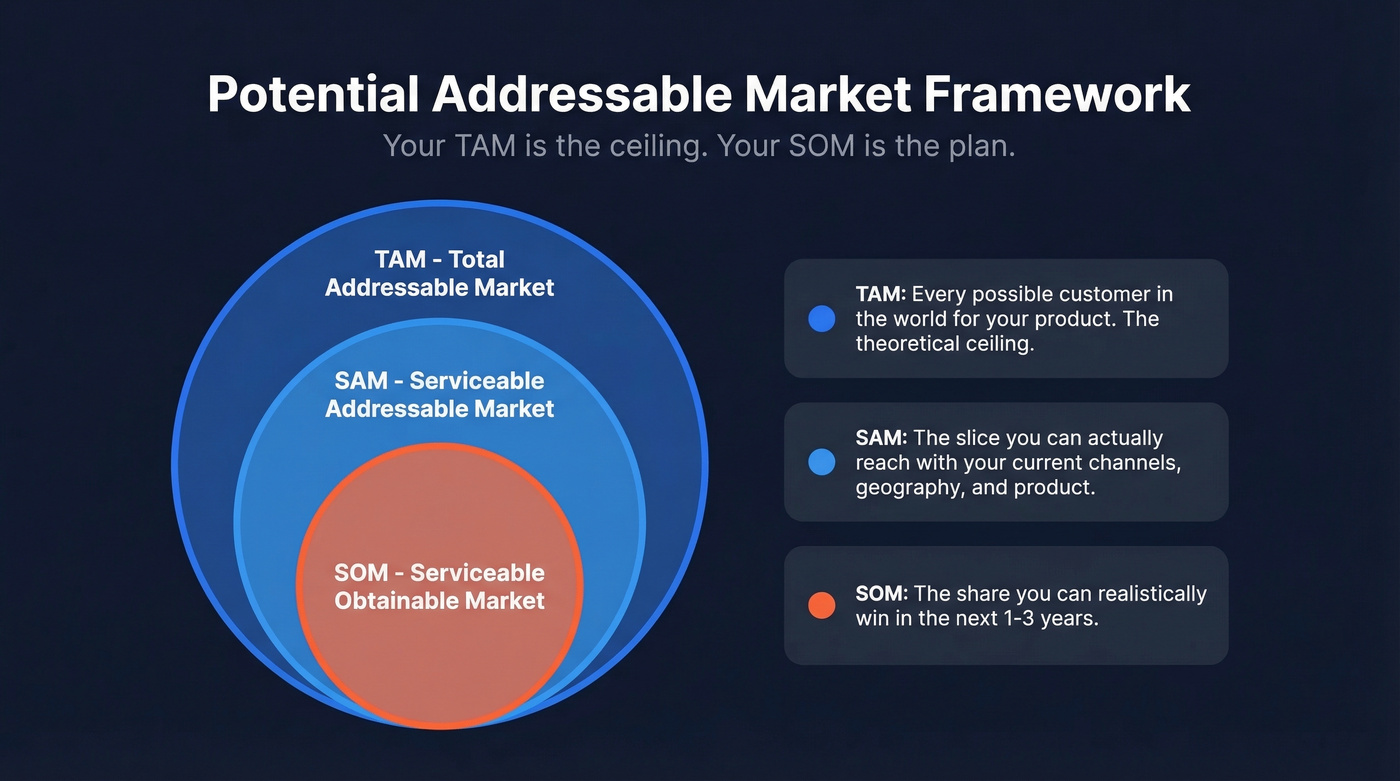
The standard framework breaks this into three layers. TAM (Total Addressable Market) is the entire market demand. SAM (Serviceable Addressable Market) is the slice you can actually reach given your geography, channels, and product capabilities. SOM (Serviceable Obtainable Market) is the share you can realistically capture in a given timeframe.
One lean planning framework puts it bluntly: TAM can be "a large and essentially useless number" if you don't narrow it down to SAM and SOM. The movie theater industry's TAM is technically everyone who watches movies. That tells you nothing about whether your indie cinema in Portland will survive.
There's no formal "PAM" metric distinct from TAM. When people search for "potential addressable market," they mean TAM. Every framework, template, and investor expectation maps to the same concept.
Why Your TAM Number Matters
Investors spend less than three minutes on your pitch deck. In that window, a sloppy TAM slide doesn't just get skipped - it poisons everything that follows.
That 82-deck review found "inadequate market analysis" in 45 decks - more than half. The specific complaint? Founders using top-down numbers and claiming "we just need 1% of the market." Investors see through that instantly.
Here's the thing: some investors argue TAM is fundamentally made up - "stitched together from random assumptions" and padded with adjacent markets. Their better questions: "Do people actually want this?" and "What new behavior could this unlock?" They're not entirely wrong. But the solution isn't to skip TAM. It's to build it from real data so it withstands scrutiny. A bottom-up TAM built from actual customer counts and pricing signals rigor. A top-down number pulled from a Statista chart signals laziness.
Three Ways to Calculate Your TAM
Every TAM model uses one of three approaches - or ideally, a combination.
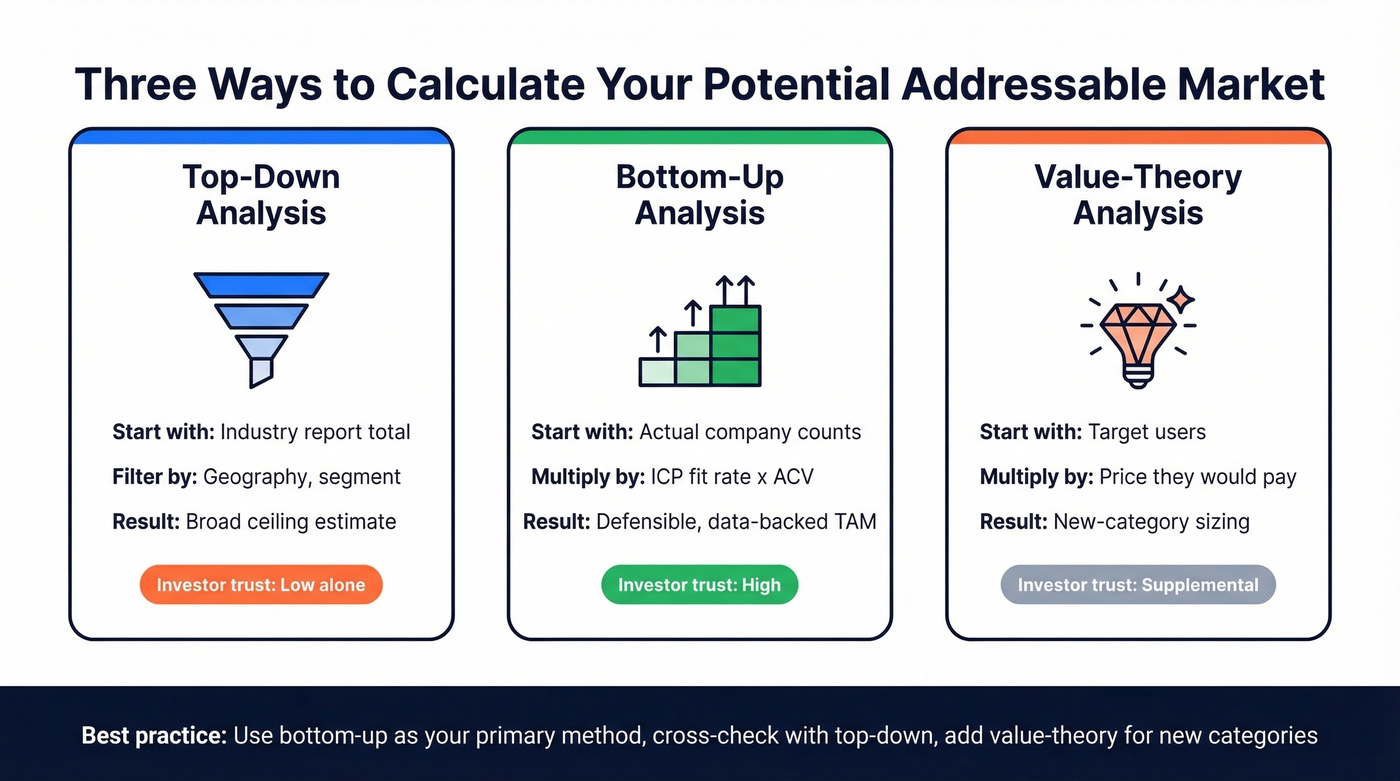
Top-Down Analysis
Start with a broad industry number and narrow it. This is fast, easy to source, and useful as a sanity check. It's also the method investors trust least when used alone.
The global SaaS market hit roughly $317.55B in 2024, grew to an estimated $390.50B in 2025, and is projected to reach $1.23T by 2032. Say you're building a CRM tool for mid-market companies. You'd take the global CRM market (approximately $100B), filter to mid-market (maybe 10% of spend), and land at a $10B TAM.
The problem? That $10B number feels big and impressive, but it's built on broad assumptions. You're trusting that "10% mid-market share" is accurate without validating it. Top-down is a starting point, not a destination.
Bottom-Up Analysis
This is where credibility lives.
You count actual potential customers, multiply by what they'd pay, and arrive at a TAM grounded in observable reality. A worked example from IdeaPlan: start with 14,000 companies in your target category. Apply an ICP fit rate of 65% - that gives you 9,100 addressable companies. Multiply by an expected ACV of $48,000. Your bottom-up TAM: $436.8M.
The hard part is getting that initial company count. We've seen this frustration firsthand, and it shows up constantly on r/startups - one poster in outdoor consumer hardware could find "loose data" on the global equipment market but couldn't find segment-level customer counts for a bottom-up calculation. Without published research for your niche, you need to get creative with data sources (more on that below).
Teams who invest the time in bottom-up analysis close funding rounds faster because they can defend every assumption in the model.
Value-Theory Analysis
This approach sizes the market based on the value your product delivers rather than existing spend. It's useful for genuinely new categories where no incumbent market exists to measure.
The formula: number of target users x realistic price point x time period = TAM. If 10,000 potential users would pay $100/month, your annual TAM is $12M. Value-theory works best as a supplement to bottom-up, not a replacement. Use it when you're creating a category; use bottom-up when you're entering one.
Reconciling Your Estimates
Your top-down and bottom-up numbers will almost never match. That's expected. The question is how far apart they are.
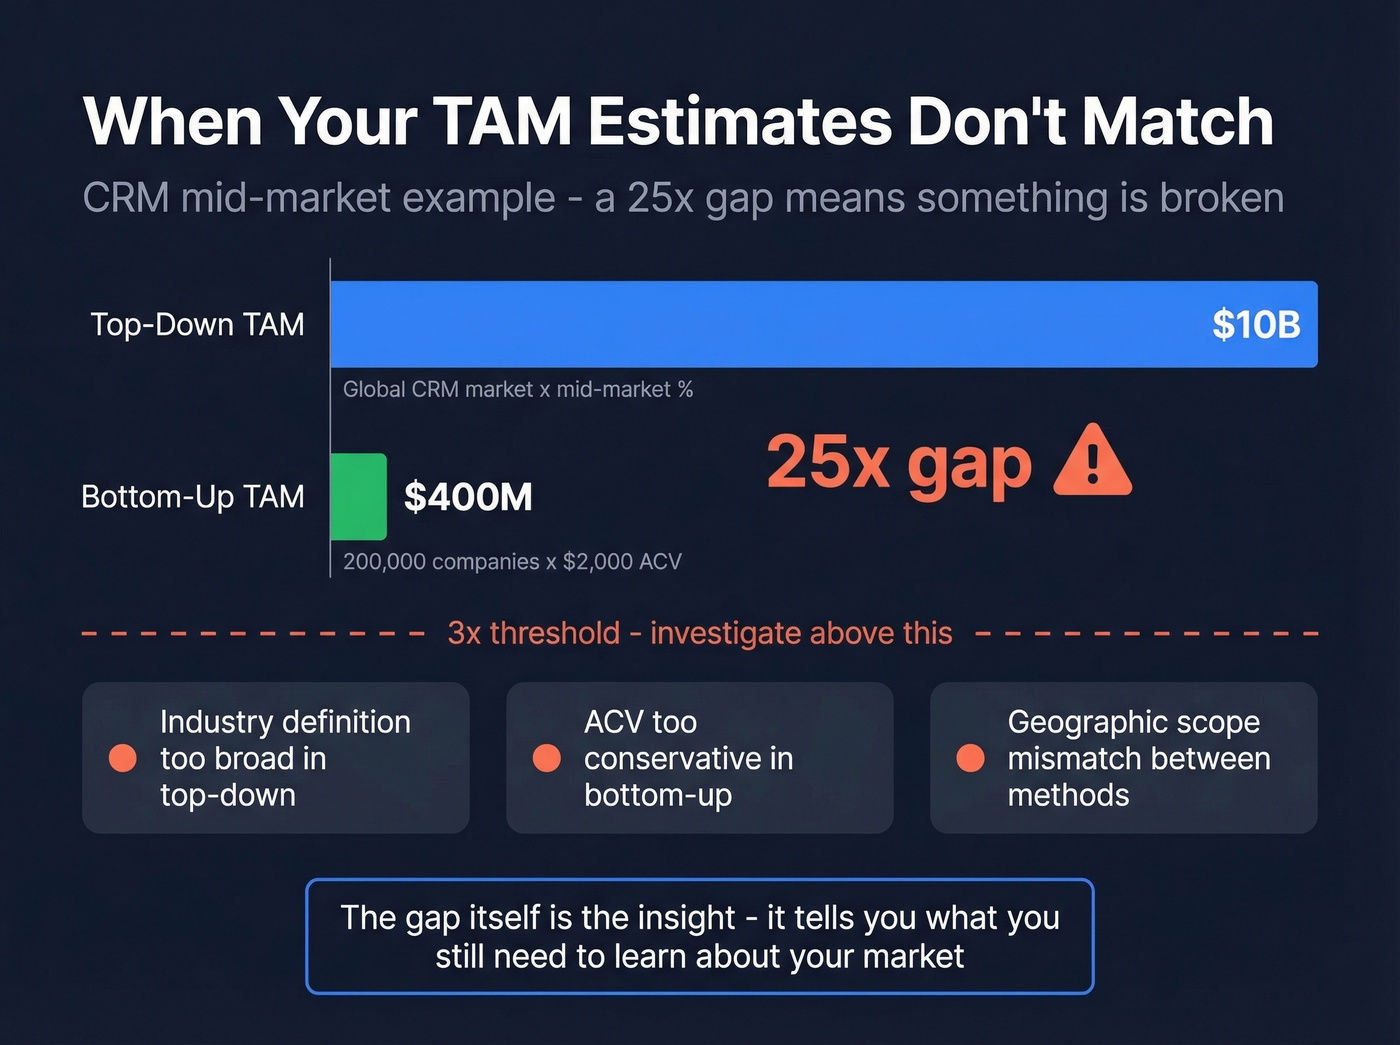
Take the CRM example from one analysis at Olympus Intel. Top-down gives you $10B (global CRM x mid-market percentage). Bottom-up gives you $400M (200,000 target companies x $2,000 average contract). That's a 25x gap - a massive red flag that one method has a broken input.
If your estimates diverge by more than 3x, stop and revisit your assumptions. Common culprits include an overly broad industry definition in the top-down model, an ACV that's too conservative in the bottom-up, or a geographic scope mismatch between the two. The reconciliation process itself is where the real insight lives - the gap tells you what you don't understand about your market yet.
Bottom-up TAM requires actual company counts and ICP-fit data - not loose estimates from industry reports. Prospeo's database of 300M+ profiles with 30+ filters (industry, headcount, revenue, technographics, funding) lets you count exactly how many companies match your ICP and validate your ACV assumptions with real data.
Build a defensible TAM from real prospect data, not Statista charts.
Build Your TAM Model
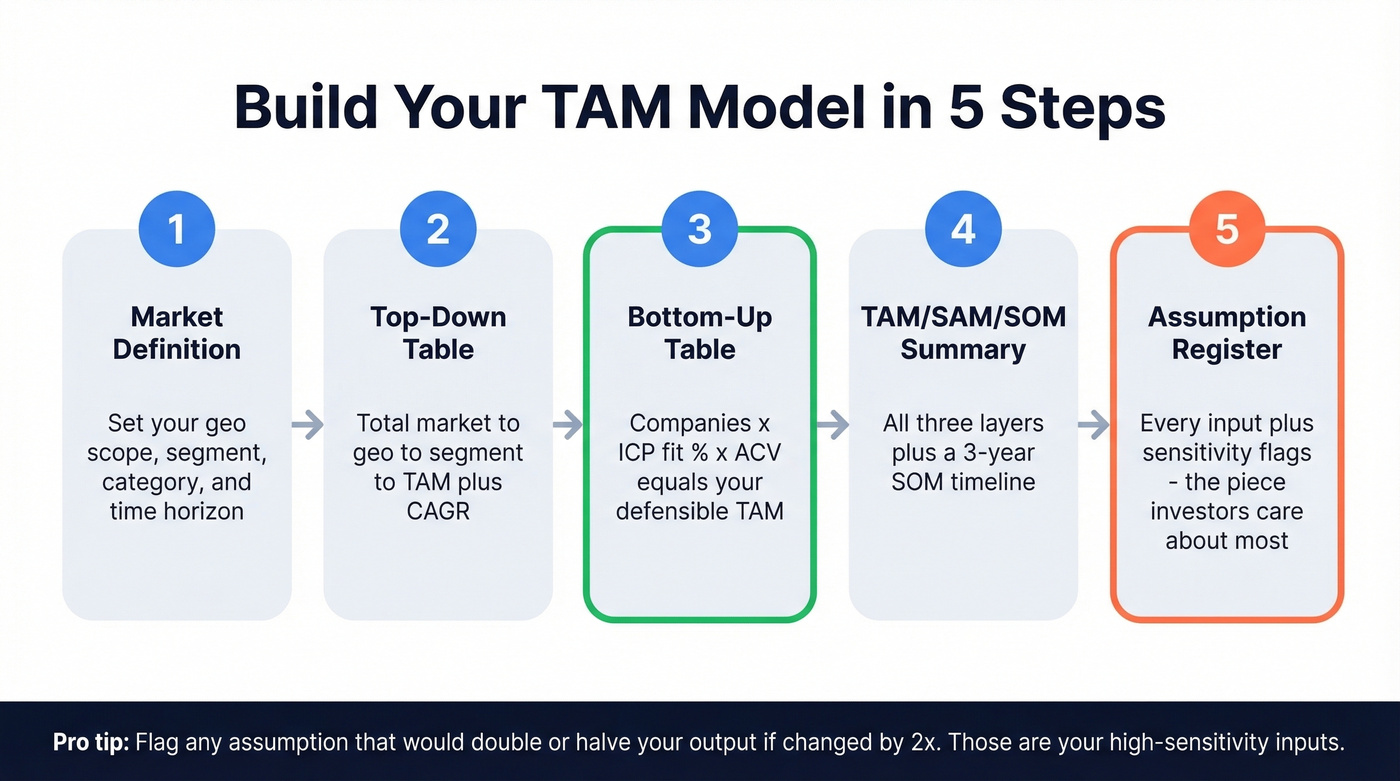
A solid TAM spreadsheet needs five components:
| Component | What It Contains | Why It Matters |
|---|---|---|
| Market Definition | Geo scope, segment, category, time horizon | Keeps both methods aligned |
| Top-Down Table | Total market → geo → segment → TAM + CAGR | Quick ceiling estimate |
| Bottom-Up Table | Companies x ICP fit % x ACV = TAM | Investor-ready detail |
| TAM/SAM/SOM Summary | All three layers + 3-year SOM timeline | Shows you understand scale |
| Assumption Register | Every input + sensitivity flag | Builds credibility |
The assumption register is the piece most founders skip - and it's the piece investors care about most. Flag any assumption that, if changed by 2x, would double or halve your output. Those are your high-sensitivity assumptions, and you need to be ready to defend them.
If your ACV assumption is $48,000 but could realistically range from $24,000 to $72,000, document it, explain your reasoning, and show what the TAM looks like at each end of the range. This transparency separates a credible model from a fantasy.
Copy-Paste Starter Template
Paste this into a spreadsheet and fill in your own numbers:
| Input | Your Value | Source | Sensitivity |
|---|---|---|---|
| Total companies in category | _____ | Census / B2B database | Medium |
| ICP fit rate (%) | _____ | Internal analysis | High |
| Addressable companies (row 1 x row 2) | _____ | Calculated | - |
| Average contract value (ACV) | $_____ | Pricing model / comps | High |
| Bottom-Up TAM (row 3 x row 4) | $_____ | Calculated | - |
| Top-down industry size | $_____ | Analyst report | Low |
| Geo/segment filter (%) | _____ | Report + judgment | Medium |
| Top-Down TAM (row 6 x row 7) | Calculated | Calculated | - |
| Divergence ratio (row 8 / row 5) | _____x | Calculated | - |
| SAM (% of TAM reachable now) | _____ | Channel + geo analysis | Medium |
| SOM (Year 1 realistic capture) | _____ | Traction data / comps | High |
If the divergence ratio exceeds 3x, revisit your inputs before presenting to anyone.
Early-Stage Simplified Version
Pre-revenue founders who lack pricing data can use a stripped-down model: count your ICP companies, estimate a conservative ACV based on competitor pricing, and multiply. Skip the top-down entirely - you don't have the credibility to present a $50B number when you have zero customers. Lead with a tight bottom-up SOM and expand the story as you gain traction.
Where to Get TAM Input Data
The biggest bottleneck in market sizing isn't the math - it's finding reliable inputs.
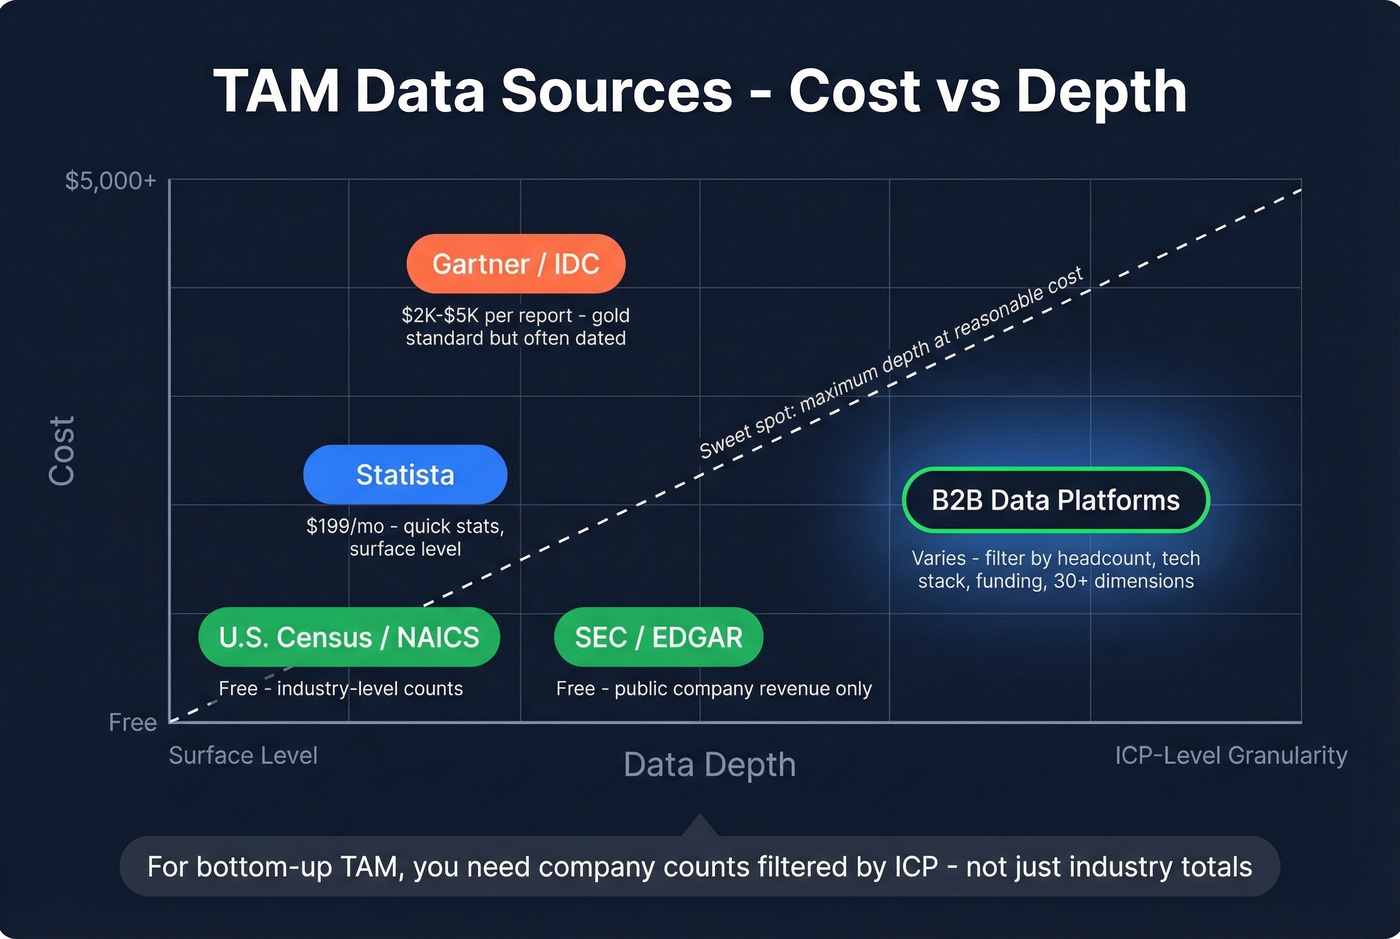
Free sources. U.S. Census and NAICS data give you industry-level company counts and revenue by sector. SEC/EDGAR filings provide public company revenue data. G2 category pages are underrated - they show you competitor counts, customer types, and market segment boundaries for free. All three are authoritative but lack granular ICP filtering.
Paid reports. Statista typically costs around $199/month and offers quick market-size stats but stays surface-level. Gartner and IDC reports run $2,000-$5,000+ per report and are the gold standard for industry forecasts, though they're often dated by the time they're published. One useful sanity check for SaaS models: the average enterprise runs 371 SaaS apps with roughly $9,643 in SaaS spend per employee - but 25-30% of those licenses go unused, representing roughly $45B in global waste. Factor that into your willingness-to-pay assumptions.
| Source | Cost | Best For | Limitation |
|---|---|---|---|
| U.S. Census / NAICS | Free | Industry-level sizing | No ICP filtering |
| SEC / EDGAR | Free | Public company revenue | Public companies only |
| Statista | ~$199/mo | Quick market stats | Surface-level data |
| Gartner / IDC | $2K-$5K+/report | Industry forecasts | Expensive, often dated |
| B2B data platforms | Varies | Bottom-up company counts | B2B-specific |
B2B data platforms. For bottom-up TAM, you need to count companies matching your ICP - not just by industry, but by headcount, tech stack, funding stage, and buying signals. Platforms like Prospeo solve this by letting you filter across 30+ dimensions, far beyond broad industry codes. Export the count, multiply by your ACV, and your bottom-up TAM is built from real data instead of guesswork.

Ten TAM Mistakes That Kill Credibility
The fatal five. Over-relying on top-down analysis without bottom-up validation. Ignoring geographic restrictions - legislation, logistics, and local policy can make entire regions unreachable. Generalizing your target demographic ("all SMBs" isn't a segment). Overlooking product limitations by claiming the whole category when your tool solves a niche problem. And using outdated data - a 2021 market report doesn't reflect a 2026 market.
The credibility killers. Assuming 100% market share - nobody captures their entire TAM, ever. Ignoring price sensitivity by using a single ACV assumption instead of a demand curve. Confusing TAM, SAM, and SOM, which signals you don't understand your own market.
The ongoing failures. Treating TAM as a one-time exercise when markets shift, competitors enter, and your product evolves - update quarterly. And inflating TAM to impress investors, which backfires during due diligence every single time.
Let's be honest: if your deal sizes are sub-$10K and your ICP is "all businesses," you don't have a TAM problem - you have a positioning problem. The founders who nail market sizing are the ones who've already made hard choices about who they're not selling to.
We've watched this play out with a client's competitor: an AI-driven CRM startup inflated its TAM using only top-down analysis, ignored competitive constraints, spent broadly across an oversized market, and watched CAC spiral while investor confidence eroded. A bottom-up validation would've revealed a smaller but attainable initial market - and a far more efficient go-to-market strategy.
How to Present TAM to Investors
Investors don't want a big number. They want a defensible one.
Avoid the "1% of a global market" logic. In the 82-deck review, the explicit advice was: "PLEASE don't use the top-down market approach; don't say you'll conquer 1% of the TAM." With less than three minutes per deck, you get one shot at credibility.
What a good TAM slide contains: a bottom-up TAM number with the calculation visible, assumption footnotes with sensitivity flags, a SAM/SOM progression showing your 3-year path, and early traction data proving demand exists. Even a handful of LOIs or pilot customers transforms a theoretical number into evidence.
What investors actually respond to is a clear path from SOM to SAM over time, evidence you've pressure-tested the model, and the honesty to show what you don't know yet. The consensus on r/startups is that TAM feels "wishy-washy" without published research - but a well-built bottom-up model with transparent assumptions is the opposite of wishy-washy. It's the strongest signal you can send that you understand your business.
From TAM to Prospect List
Stop obsessing over TAM. Your SOM is the only number that matters for the next 12 months.
Once you've sized your potential addressable market, the companies in your SOM aren't abstract entries in a spreadsheet - they're real businesses with real decision-makers. The gap between "I know my addressable market is 9,100 companies" and "I have verified contact information for the VP of Sales at each one" is where most teams stall. In our experience, that's the exact moment when a market-sizing exercise either turns into pipeline or collects dust in a Google Sheet.
That r/startups poster who couldn't find segment-level customer counts? Prospeo solves that. Filter by department headcount, tech stack, headcount growth, and revenue to isolate your exact addressable segment - then export verified contacts at $0.01/email to start validating willingness to pay.
Turn your TAM slide from a guess into a data-backed number investors trust.
FAQ
Is potential addressable market the same as TAM?
Yes. "Potential addressable market" is plain-language for Total Addressable Market. No widely accepted framework treats PAM as a separate metric; both terms describe the total revenue opportunity if you captured every possible customer in your target segment.
Which TAM method do investors prefer?
Bottom-up analysis. It signals rigor because it's built from real customer counts and actual pricing, not top-line industry reports. Cross-check with a top-down estimate, but always lead with bottom-up in your pitch deck.
How often should I update my TAM?
At least quarterly. Markets shift, competitors enter, and your product evolves. A stale TAM misleads resource allocation and erodes investor confidence during follow-on rounds.
What's the biggest TAM mistake founders make?
Using a massive top-down number and claiming "we just need 1% of the market." Investors flagged this in 55% of decks in one analysis and immediately discount the entire pitch.
How do I count companies in my addressable market?
Use B2B data platforms with granular filters - industry, headcount, tech stack, funding stage. Export matching company counts directly, then multiply by your ACV for a defensible bottom-up input.