Reducing Churn in SaaS: 2026 Benchmarks & Playbook
You're in the board meeting. The slide says 2.5% monthly churn, and someone multiplies by 12 to get 30% annual. Except that's wrong - the compounding formula puts it at 26.6%. A 3.4-point error that changes whether the board sees a fixable problem or a burning building.
And that's just the first measurement mistake most SaaS teams make.
With new sales dropping 3.3% in recent SaaS market reports, retention isn't just a CS metric anymore - it's the primary growth lever. Reducing churn by even one point compounds into revenue you don't have to re-sell. But you can't fix what you're measuring wrong, and most teams are measuring wrong in at least two ways.
The Short Version
Fix measurement first. Most teams run blended churn rates across segments, don't split voluntary from involuntary, and use monthly x 12 instead of the compounding formula. Until you fix that, every retention strategy you build sits on bad math.
Your highest-ROI fix is probably involuntary churn. Hybrid dunning - intelligent retries plus email sequences - recovers 80-90% of failed payments at 30 days, compared to 50-60% for email-only. That's revenue you're leaving on the floor with zero product changes required.
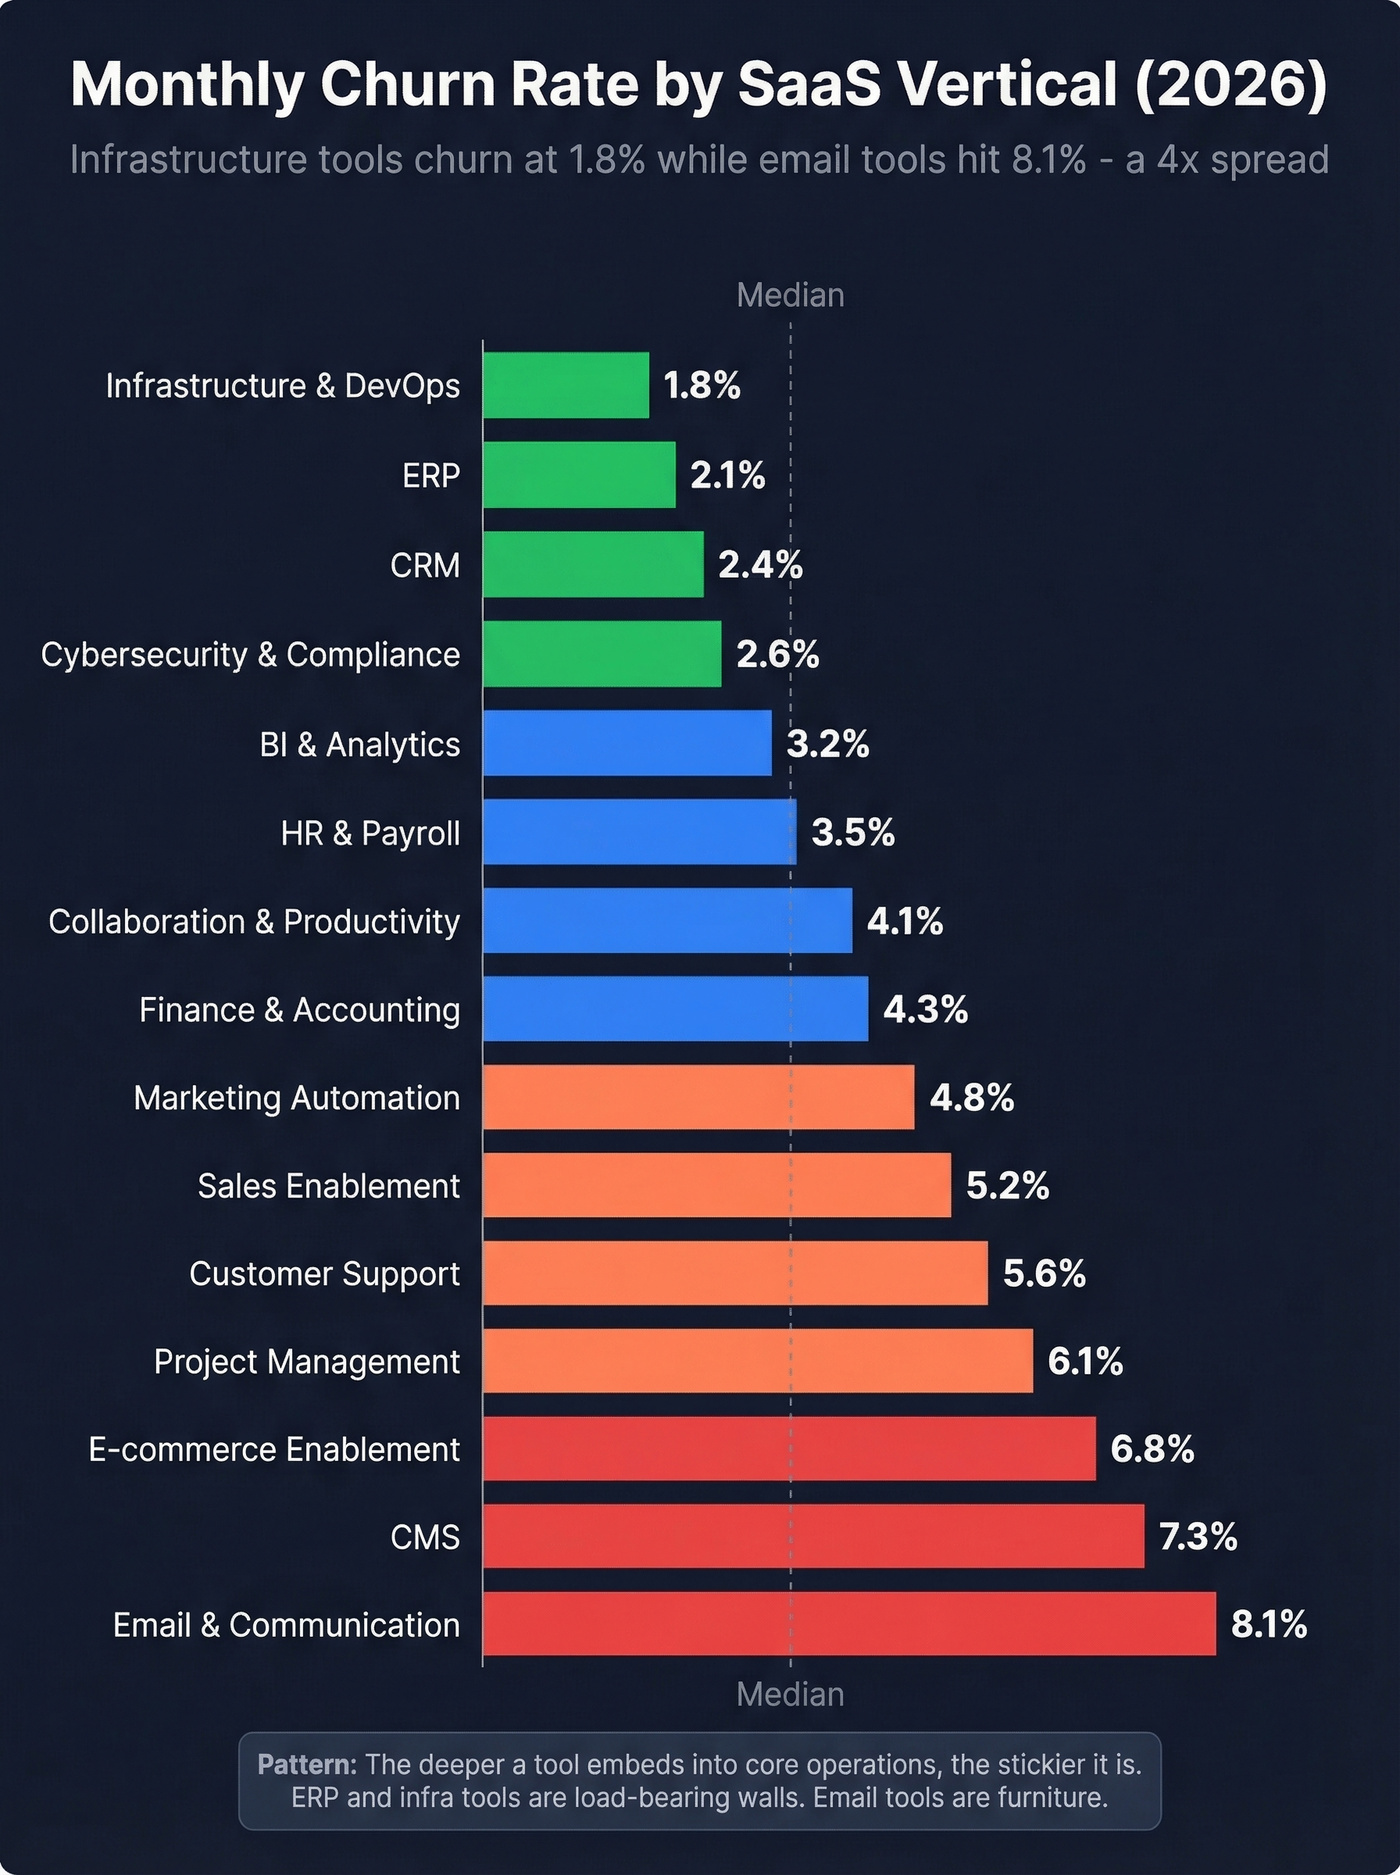
"Average" churn is meaningless without context. Monthly churn ranges from 1.8% for Infrastructure SaaS to 8.1% for Email Tools - a 4x spread. Know your vertical, your stage, and your segment before you benchmark.
2026 SaaS Churn Benchmarks
Most churn articles hand you a single number and call it a day. That's useless. Churn varies dramatically by vertical, company stage, pricing model, ARPU, and customer segment.
By Vertical
The spread here is enormous. Infrastructure tools that become deeply embedded in workflows churn at a fraction of the rate of easily-replaceable email tools.
| Vertical | Monthly | Annual |
|---|---|---|
| Infrastructure & DevOps | 1.8% | 19.8% |
| ERP | 2.1% | 22.9% |
| CRM | 2.4% | 25.6% |
| Cybersecurity & Compliance | 2.6% | 27.8% |
| BI & Analytics | 3.2% | 32.8% |
| HR & Payroll | 3.5% | 35.9% |
| Collaboration & Productivity | 4.1% | 40.7% |
| Finance & Accounting | 4.3% | 42.5% |
| Marketing Automation | 4.8% | 46.1% |
| Sales Enablement | 5.2% | 49.4% |
| Customer Support | 5.6% | 52.1% |
| Project Management | 6.1% | 55.6% |
| E-commerce Enablement | 6.8% | 59.4% |
| CMS | 7.3% | 62.9% |
| Email & Communication | 8.1% | 67.2% |
The pattern is clear: the deeper a tool embeds into a company's core operations, the stickier it is. ERP and infrastructure tools become load-bearing walls. Email tools are furniture - easy to swap.
By Company Stage
Your stage determines not just your churn rate but why customers leave.
| Stage | ARR Range | Monthly | Annual | Primary Driver |
|---|---|---|---|---|
| Pre-PMF | <$1M | 8.2% | 67.8% | PMF misalignment |
| Early-stage | $1-5M | 5.7% | 52.3% | Under-resourced CS |
| Growth | $5-20M | 3.9% | 39.1% | Competitive gaps |
| Scale-up | $20-50M | 2.8% | 29.4% | Renewal pricing |
| Established | $50M+ | 1.9% | 21.0% | Budget cuts |
Pre-PMF companies churning at 8.2% monthly aren't facing a retention problem - they're facing a product-market fit problem. No amount of dunning optimization fixes that. Skip the retention stack if you're in that zone. The "churn strategy" is a product strategy.
By Pricing Model
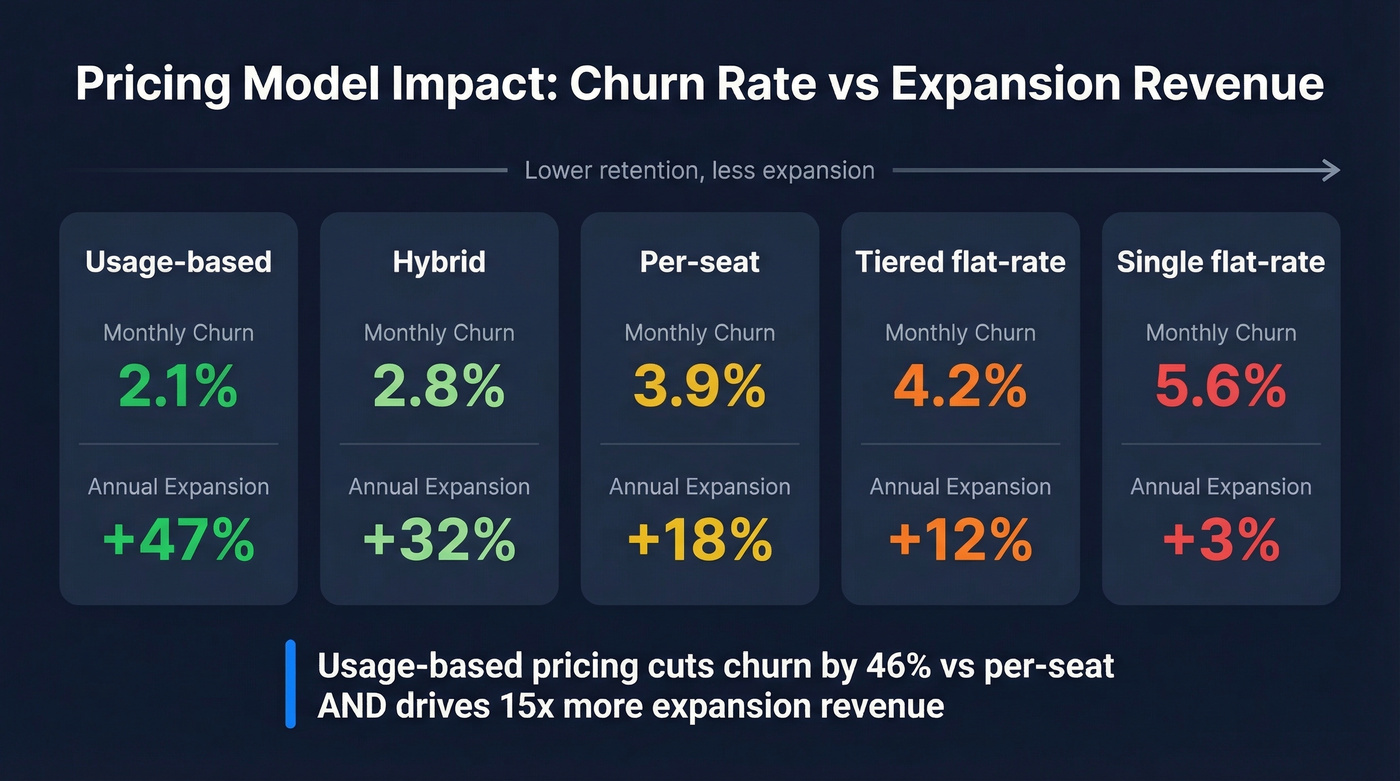
Usage-based pricing doesn't just align incentives - it cuts attrition rates by 46% compared to per-seat models (2.1% vs 3.9% monthly).
| Pricing Model | Monthly | Annual | Annual Expansion |
|---|---|---|---|
| Usage-based | 2.1% | 22.9% | +47% |
| Hybrid | 2.8% | 29.4% | +32% |
| Per-seat | 3.9% | 39.1% | +18% |
| Tiered flat-rate | 4.2% | 41.8% | +12% |
| Single flat-rate | 5.6% | 52.1% | +3% |
The expansion revenue difference is even more dramatic than the churn gap: +47% versus +3%. When customers pay for what they use, they don't cancel because they feel overcharged - they scale naturally.
By ARPU
Here's a counterintuitive finding: mid-range ARPU accounts churn the hardest on revenue churn.
| ARPU Range | Revenue Churn |
|---|---|
| Under $10/mo | 6.7% |
| $10-$25/mo | 6.9% |
| $25-$50/mo | 8.6% |
| $50-$100/mo | 7.3% |
| $100-$250/mo | 7.8% |
| Over $250/mo | 6.5% |
The $25-$50 ARPU band sits at 8.6% revenue churn - the worst in this table. These accounts are expensive enough that customers scrutinize the bill, but cheap enough that the product hasn't become mission-critical. If your average deal lands in that dead zone, you need to either drive deeper adoption or push pricing into a stickier tier.
By Customer Segment
The segment-level view is where blended averages really fall apart:
- SMB: 3-5% monthly
- Mid-market: 1.5-3% monthly
- Enterprise: 1-2% monthly
- Best-in-class across segments: <1% monthly
If you're running a blended 3.5% and your book is 70% SMB, your enterprise churn might be excellent while your SMB churn is bleeding you dry. You'd never know without splitting the segments.
Remember the compounding formula: Annual churn = 1 - (1 - monthly)^12. A 3% monthly rate isn't 36% annual - it's 30.6%. A 5% monthly rate isn't 60% - it's 46.0%. The gap between the two methods grows larger at higher churn rates, making accurate calculation non-negotiable for board-level reporting.
Churn Metrics That Actually Matter
Logo churn - how many customers left - and revenue churn - how much MRR they took with them - are different numbers that tell different stories. Losing 2% of customers can mean 5% revenue churn if your highest-value accounts are the ones walking.
The two metrics that matter most at the board level are NRR and GRR.
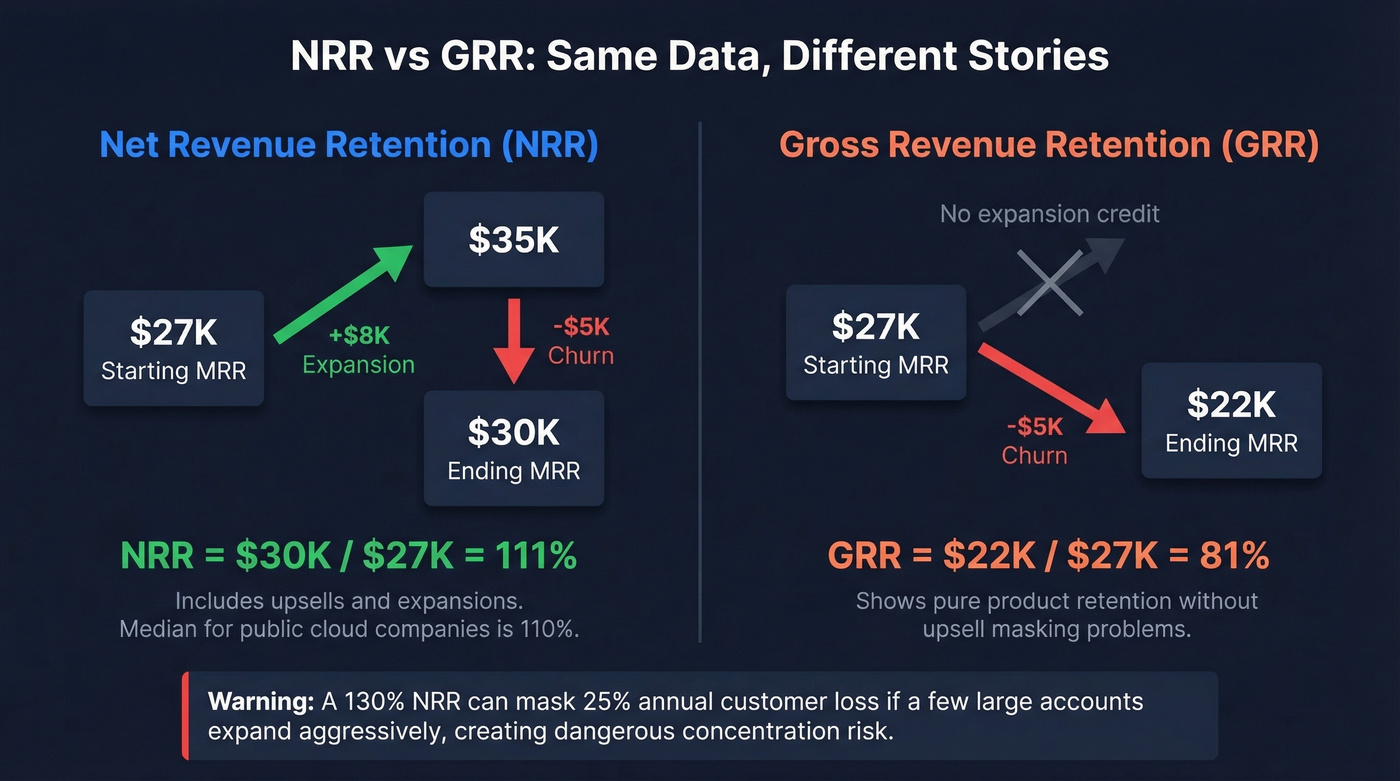
Net Revenue Retention (NRR) includes expansion revenue. Worked example: start with $27K MRR, upsell to $35K, lose $5K to churn. NRR = $30K / $27K = 111%. The median NRR for public cloud companies that report it is 110%.
Gross Revenue Retention (GRR) strips out expansion. Same numbers: $27K start, $5K churn, no expansion credit. GRR = $22K / $27K = 81%. GRR shows you how well your product retains revenue on its own, without the upsell team papering over cracks.
Here's the danger of over-indexing on NRR: a 130% NRR can mask the fact that you're losing 25% of your customer base annually while a handful of large accounts expand aggressively. That creates 40-50% customer concentration risk - the kind of thing that makes investors nervous and makes your revenue fragile.
Then there's net negative churn - the holy grail. If you churn $15K MRR but expand existing accounts by $20K, your net churn is -$5K. Your existing customer base is growing without a single new logo. That's the compounding engine that separates great SaaS businesses from good ones.
Measurement Mistakes That Sabotage Retention
Five anti-patterns we see repeatedly:
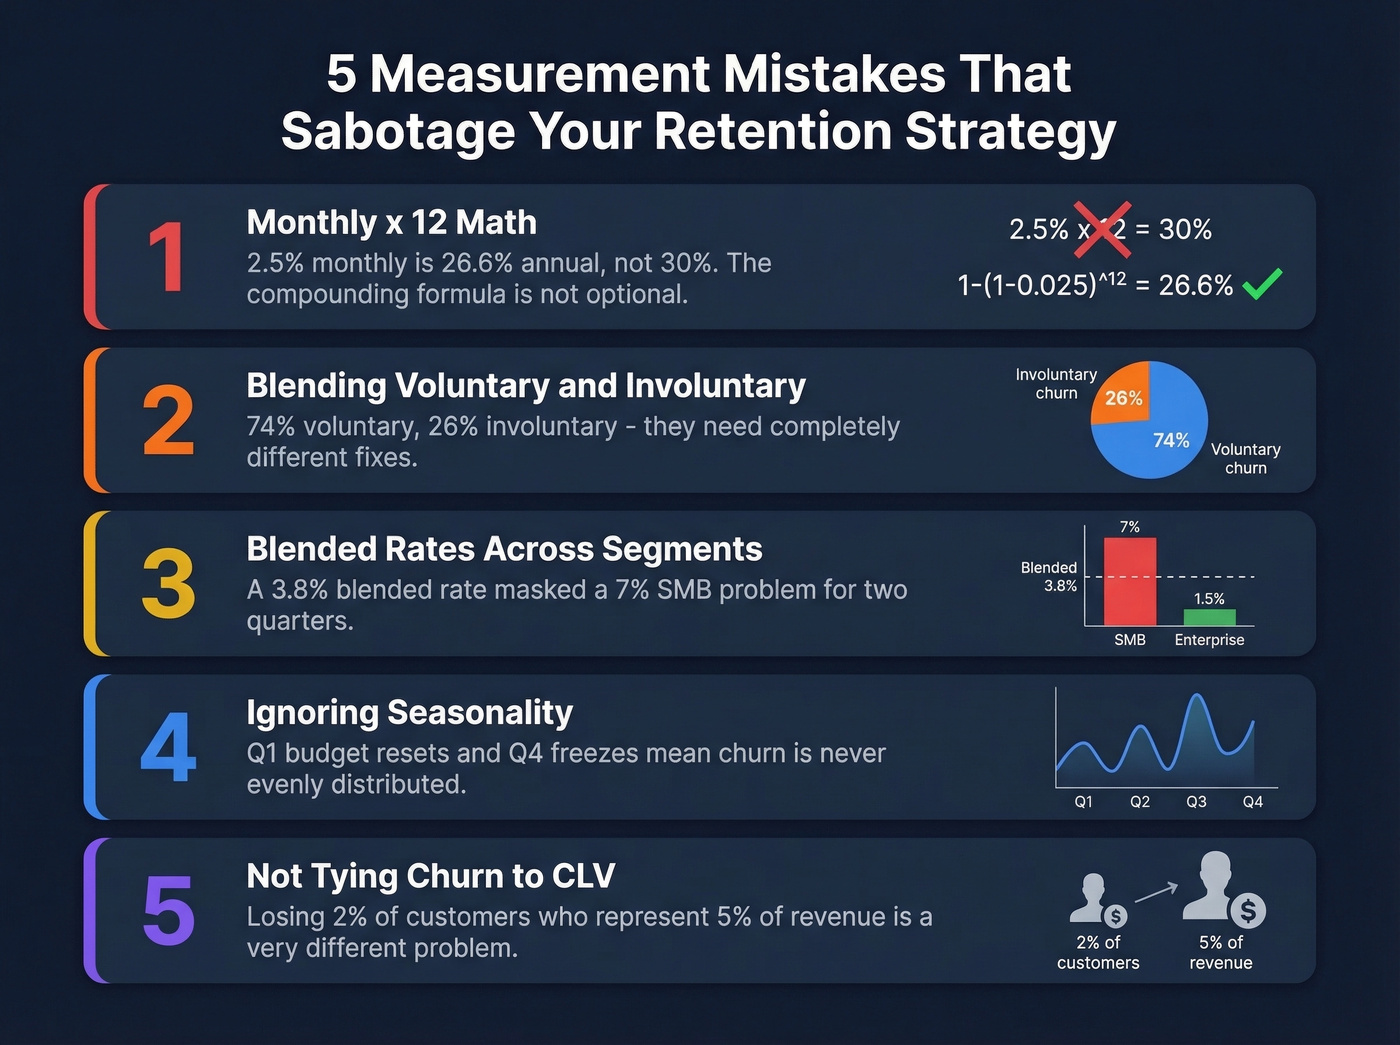
1. Monthly x 12. We covered this, but it bears repeating. 2.5% monthly is 26.6% annual, not 30%. The compounding formula isn't optional - it's math.
2. Not splitting voluntary from involuntary. The median split is roughly 74% voluntary / 26% involuntary. These require completely different interventions. Lumping them together means your strategies are probably ignoring the easiest wins.
3. Blended rates across segments. A CS leader at a $15M ARR SaaS once told us their blended 3.8% rate masked a 7% SMB problem they didn't discover for two quarters. They'd been over-investing in enterprise retention - which was already fine - while SMB onboarding bled out. Split your segments or you'll make the same mistake.
4. Ignoring seasonality. Q1 budget resets, Q4 procurement freezes, summer slowdowns - churn isn't evenly distributed. Comparing January churn to July churn without seasonal adjustment leads to false alarms and missed trends.
5. Not tying churn to CLV. Losing 2% of customers sounds manageable. Losing 2% of customers who represent 5% of revenue because they're your highest-ACV accounts? That's a different conversation entirely. Weight your churn analysis by revenue, not just logos.
Involuntary churn from bad contact data is the silent killer this article warns about. When your CS team can't reach at-risk accounts because emails bounce and phones don't connect, save attempts fail before they start. Prospeo's 98% email accuracy and 30% mobile pickup rate mean your retention team actually reaches the humans behind the MRR.
Fix the data layer before you lose another account to a bounced email.
Why Customers Actually Cancel
Churnkey's analysis of 3M cancellation sessions across $3B+ in subscription revenue gives us the clearest picture of why customers hit the cancel button.
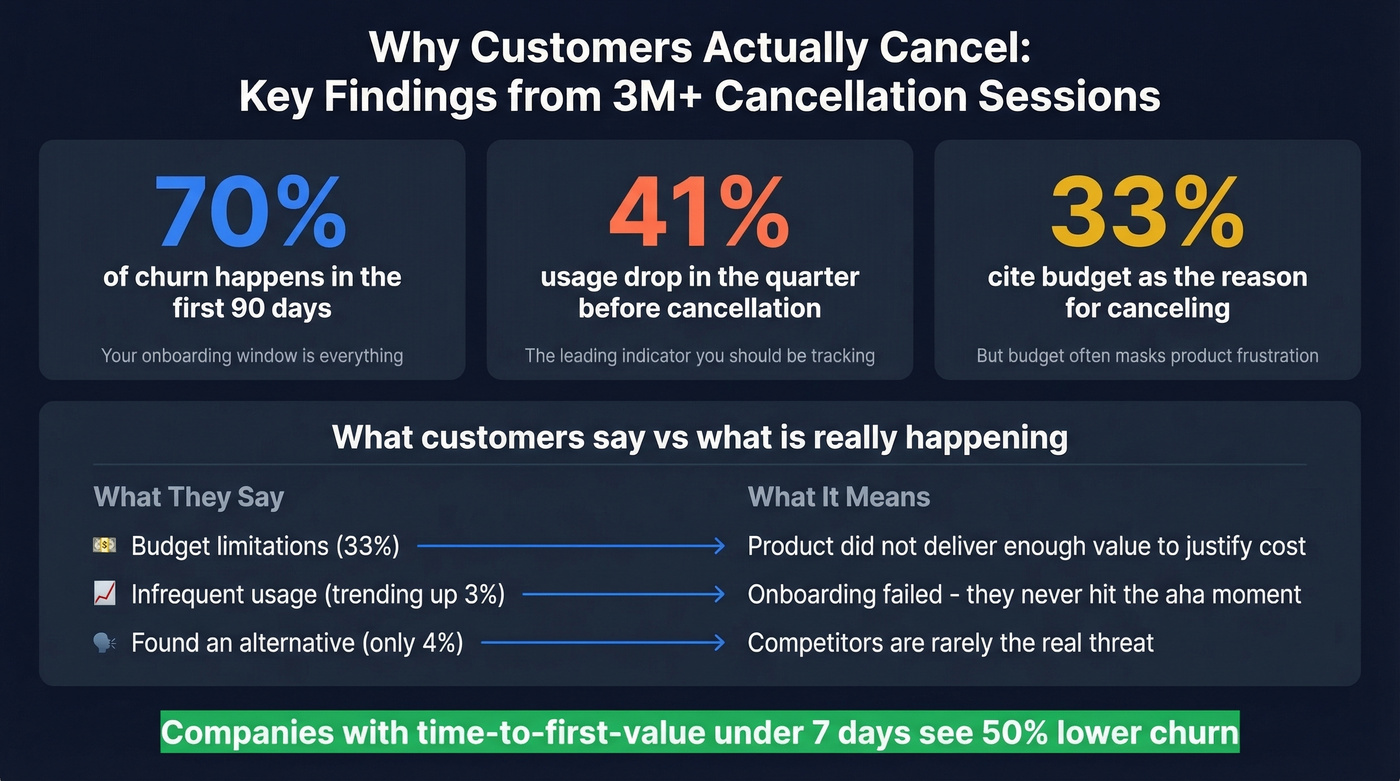
Budget limitations lead at 33% of stated reasons. But here's the thing: "budget" often masks product frustration. A customer who isn't getting value will frame it as a budget decision because it's easier than explaining that your product didn't deliver. If you take budget-related cancellations at face value, you'll build discount programs when you should be fixing onboarding.
Infrequent usage is the second-most-cited reason, and it's trending up - 3% more users cited it in 2024 versus the prior year. "Alternative solutions" accounts for only about 4% of cancellations. Your customers aren't leaving for competitors nearly as often as you think. They're leaving because they stopped using you.
The leading indicators are stark: 70% of churn happens in the first 90 days, and product usage drops 41% in the quarter before cancellation. That 90-day window is your early-warning system. If you're not monitoring usage velocity in the first three months, you're flying blind.
Voluntary Churn Playbook
Nail Onboarding in 7 Days
Companies with time-to-first-value under 7 days see 50% lower churn. That's the single most impactful stat in this entire article.
The concept is the "aha moment" - the point where a customer first experiences the core value of your product. For a CRM, it's importing contacts and sending the first sequence. For an analytics tool, it's building the first dashboard that surfaces an insight they didn't have before. Every day between signup and that moment is a day the customer might leave.
Map your aha moment. Measure time-to-reach. Then ruthlessly remove every friction point between signup and that first value delivery. If your onboarding takes 30 days, you're losing customers who never got to see what you built.
Build a Health Score That Predicts
Usage drops 41% in the quarter before cancellation. That's your 90-day leading indicator, and it should be the backbone of your customer health scoring model.
A useful health score combines product usage frequency, feature breadth (are they using one feature or five?), support ticket velocity, and engagement with communications. Weight these by their correlation with actual churn in your data. Don't guess. We've seen teams build health scores based on intuition that had zero predictive power because they weighted the wrong signals.
Once your health score flags an at-risk account, the response matters as much as the detection. The best CS teams trigger automated lifecycle emails when scores dip below a threshold, escalate to a human CSM when scores drop further, and schedule proactive check-ins before the customer ever thinks about canceling.
Optimize the Cancellation Flow
When a customer clicks "cancel," you have one last chance. Discounts account for 53% of all accepted retention offers. Pauses have a 19% acceptance rate across cancellation sessions.
Start with a reasonably-sized one-time discount. If acceptance is low, increase the offer. Pauses work particularly well for seasonal businesses or customers citing temporary budget constraints. The key is making the flow feel helpful, not desperate - nobody wants to navigate five screens of guilt-tripping before they can cancel.
Fix Your Pricing Model
Usage-based pricing churns at 2.1% monthly versus 5.6% for single flat-rate. If you're on a flat-rate model and churn is high, the pricing structure itself is likely the problem.
Usage-based models naturally align cost with value. Customers who use less pay less, so they don't cancel because they feel overcharged. Customers who use more pay more, and you capture expansion revenue automatically. Annual contracts also help: they typically show 30-40% lower churn than month-to-month, partly because of commitment bias and partly because annual customers tend to be more serious buyers.
Let's be honest: if your average deal size is under $10K, you probably don't need a complex retention stack. Fix your pricing model, nail 7-day onboarding, and implement hybrid dunning. Those three moves will do more for reducing churn than enterprise companies spending $200K/year on CS platforms.
Attract the Right Customers
The most overlooked churn lever isn't a CS motion - it's acquisition quality. Minimizing customer loss starts well before the first renewal cycle. If your sales team is closing accounts that don't fit your ICP, those customers will leave in the first 90 days no matter how good your onboarding is.
This is where data quality at the top of funnel directly impacts retention. Tools like Prospeo with 30+ targeting filters and 98% email accuracy help you reach accounts that match your ICP before the first email goes out, and a 7-day data refresh cycle means you're working with current information rather than stale records that lead to wrong-fit deals.
Involuntary Churn - The Revenue Leak
Subscription businesses lose 9% of revenue to failed payments. Involuntary churn accounts for 20-40% of total churn. And 62% of users who hit a payment error never return to the site.
Real talk: your CS team could spend six months running QBRs and maybe move voluntary churn by half a point. Or your engineering team could spend two weeks implementing intelligent retry logic and recover 8% of MRR. The ROI comparison isn't close.
The Failure-Type Breakdown
Not all payment failures are created equal.
| Failure Type | % of Involuntary | Avg Recovery |
|---|---|---|
| Expired card | 42% | 68% |
| Insufficient funds | 31% | 34% |
| Fraud block | 18% | 52% |
| Technical error | 9% | 87% |
Expired cards are the biggest bucket and the most recoverable. Technical errors are rare but almost always fixable. Insufficient funds is the hardest - you're essentially waiting for the customer's financial situation to change.
The critical distinction is soft versus hard declines. Soft declines like insufficient funds or credit limit exceeded are temporary and can be resolved through retries. Hard declines from stolen cards or business closures require customer intervention. Retrying hard declines can trigger issuer penalties, so your system needs to distinguish between the two.
Dunning Done Right
A typical dunning cadence: Day 0 friendly reminder, Day 3 more urgent, Day 7 final warning before suspension, Day 14 suspension notice. But the cadence is only half the equation - the retry logic underneath matters more.
| Method | Initial | 7-Day | 30-Day |
|---|---|---|---|
| Email-only | 15-25% | 35-45% | 50-60% |
| Intelligent retry | 40-60% | 65-75% | 75-85% |
| Hybrid (both) | 45-65% | 70-80% | 80-90% |
Hybrid dunning - combining intelligent retry logic with email/SMS sequences - recovers 80-90% of failed payments at 30 days. Email-only recovers 50-60%. That gap is pure revenue. Switching from batch-based to intelligent individualized retries alone yields a 20-50% increase in recovered revenue.
Tools that handle this well include Churnkey at roughly $500-2,000/month for SMB, Recurly starting around $249/month for growth plans, and Stripe's built-in retry logic which is free with your existing Stripe account. For enterprise CS platforms, ChurnZero and Gainsight run $20-100K+/year but cover the full retention stack including health scoring, playbooks, and renewal management. This is a solved problem. You just have to implement it.
The Revenue Math
Let's make this concrete. Take a SaaS with 300 customers paying $50/month.
At 6% monthly churn, average customer lifetime is roughly 17 months. At 2% monthly churn, it's 50 months. That's $11,150 more revenue in just six months from the same customer base - no new logos required.
Fixing involuntary churn alone lifts revenue by 8.6% in year one. That's before you touch onboarding, health scoring, or cancellation flows.
The compounding works in reverse too. Every churned customer is a customer you have to re-acquire. If your CAC is $500, a 4-point churn reduction across 300 customers saves you from needing to replace roughly 144 customers per year - that's $72,000 in avoided acquisition cost. One underrated factor in that equation: stale CRM data means your CS team is working with outdated contact info, missing signals, and reaching the wrong stakeholders. Keeping your account data on a weekly refresh cycle ensures retention motions actually land with the right people.
Your churn benchmarks are only useful if you can act on them segment by segment. Prospeo's 30+ search filters - including headcount growth, funding, technographics, and buyer intent across 15,000 topics - let you identify which accounts are expanding and which are going dark, then reach the right stakeholder with verified direct dials.
Spot at-risk accounts and reach decision-makers before renewal conversations stall.
FAQ
What's a good churn rate for SaaS in 2026?
Monthly churn ranges from 1.8% for Infrastructure & DevOps to 8.1% for Email & Communication tools. Best-in-class companies across all segments run below 1% monthly. Compare against your specific vertical and company stage - not a generic "industry average" - using the benchmark tables above.
How do you calculate annual churn from monthly?
Use the compounding formula: Annual churn = 1 - (1 - monthly rate)^12. So 2.5% monthly compounds to 26.6% annual - not 30% as simple multiplication suggests. The gap between the two methods grows larger at higher rates.
What's the difference between NRR and GRR?
NRR includes expansion revenue from upsells and cross-sells, minus churn and downgrades - median is 110% for public cloud companies. GRR excludes expansion entirely, showing how well your product retains revenue without upsells masking losses. Track both: GRR reveals true product stickiness.
What percentage of churn is involuntary?
Involuntary churn - failed payments, expired cards, processing errors - accounts for 20-40% of total churn in subscription businesses, with a median split around 26%. Hybrid dunning recovers 80-90% of failed payments at 30 days, making this the highest-ROI fix for most teams.
How does prospect data quality affect customer retention?
Bad prospecting data leads to wrong-fit customers who leave within 90 days. When sales teams work with stale emails and outdated firmographics, they close accounts that never matched your ICP. Keeping your contact data fresh - on a weekly refresh cycle rather than the typical six-week lag - helps ensure you're acquiring customers who actually fit, reducing early-stage churn at the source.