SaaS Churn: 2026 Benchmarks, Formulas, and Reduction Tactics
You're prepping the board deck. ARR looks solid - up 40% year-over-year. Then someone asks about net revenue retention, and the room gets quiet. The number's 96%. Expansion revenue has been papering over a churn problem for three quarters, and now the cracks are showing.
That's how churn works in subscription businesses. It doesn't announce itself. It compounds. A 5% monthly churn rate doesn't mean you lose 60% of customers in a year - it means you lose 46% after compounding, which is somehow both better and still catastrophic.
The Short Version
If you're pressed for time, here's what matters most:
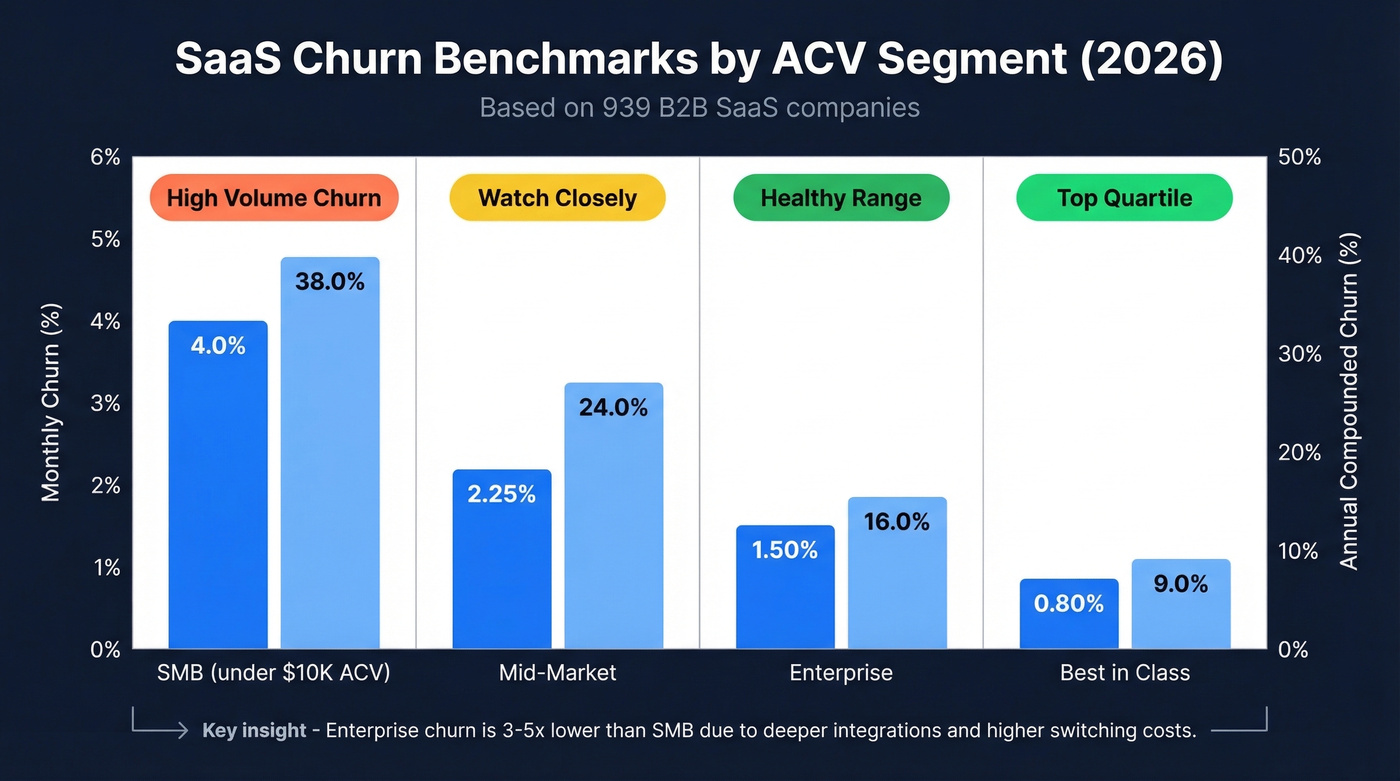
- Your benchmark depends on segment. SMB SaaS companies run 3-5% monthly churn, mid-market 1.5-3%, enterprise 1-2%. These come from a study of 939 B2B SaaS companies. Comparing yourself to a single "industry average" is useless.
- Fix involuntary churn first. Failed payments account for 13-15% of total churn, and the fix is mechanical - dunning sequences, card updaters, retry logic. Highest-ROI lever you have.
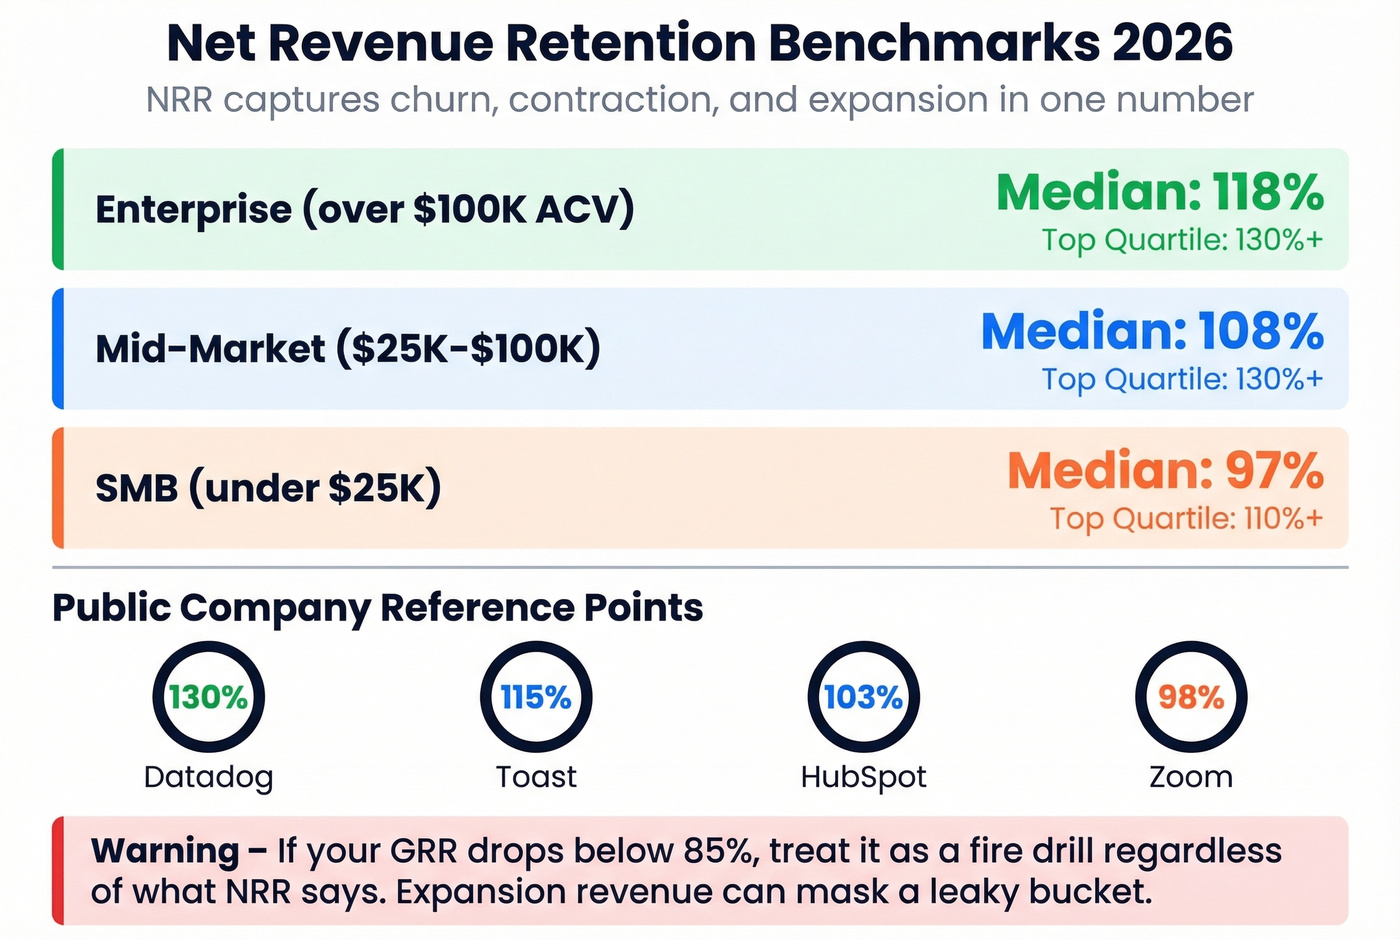
- If your NRR is above 100% but GRR is below 85%, expansion revenue is masking a retention crisis. You're growing, but the bucket leaks. Track both metrics or you'll be blindsided at renewal time.
What Is SaaS Churn?
SaaS churn measures the rate at which customers or revenue leaves your business over a given period. Simple concept, but the type you're measuring changes what you should do about it. For a deeper definition and variations, see our guide on churn.
Customer Churn vs. Revenue Churn
Customer churn (logo churn) counts the number of accounts that cancel. Revenue churn counts the dollars lost. These tell very different stories.
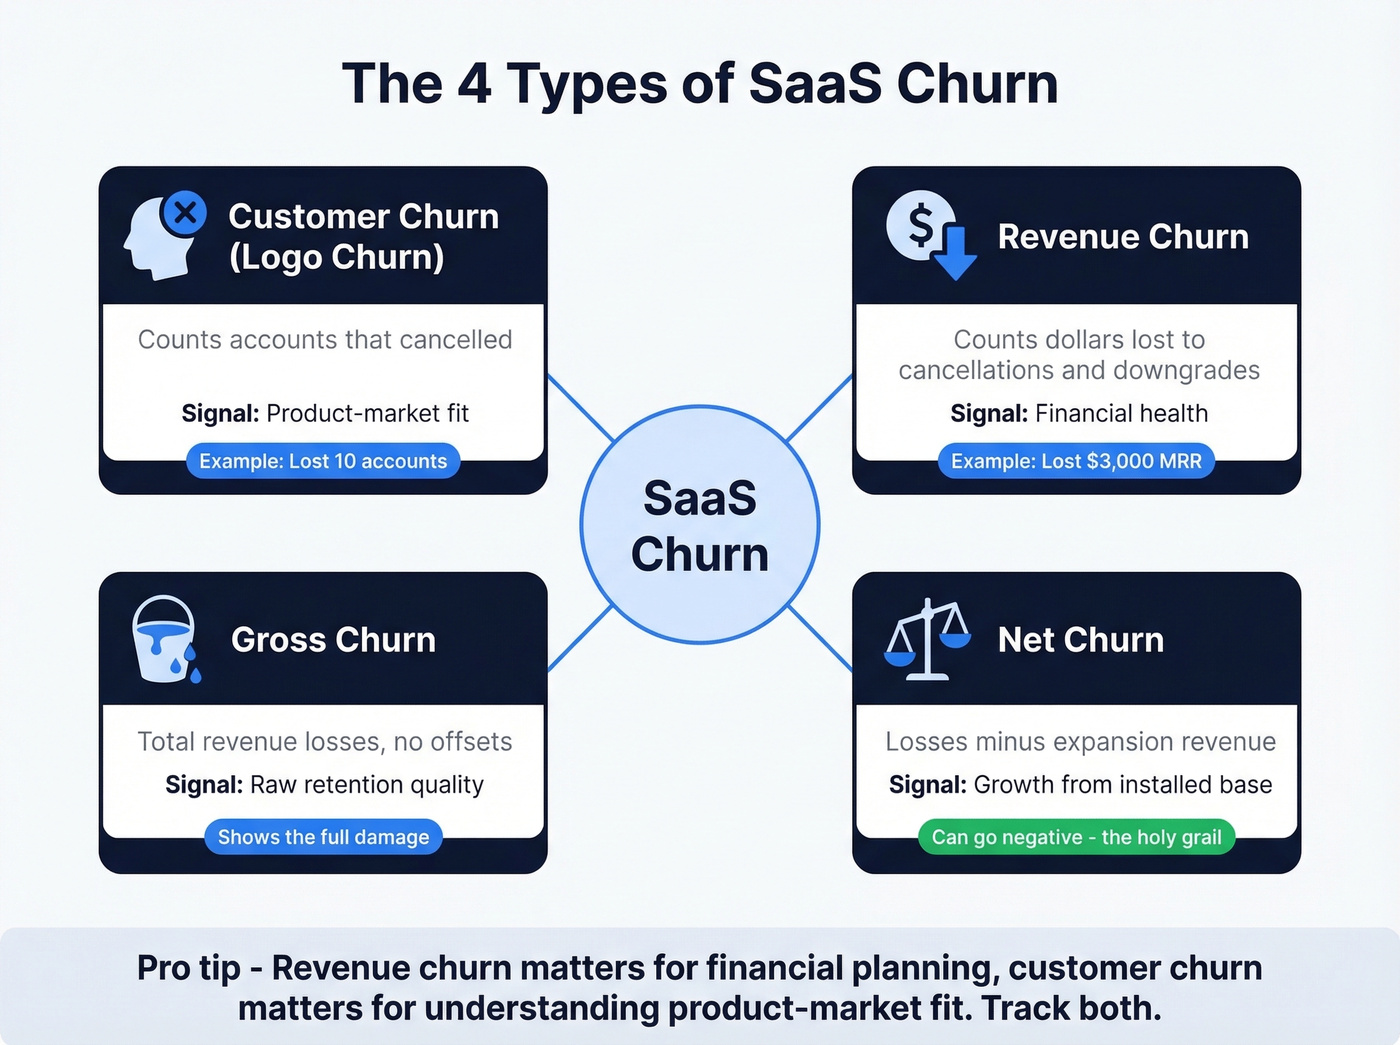
Say you lose 10 customers in a month. If they're all $50/mo SMB accounts, that's $500 in lost MRR. Lose one enterprise account worth $5,000/mo instead, and that single logo does 10x the damage. Logo churn was lower; revenue churn was catastrophic. Revenue churn is the metric that matters for financial planning, while customer churn is the metric that matters for understanding product-market fit across segments. You need both.
Voluntary vs. Involuntary Churn
Not all churn is a customer choosing to leave. Recurly's benchmark data pegs overall churn at 3.27%, split into 2.41% voluntary and 0.86% involuntary. That involuntary slice - failed credit cards, expired payment methods, bank errors - is pure waste.
B2B industries average about 3.8% overall churn, while DTC-heavy industries run closer to 6.5%. The gap exists largely because B2B customers tend to use annual contracts and have more deliberate purchasing processes.
Gross Churn vs. Net Churn
Gross churn measures total losses - every dollar or logo that left, period. Net churn subtracts expansion revenue from those losses.
Net churn can go negative. If your existing customers expand by more than the revenue you lost to cancellations and downgrades, your installed base grows even without new logos. That's the holy grail, and it's what net revenue retention captures.
| Metric | What It Measures | Formula | Signal |
|---|---|---|---|
| Customer churn | Accounts that cancelled | Lost customers / start count x 100 | Product-market fit |
| Revenue churn | Dollars lost to cancellations + downgrades | Lost MRR / starting MRR x 100 | Financial health |
| Gross churn | Total revenue losses, no offsets | Churned MRR / starting MRR x 100 | Raw retention quality |
| Net churn | Losses minus expansion | (Churned - expansion MRR) / starting MRR x 100 | Growth from installed base |
How to Calculate SaaS Churn Rate
Getting the formula right matters more than most teams realize. The approach you choose depends on your growth stage and customer mix. If you want a more diagnostic approach, use a structured churn analysis workflow.
Customer Churn Formula
Monthly Customer Churn Rate = (Customers Lost During Month / Customers at Start of Month) x 100
Example: you start January with 500 customers and lose 20. Monthly customer churn rate is (20 / 500) x 100 = 4.0%.
The common mistake is multiplying monthly by 12 to get annual churn. That gives you 48%, which is wrong. Churn compounds - each month's base is smaller than the last.
Revenue Churn Formula
Gross Revenue Churn = (Churned MRR / Starting MRR) x 100
Start the month with $100,000 MRR and lose $3,000 to cancellations and downgrades? Gross revenue churn is 3.0%.
Net Revenue Churn = ((Churned MRR - Expansion MRR) / Starting MRR) x 100
Same scenario, but existing customers expanded by $4,000 through upsells. Net revenue churn = (($3,000 - $4,000) / $100,000) x 100 = -1.0%. Negative net churn. Your base grew. This is how companies like Datadog have posted 130% NRR - their expansion engine outpaces losses by a wide margin.
The Fast-Growth Trap
The standard formula has a blind spot: it understates churn during rapid growth. When you add a lot of new customers within a measurement period, they dilute the denominator and make your rate look artificially low. A company that starts the month with 500 customers, adds 200, and loses 30 looks like it has 6% churn (30 / 500). But those 200 new customers weren't at risk for the full period.
The fix is the midpoint-adjusted formula: Churn / ((Start Customers + End Customers) / 2). Using the same numbers: 30 / ((500 + 670) / 2) = 5.1%. If you're growing more than 10% per month, use this version. The standard formula is flattering you.
Monthly-to-Annual Compounding
Annual Churn Rate = 1 - (1 - Monthly Churn Rate)^12
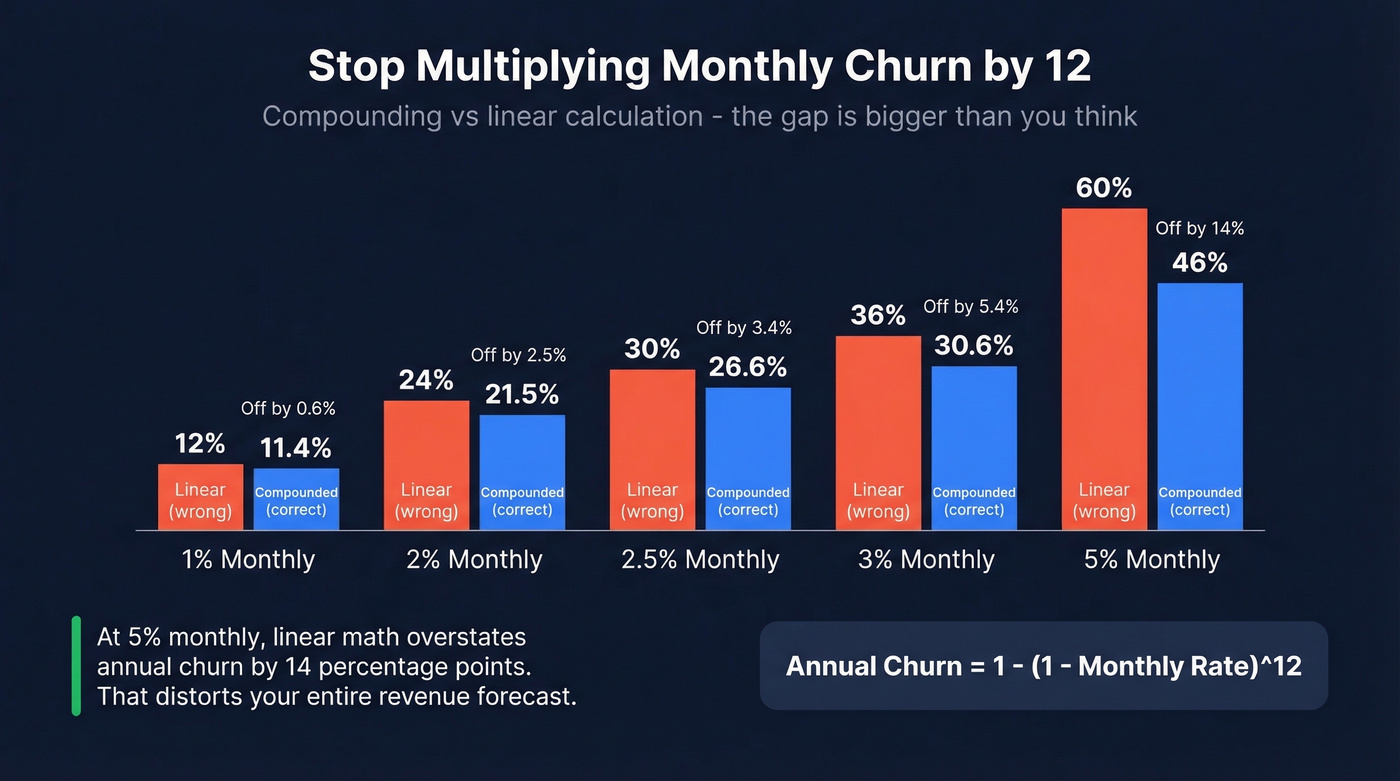
A benchmark study of 939 B2B SaaS companies illustrates this well: 2.5% monthly churn compounds to 26.6% annual, not 30%. The difference matters when you're forecasting revenue or presenting to investors. Linear multiplication always overstates churn, which sounds conservative but actually distorts your planning.
Don't multiply monthly x 12. A 2.5% monthly rate compounds to 26.6% annually. At 5% monthly, the gap is even wider: 46% compounded vs. 60% linear. Use the formula.
Involuntary churn isn't the only churn caused by bad infrastructure. When 20-35% of your outbound emails bounce, you're churning pipeline before it even starts. Prospeo's 98% verified email accuracy and 7-day data refresh cycle mean your reps connect with real buyers - not dead inboxes.
Stop losing deals to outdated contact data. Start with 75 free verified emails.
2026 Benchmarks by Segment
Benchmarks by ACV
The most useful churn benchmarks come from Optifai's study of 939 B2B SaaS companies across Q1-Q3 2025. Here's how attrition breaks down:
| Segment | Monthly Churn | Annual (Compounded) | Risk Tier |
|---|---|---|---|
| SMB (<$10K ACV) | 3-5% | 31-46% | Normal for segment |
| Mid-market | 1.5-3% | 17-31% | Watch closely |
| Enterprise | 1-2% | 11-21% | Healthy range |
| Best-in-class | <1% | <11% | Top quartile |
| High risk | >5% | >46% | Urgent action needed |
The spread between SMB and enterprise is dramatic but predictable. Enterprise customers have longer evaluation cycles, deeper integrations, and higher switching costs. SMB customers sign up with a credit card and cancel the same way.
Benchmarks by GTM Motion
Your go-to-market motion shapes your churn profile as much as your ACV does. SaaSHero's 2026 GTM benchmarks break it down:
| GTM Motion | Monthly Churn | Annual Churn | Context |
|---|---|---|---|
| PLG (product-led) | 3-5% | 30-50% | High SMB volatility |
| Sales-led | 1-3% | 10-20% | Qualified pipeline helps |
| ABM (enterprise) | 1-2% | 5-10% | Deep relationships |
PLG's higher churn isn't necessarily a problem - it's a feature of the model. You acquire customers cheaply and at volume, knowing many won't stick. The real question is whether your activation and expansion motions convert enough free or low-tier users into retained, expanding accounts. If you're running PLG and obsessing over raw churn numbers, you're measuring the wrong thing. Measure activation rate and time-to-first-value instead.
Benchmarks by Company Stage
Companies above $10M in revenue average 8.5% annual churn, while smaller firms often run 20% or higher. Part of this is product maturity, part is customer mix shifting toward mid-market and enterprise as companies grow. Around 40% of revenue now comes from existing customers through expansion - if you're not measuring expansion alongside churn, you're only seeing half the picture.
One encouraging macro signal: Paddle's Q2 2025 market report, based on 34,000+ companies on ProfitWell Metrics, showed the churn index hitting its lowest point since late 2022. The market is retaining better than it has in years.
Net Revenue Retention - The Metric That Matters More
NRR captures the full picture: churn, contraction, and expansion in a single number. The same 939-company benchmark dataset, cross-referenced with ChartMogul's 2,100-company analysis, shows clear segmentation:
| Segment | Median NRR | Top Quartile |
|---|---|---|
| Enterprise (>$100K ACV) | 118% | >130% |
| Mid-market ($25K-$100K) | 108% | >130% |
| SMB (<$25K) | 97% | >110% |
Public-company reference points add context: Datadog has posted 130% NRR, Toast 115%, HubSpot 103%, Zoom 98%. The median for venture-backed SaaS is 106%.
Here's the thing about NRR: 100% sounds fine until you realize it can hide a serious problem. If your GRR is 80% and your expansion brings you back to 100%, you're replacing a fifth of your revenue every year through upsells. That works until expansion slows - and it always slows eventually. If GRR drops below 85%, treat it as a fire drill regardless of what NRR says.
Why Customers Are Churning
The 72-Hour and 90-Day Windows
A practitioner on r/microsaas put it bluntly: most churn decisions happen in the first 72 hours. The customer signs up, pokes around, doesn't find value fast enough, and mentally checks out. They won't cancel for weeks, but the decision was made on day one.
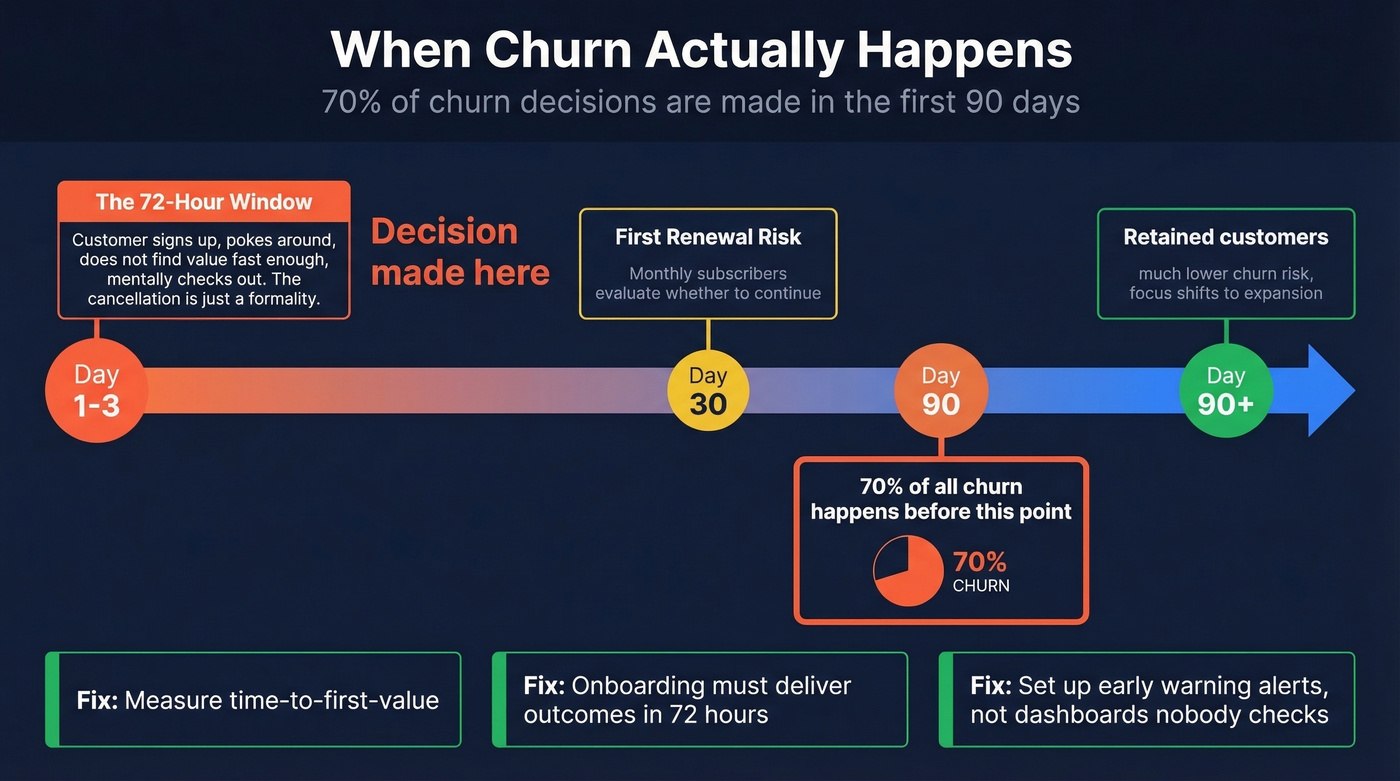
The 72-hour rule: If a customer doesn't reach their first meaningful outcome within three days, you've already lost them. The cancellation is just a formality.
Across the 939-company benchmark set, 70% of churn happens in the first 90 days. If you're not measuring time-to-first-value - the time between signup and the moment a customer gets the outcome they came for - you're flying blind on your most critical retention window.
Early Warning Signals
We've seen teams build elaborate health score dashboards that nobody checks. The consensus on r/CustomerSuccess is that dashboards get ignored. What works better: rare, high-signal alerts tied to patterns that actually preceded past churn events.
The signals that matter most aren't always obvious. Usage dips are the easy one. Admins stop logging in - that's a red flag. Support interactions change in tone or frequency. But here's the counterintuitive one: customers stop asking questions. A customer who's filing feature requests and asking "how do I do X?" is engaged. A customer who goes silent is halfway out the door.
Non-usage of key features is a stronger predictor than overall usage decline. If a customer uses your reporting module daily but never touches the integration that drives their core workflow, that's a signal worth acting on before it's too late.
Cohort Analysis: The Real Diagnostic
Stop looking at aggregate numbers. Start looking at cohorts.
Acquisition cohorts group customers by when they signed up. Your January cohort vs. your March cohort tells you whether product changes, onboarding tweaks, or market shifts are affecting retention - and it tells you more than any aggregate benchmark report ever will.
Behavioral cohorts group customers by what they did - activated a key feature, completed onboarding, integrated with their CRM. These explain why churn happens, not just when. Start with acquisition cohorts. Once you identify when churn spikes (month 2? month 6?), switch to behavioral cohorts to diagnose the cause.
How to Reduce SaaS Churn
Not all reduction tactics are equal, and the order you tackle them matters. Start with the highest-leverage fixes and work down:
- Dunning and payment recovery (mechanical, high ROI)
- Onboarding to aha moment (product + process)
- Cancellation flow and surveys (capture intelligence)
- Proactive CS outreach (relationship-driven)
- Contract structure (annual vs. monthly)
- Upstream data quality (fix who you're acquiring)
Fix Involuntary Churn First
$129 billion was lost to failed payments in 2025. Paddle's analysis of 2,000+ SaaS companies found involuntary churn accounts for 13-15% of total attrition. This is money walking out the door because of expired credit cards and bank processing errors - not because customers wanted to leave.
The scariest stat: 62% of users who hit a payment error never come back. That's not a retry problem. That's a one-shot window.
| Decline Reason | % of Failures | Recovery Potential |
|---|---|---|
| Insufficient funds | 35% | 70-80% |
| Expired card | 25% | 40-60% |
| Bank processing error | 15% | 85-95% |
| Fraud block | 12% | 20-30% |
| Network timeout | 8% | 90%+ |
The playbook is straightforward. Set up a retry sequence at 3, 7, and 14 days after the initial failure - don't retry daily, because variable spacing works better and avoids triggering fraud flags. Run a 4-email dunning flow: pre-dunning reminder before expiry, first failure notice, mid-sequence reminder, and a final notice with a grace period. Stop after 3-4 failed attempts.
ML-based retry logic can boost recovery rates 2-4x compared to native billing retry schedules. Even if the real-world number lands at the low end, it's still the easiest revenue you'll ever recover. Offer alternative payment methods - PayPal, Apple Pay, Google Pay - and make the card update flow dead simple with a direct link, not a "log in and navigate to settings" experience.
Annual contracts reduce churn 30-40% compared to month-to-month. The upfront commitment creates switching costs and eliminates 12 monthly opportunities for a payment to fail.
Shorten Time-to-First-Value
Across the benchmark data, achieving time-to-first-value under 7 days correlates with 50% lower churn. The Reddit practitioner advice is consistent: map your aha moment and strip onboarding to get users there as fast as possible.
Don't build a 14-step onboarding wizard. Figure out the single action that makes a customer say "this is worth paying for" and remove every obstacle between signup and that moment. One B2B CS team on r/CustomerSuccess reported dropping annual churn from 12% to 8% after implementing standard CS tactics - check-ins, usage monitoring, renewal reminders - alongside a streamlined onboarding flow. The basics work. Most teams just don't execute them consistently.
A micro-SaaS founder reported success seeding a community with 20-30 power users before opening broadly. These users became retention anchors who helped new users find value faster and created a feedback loop that made the product stickier for everyone.
Capture Churn Reasons
Let's be honest: most exit interviews are useless. Customers give you the polite answer two weeks after they've already moved on. Short, well-timed surveys at the exact moment of cancellation capture the real reason - and the consensus on r/SaaS is that these are "gold."
Pair cancellation surveys with a public roadmap and feature voting. When a customer sees their requested feature ship and gets a direct follow-up, they feel like a co-creator, not a ticket number. That emotional investment is a retention loop that compounds over time.
Fix Data Quality Upstream
Here's a pattern we see over and over: an SDR team books 40 demos from a purchased list. The emails were valid enough to land, but the prospects were wrong-fit - too small, wrong industry, no budget. Eight of those "customers" churn within 60 days. That wasn't a retention failure. It was an acquisition failure.
Letting wrong-fit customers churn isn't just acceptable - it improves your average LTV and reduces support burden. The goal isn't zero churn; it's zero preventable churn. And the most preventable churn comes from acquiring the wrong customers in the first place.
Bad prospect data creates a pipeline of wrong-fit customers who were never going to stick. Fixing this upstream - before reps ever send the first email - eliminates early attrition at the root. Prospeo addresses this with 98% email accuracy and a 7-day data refresh cycle, so reps reach real decision-makers at companies that actually fit your ICP. If you're tightening your targeting, start with an ideal customer profile that sales and CS both agree on. Cleaner data in means fewer misfit deals, which means less churn to fight downstream.

NRR above 100% requires expansion - and expansion requires reaching the right stakeholders at the right time. Prospeo tracks 15,000 intent topics so you can spot upsell signals before renewal conversations, not after. Layer buyer intent with job changes and headcount growth to find expansion champions inside your existing accounts.
Turn retention into expansion with intent-powered account intelligence.
When High Churn Isn't a Death Sentence
A founder on r/SaaS posted numbers that would make most benchmarking articles panic: 15% churn, SMB customers, average customer lifespan of 8 months. But their CAC was $50, LTV was $400, giving them an 8x LTV:CAC ratio. They were growing 25% month-over-month and profitable.
The "<5% churn or die" advice assumes enterprise dynamics - high CAC, long sales cycles, and customers you can't afford to replace. For SMB-focused products with low acquisition costs and strong unit economics, higher churn can be perfectly sustainable. The math works as long as your acquisition engine outpaces the leak. If you're pressure-testing the model, it helps to sanity-check your cost to acquire customer alongside retention.
If your ACV is under $5K and your LTV:CAC ratio is above 4x, churn rate is the wrong thing to obsess over. Obsess over unit economics instead. A leaky bucket is fine if you have a firehose filling it and the water is cheap.
Stop benchmarking against industry averages. Benchmark against your own cohorts. If your March cohort retains better than your January cohort, you're improving - even if both are above the "acceptable" threshold some blog post told you to hit. Cohort-over-cohort improvement is the signal. Absolute numbers are context.
FAQ
What's a good SaaS churn rate in 2026?
SMB SaaS companies typically see 3-5% monthly churn, mid-market runs 1.5-3%, and enterprise lands at 1-2%. Best-in-class companies across all segments achieve below 1% monthly. These benchmarks come from a 939-company study covering Q1-Q3 2025 - always compare against your own ACV segment, not a single industry average.
How do you calculate annual churn from monthly?
Use the compounding formula: Annual Churn = 1 - (1 - Monthly Rate)^12. A 2.5% monthly rate compounds to 26.6% annually, not 30%. Multiplying monthly by 12 always overstates the number because each month's starting base is smaller than the last. For fast-growing companies, apply the midpoint-adjusted formula first.
What causes involuntary churn?
Failed payments are the primary driver - expired credit cards, insufficient funds, bank processing errors, and fraud blocks. Involuntary churn accounts for 13-15% of total subscription attrition, and 62% of users who hit a payment error never return. Fix it with dunning sequences, smart retry logic, and alternative payment methods.
How does prospect data quality affect churn?
Bad prospect data leads to outreach hitting wrong-fit companies, producing customers who were never a good match. These misfit deals churn within 60-90 days. Using a platform with high accuracy and real-time verification - like Prospeo's email finder with 98% accuracy and a 7-day refresh cycle - ensures reps target the right prospects, reducing bad-fit acquisition that drives early churn.
What's the fastest way to reduce churn?
Start with involuntary churn - it's the lowest-effort, highest-ROI fix. Set up dunning sequences, enable smart payment retries, and offer alternative payment methods. These mechanical changes can recover 13-15% of total lost revenue without any product changes. After that, shorten time-to-first-value during onboarding, which correlates with 50% lower early-stage cancellations.