SaaS Marketing Metrics: What to Track, What's Good, and What's a Waste of Time
A VP of Marketing walks into a board meeting with 22 metrics on a slide deck. The CEO looks at three. The board looks at two. Everyone leaves confused about whether marketing is actually working.
This happens every quarter at SaaS companies of every size, and it's a symptom of a deeper problem: most teams track too many SaaS marketing metrics and understand too few. Only 1 in 10 SaaS startups reaches $10M ARR within a decade - and AI-native startups are 3x more likely to hit $1M ARR within six months, reshaping what "normal" growth looks like. The companies that break through aren't the ones with the prettiest dashboards. They're the ones who know which numbers actually drive decisions.
What You Actually Need (Quick Version)
If you track only three metrics, make them these: Net Revenue Retention (NRR), CAC Payback Period, and LTV:CAC. These three capture whether you're keeping customers, acquiring them efficiently, and generating long-term value. Everything else is supporting detail.
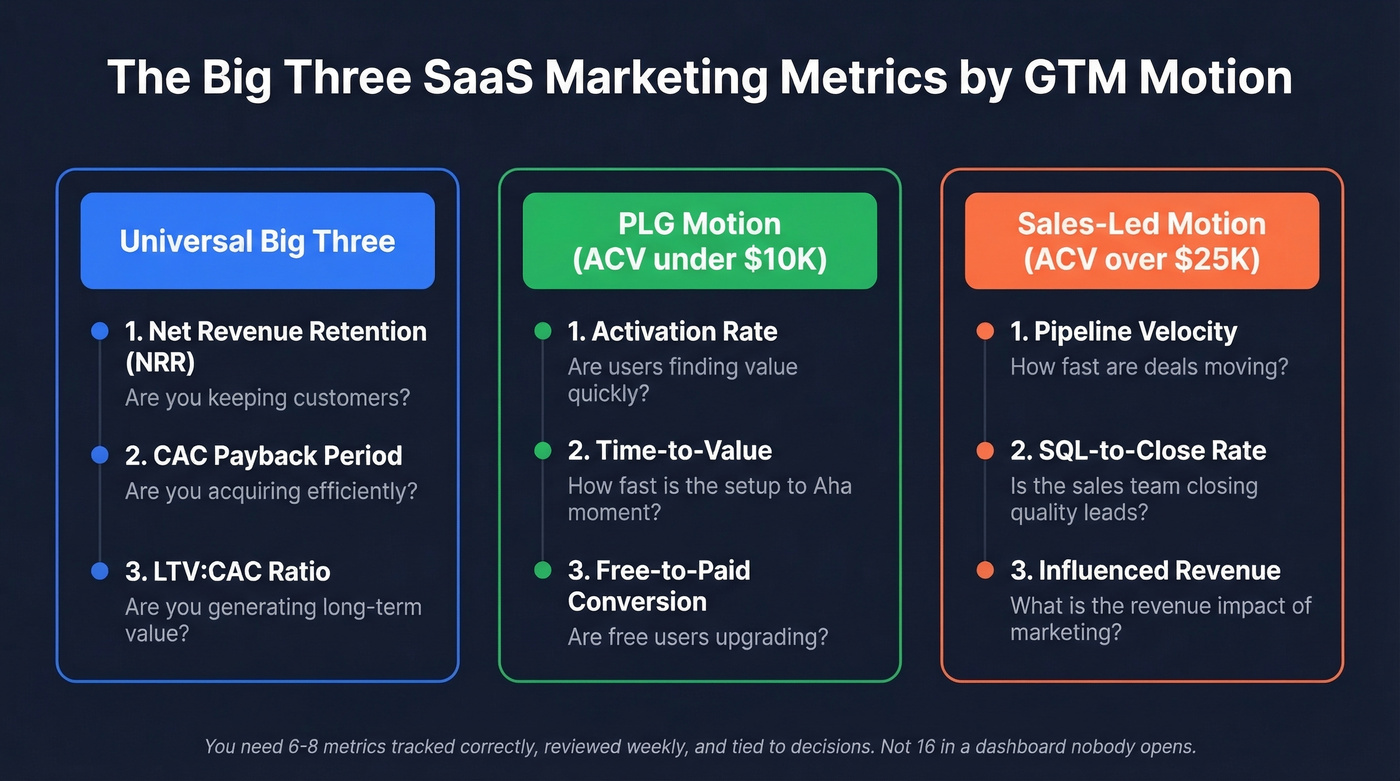
But the right "Big Three" shifts depending on how you sell.
PLG Big Three:
- Activation rate
- Time-to-value
- Free-to-paid conversion
Sales-Led Big Three:
- Pipeline velocity
- SQL-to-close rate
- Influenced revenue
You don't need 16 metrics in a dashboard nobody opens. You need 6-8 tracked correctly, reviewed weekly, and tied to decisions.
Acquisition Metrics Worth Tracking
Customer Acquisition Cost (CAC)
CAC = total sales and marketing spend / new customers acquired in the same period. Simple formula, endlessly misapplied. The most common mistake is excluding headcount costs or blending new-customer and expansion spend into one number.
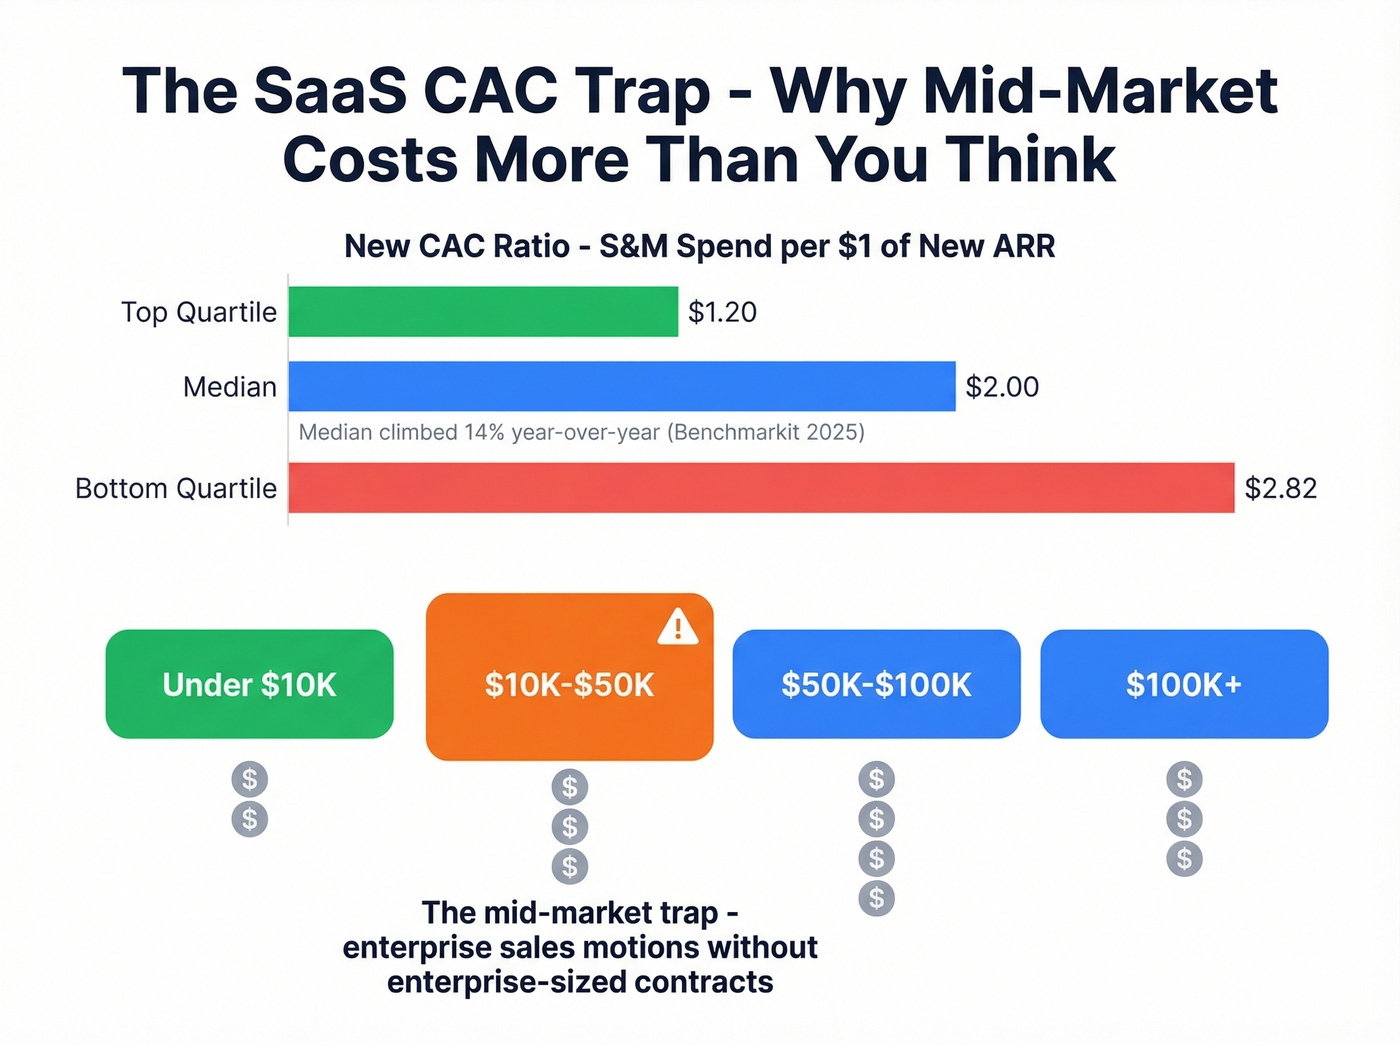
The Benchmarkit 2025 report puts the median New CAC Ratio at $2.00 - meaning companies spend $2 in S&M for every $1 of new customer ARR. That number climbed 14% year-over-year. Fourth-quartile companies spend $2.82 per dollar of new ARR, the kind of inefficiency that kills runway.
Split CAC into two versions: one for sales-assisted deals, one for self-serve conversions. A $200 self-serve CAC and a $12,000 sales-assisted CAC averaged together tells you nothing useful about either channel. This distinction is especially critical for B2B teams where deal sizes and sales cycles vary dramatically across segments.
Here's a wrinkle most guides skip: solutions in the $10K-$50K ACV range are often more expensive to acquire than $50K-$100K ACV products. Mid-market deals require enterprise-style sales motions without enterprise-sized contracts to justify the cost. If your CAC feels high and you're in that ACV band, you're not alone - it's a structural problem, not just a marketing one.
CAC Payback Period
CAC Payback = CAC / monthly recurring revenue per customer. This tells you how many months it takes to recoup what you spent acquiring a customer. Under 12 months is healthy for most SaaS businesses. Over 18 months and you're financing growth with a credit card you can't pay off fast enough.
Lead Velocity Rate
LVR measures month-over-month growth in qualified leads. It's a leading indicator - revenue is a lagging one. If your LVR is climbing while close rates hold steady, pipeline is about to expand. If LVR flatlines while the team is "crushing it" on demos, you've got a pipeline problem that won't show up in revenue for 60-90 days.
MQLs, SQLs, and PQLs
MQLs and SQLs are the classic handoff points. They're imperfect - the MQL-to-SQL conversion debate regularly turns into a turf war between marketing and sales. But they're still the standard vocabulary of B2B funnels, and conversion rates at each stage remain one of the most reliable ways to diagnose funnel health.
PQLs matter more in PLG motions. The newer concept worth tracking is the PQA - product qualified account - which triggers when an account hits usage thresholds like 5+ weekly active users or deep feature adoption. PQAs signal organizational buying intent, not just one person poking around a free tier.
Revenue Metrics
MRR and ARR
Monthly Recurring Revenue and Annual Recurring Revenue are the foundation. MRR is your monthly heartbeat; ARR is MRR x 12. Always exclude services revenue, setup fees, and one-time charges. If your ARR includes professional services, your board will eventually notice and nobody will be happy about it.
CMGR benchmarks from David Sacks' framework: target 15%+ CMGR below $1M ARR, 10%+ above $1M ARR. Median SaaS growth sits at 26% annually, with the top quartile slowing from 60% in 2023 to 50% in 2024.
Expansion Revenue
Expansion revenue - upsells, cross-sells, seat additions - is increasingly where growth comes from. It accounts for 40% of total new ARR across the board, and over 50% for companies above $50M ARR. That makes it the most capital-efficient growth lever in SaaS, and if you're not measuring it separately from new-logo revenue, you're flying blind on your best channel.
Here's the thing: if your expansion revenue is below 30% of new ARR, you don't have a growth problem. You have a product problem. No amount of marketing spend fixes a product that customers don't expand into.
ACV and ARPU
Average Contract Value determines your GTM motion more than almost any other number. Below $10K ACV, you need PLG or high-velocity inside sales. Above $25K, you need sales-assisted or enterprise motions. ARPU is the per-seat version - useful for PLG companies tracking monetization efficiency.
Retention Metrics
Net Revenue Retention (NRR)
NRR is the single most important metric in SaaS. Full stop.
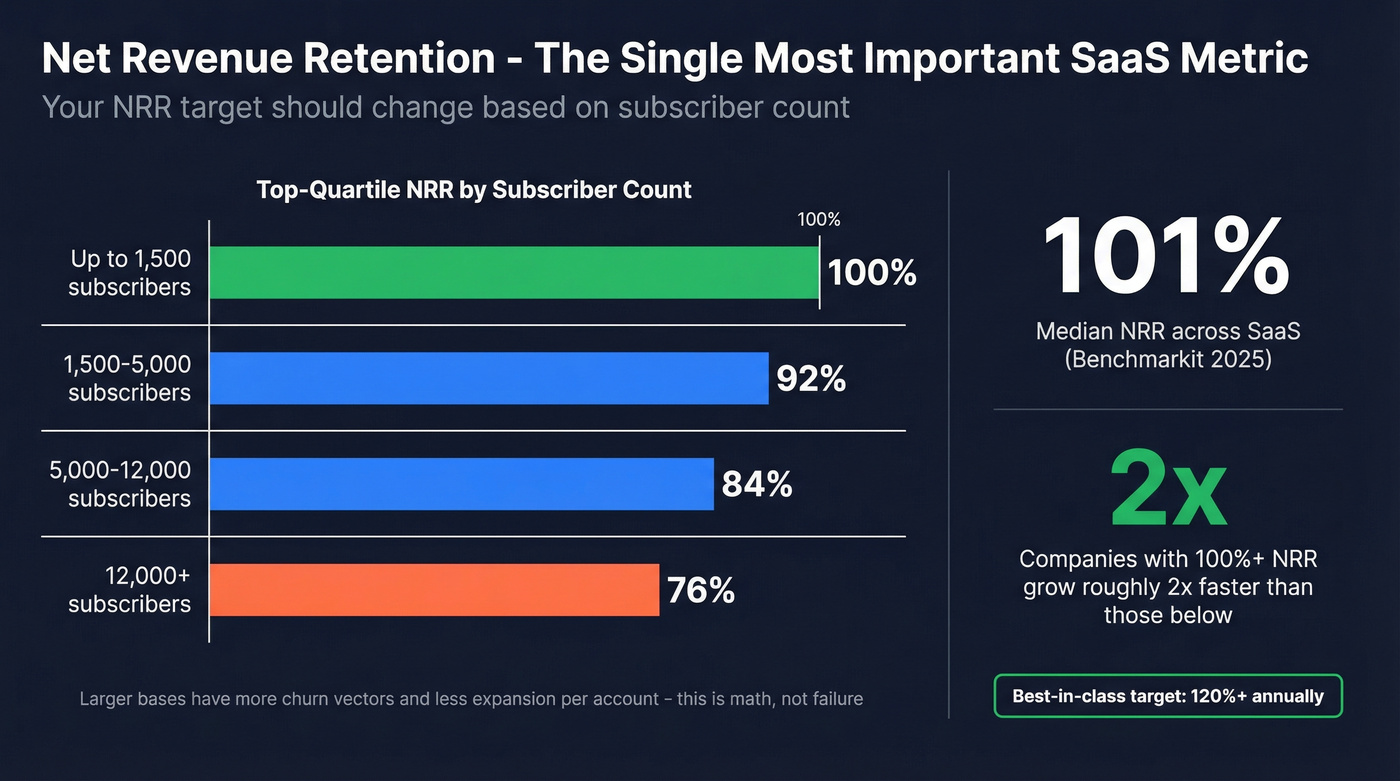
It measures whether your existing customers are spending more, less, or the same over time. Median NRR sits at 101% - barely above breakeven. Companies with 100%+ NRR grow roughly 2x faster than those below that line. The best SaaS companies hit 120%+ annually.
Here's what most guides get wrong about NRR: your target should change based on subscriber count. Top-quartile companies with up to 1,500 subscribers achieve 100% NRR. But top-quartile NRR for companies with 12,000+ subscribers drops to around 76%. This isn't failure - it's math. Larger customer bases have more diverse use cases, more churn vectors, and less room for expansion per account. If you're benchmarking your 15,000-customer base against a startup's 500-customer NRR, you're setting yourself up for a misleading narrative.
Gross Revenue Retention (GRR)
GRR strips out expansion and measures pure retention - what percentage of existing revenue you keep before upsells. The three-year trend has slid from 90% to 88%. That doesn't sound dramatic, but compounded over three years, it means meaningfully more revenue leaking out the bottom of the bucket.
Logo Churn by Segment
Logo retention norms vary wildly by segment. Enterprise customers retain at 90-95% annually. Mid-market runs around 85%. SMB can be as low as 70-80%.
If you're selling to SMBs and panicking about 75% logo retention, take a breath - that's within normal range. If you're selling to enterprise and seeing 85%, something is broken in onboarding or customer success. Usage-based SaaS companies face a different challenge entirely: defining churn when customers have variable monthly consumption rather than a clean cancel event. The consensus on r/SaaS threads is basically "pick a definition, document it, and apply it consistently." There's no universal answer yet.
Tracking CAC payback under 12 months means every dollar of sales and marketing spend has to connect. Prospeo delivers 98% email accuracy and 30% mobile pickup rates - so your outbound actually reaches real buyers. Teams book 26% more meetings compared to ZoomInfo, at 90% lower cost per lead.
Fix your acquisition efficiency at the source - start with better data.
Efficiency Metrics That Signal Health
LTV:CAC Ratio
LTV:CAC compares the lifetime value of a customer to the cost of acquiring them. A ratio of 3:1 is the classic benchmark - you're generating $3 for every $1 spent on acquisition. Below 1:1, you're losing money on every customer. Above 5:1, you're probably underinvesting in growth.
The formula: LTV = ARPU x gross margin x average customer lifespan. Divide by CAC. The tricky part is estimating customer lifespan honestly. Most teams overestimate it.
The SaaS Magic Number
The Magic Number measures sales and marketing efficiency: ((Current quarter ARR - Last quarter ARR) x 4) / Last quarter S&M expense.
Above 0.75 is healthy - pour on the gas. Below 0.5 is inefficient - step back and diagnose. Above 1.5? You've found a growth engine and should be scaling aggressively.
The Magic Number has a blind spot worth understanding, though. It measures net revenue growth, which means churn drags it down even if your GTM motion is working perfectly. A company with great acquisition but terrible retention will show a low Magic Number and blame marketing. It also breaks with long enterprise sales cycles where Q1 spend doesn't produce revenue until Q3. Use trailing periods for anything above a 90-day cycle.
Burn Multiple and Rule of 40
Burn Multiple = net burn / net new ARR.
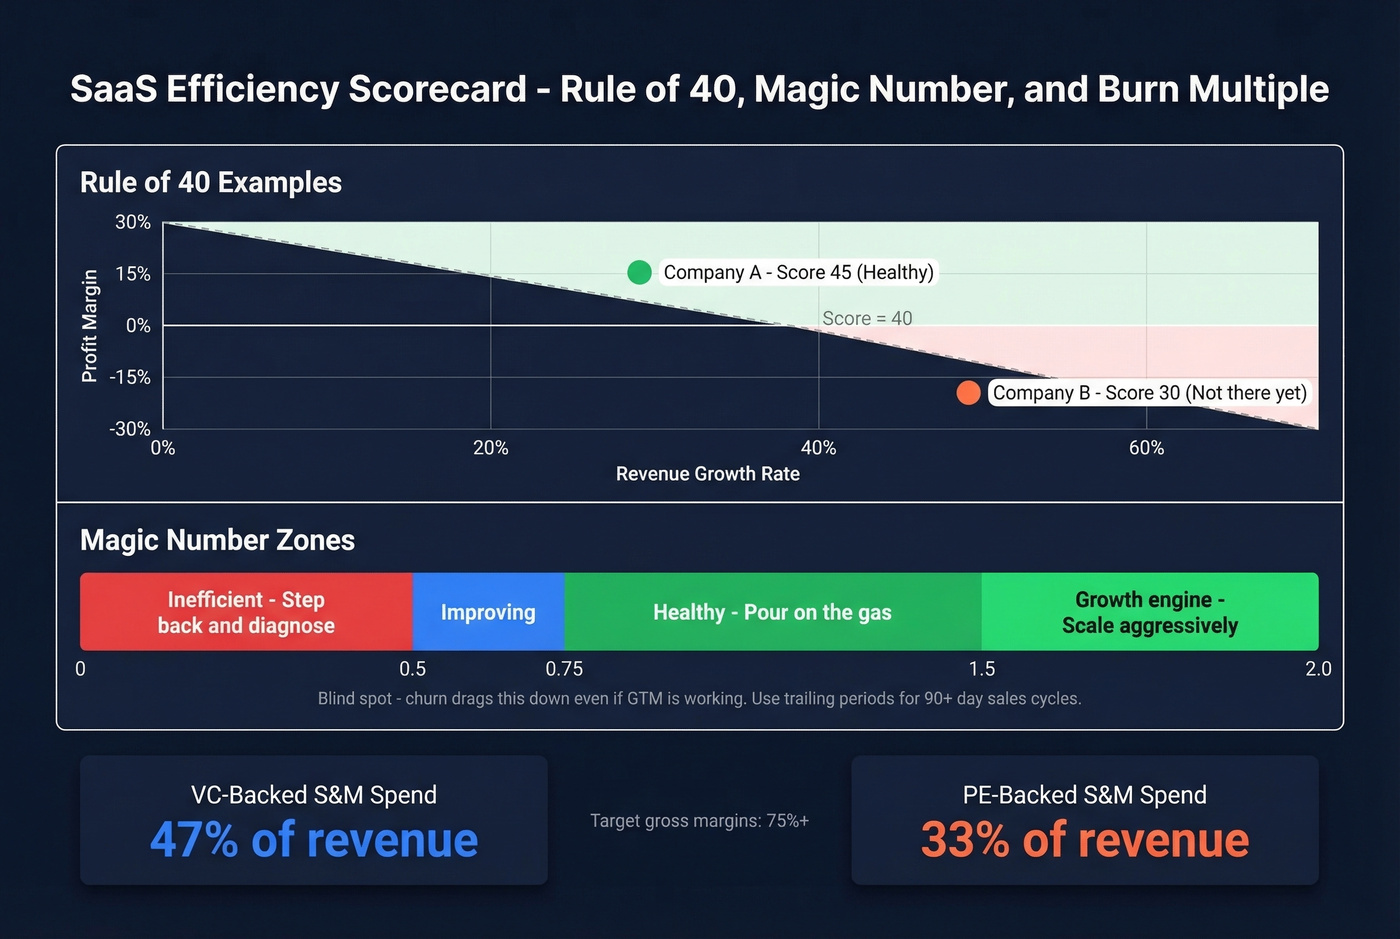
The Rule of 40 says your growth rate plus profit margin should exceed 40%. A company growing 30% with 15% margins scores 45 - healthy. A company growing 60% with -30% margins scores 30 - not there yet. Long-term, investors expect SaaS gross margins of 75%+. VC-backed companies spend 47% of revenue on S&M versus 33% for PE-backed - a useful signal for where your spend mix should land based on your capital structure.
Metrics by GTM Motion
The metrics that matter shift based on how you sell. Tracking pipeline velocity in a pure PLG motion is like measuring test drives at a vending machine.
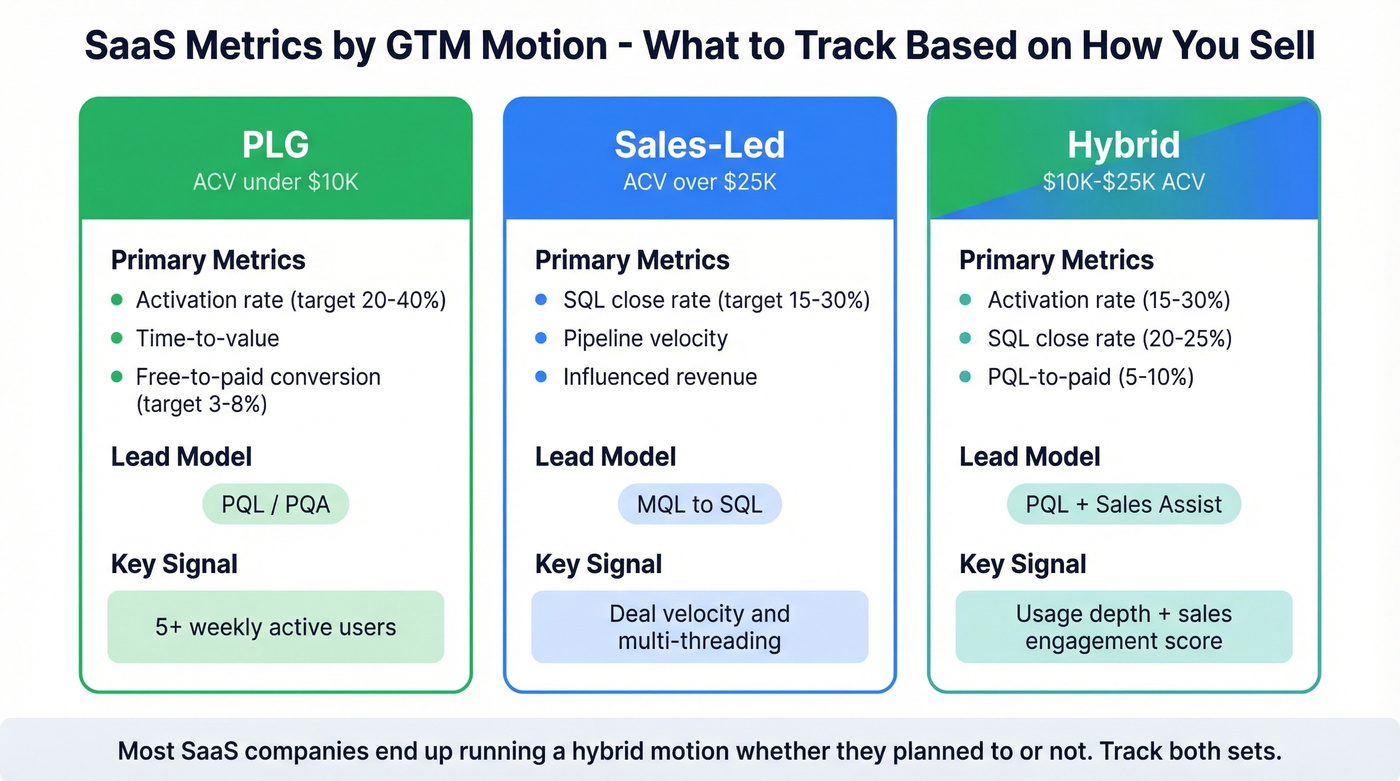
| PLG (ACV <$10K) | Sales-Led (ACV >$25K) | Hybrid ($10K-$25K) | |
|---|---|---|---|
| Primary metrics | Activation rate, TTV, free-to-paid | SQL close rate, pipeline velocity | Activation rate + SQL close rate |
| Lead model | PQL / PQA | MQL to SQL | PQL + sales assist |
| Typical activation | 20-40% | N/A | 15-30% |
| Conversion | Free-to-paid 3-8% | Demo-to-close 15-30% | PQL-to-paid 5-10%, demo-to-close 20-25% |
| Key signal | 5+ weekly active users | Deal velocity, multi-threading | Usage depth + sales engagement score |
Most SaaS companies eventually end up running a hybrid motion whether they planned to or not. The PLG funnel feeds the top; sales assists on larger accounts. Track both sets of metrics and don't pretend you're purely one or the other.
Attribution - The Metric Behind the Metrics
Attribution is where your reporting either becomes trustworthy or collapses into fiction. An estimated 32% of marketing spend is lost to poor attribution - not because the spend was wasted, but because nobody can prove where it worked.
For most B2B SaaS teams, the W-shaped model is the right starting point. It assigns 30% credit each to first touch, lead creation, and opportunity creation, with the remaining 10% spread across middle touches. For sales cycles longer than 60 days, layer in time-decay weighting with a 30-45 day half-life.
Data-driven attribution sounds appealing but needs 1,000+ closed deals for statistical significance - most Series A and B companies don't have that volume yet. Run a 30-day parallel tracking period during rollout. Teams that properly implement attribution models typically see a 20%+ reduction in effective CAC.
Let's be honest about the part nobody talks about: attribution accuracy depends entirely on CRM data quality. If 20% of your contacts have wrong emails, missing job titles, or stale company data, your attribution model is running on garbage inputs. We've seen teams spend months building multi-touch attribution only to realize their contact database was so degraded that the outputs were meaningless. Enrichment tools that return 50+ data points per contact and maintain a 92% API match rate - like Prospeo - give attribution models the clean foundation they actually need.
Data Quality - The Hidden Variable
Every metric in this article assumes your underlying data is accurate. Most teams don't check that assumption until something breaks.
Here's a scenario we've watched play out repeatedly: CAC jumps quarter-over-quarter, but pipeline is flat. Marketing gets blamed. The real culprit? Email bounce rates spiked because the prospect database hadn't been refreshed in months. Every bounced email inflates your denominator, corrupts attribution, and deflates conversion rates across the entire funnel. Your CAC didn't actually go up - your data got worse.
Skip the metrics optimization if your bounce rate is above 5%. Fix the data first. That's the unsexy work that makes every other number in this article trustworthy. If you need a baseline, start with email bounce rate benchmarks and remediation steps, then work backward into deliverability and list hygiene.
Pipeline velocity depends on reaching the right people fast. Prospeo's 300M+ profiles refresh every 7 days - not the 6-week industry average - so your SQLs are built on current, verified contacts. Layer in intent data across 15,000 topics to target accounts already in-market.
Stop measuring a pipeline built on stale data. Refresh yours weekly.
2026 Benchmark Table
Based on the most recent benchmark reports published in 2025, reflecting 2024 performance data.
| Metric | Median / Target | Source |
|---|---|---|
| ARR growth rate | 26% | Benchmarkit 2025 |
| NRR | 101% | Benchmarkit 2025 |
| New CAC Ratio | $2.00 per $1 ARR | Benchmarkit 2025 |
| Expansion share of new ARR | 40% (>50% at $50M+) | Benchmarkit 2025 |
| GRR | 88% | Benchmarkit 2025 |
| ARR per FTE ($50M-$100M) | $200K | Benchmarkit 2025 |
| Gross margin (long-term) | 75%+ | Sacks |
| Logo retention (enterprise) | 90-95% | Sacks/Craft |
| Logo retention (SMB) | 70-80% | Sacks/Craft |
| Magic Number (healthy) | >0.75 | Leckie |
| Website conversion rate (B2B) | 2-5% | Benchmarkit 2025 |
| S&M as % of revenue (VC) | 47% | Benchmarkit 2025 |
| S&M as % of revenue (PE) | 33% | Benchmarkit 2025 |
For interactive benchmarking filtered by company size, ACV, and GTM motion, see the Maxio 2025 report covering 500+ B2B SaaS companies. If you're tightening your reporting stack, it also helps to standardize your funnel metrics and align them with your pipeline health review cadence.
FAQ
What's the most important SaaS marketing metric?
Net Revenue Retention. Companies with 100%+ NRR grow roughly twice as fast as those below that threshold. NRR captures acquisition quality, retention strength, and expansion effectiveness in a single number - the closest thing to a universal health indicator for any SaaS business.
What do investors look at first?
Investors zero in on three numbers: NRR, CAC Payback Period, and the Rule of 40 score. NRR tells them whether the product retains and expands. CAC Payback reveals capital efficiency. The Rule of 40 balances growth against profitability. Everything else in your board deck is context for these three.
Which metrics matter most for early-stage SaaS?
Focus on leading indicators you can actually influence: activation rate, free-to-paid conversion, and lead velocity rate. Pre-$1M ARR, you don't have enough revenue history for trailing indicators like NRR or LTV:CAC to be statistically meaningful. Layer in efficiency metrics like CAC Payback and the Magic Number once you pass that threshold.
How does data quality affect these metrics?
Bad prospect data inflates CAC, corrupts attribution, and deflates conversion rates across the entire funnel. If 15-30% of your emails bounce, every downstream number becomes unreliable. Weekly data refreshes - versus the 6-week industry average - keep your reporting grounded in reality rather than slowly drifting into fiction.