Sales Campaign Performance Tracking: KPIs, Formulas, and Dashboards That Matter
Why Most Teams Can't Answer "Which Campaign Worked?"
84% of reps missed quota last year, and only 7% of organizations achieve above 90% forecast accuracy. Those numbers aren't just about bad selling - they're about bad measurement. Without proper sales campaign performance tracking, you can't attribute pipeline to the campaign that created it, double down on what works, or kill what doesn't.
Here's the thing: most "campaign tracking" guides are marketing guides wearing a sales hat. They'll tell you to track impressions, MQLs, and cost-per-click. That's fine for demand gen. But if you're running outbound sequences, cold call blitzes, or multi-touch ABM plays, you need a completely different measurement framework. Buyers now use roughly 10 interaction channels on average - up from 5 in 2016 - and 75% take longer to decide than they did two years ago. The tracking has to match that complexity.
What makes campaign tracking work for outbound teams comes down to three things. First, you need KPIs tied to pipeline and revenue, not marketing vanity metrics. Second, you need a CRM with proper campaign tagging so every opportunity traces back to the sequence that created it. Third - and this is where most teams fall apart - you need clean contact data. Every metric downstream breaks if 30% of your emails bounce. Reply rates, cost-per-meeting, campaign ROI: all garbage in, garbage out.
KPIs That Connect Activity to Revenue
Stop tracking opens. Apple Mail Privacy Protection made open rates unreliable years ago. Track what connects to revenue.
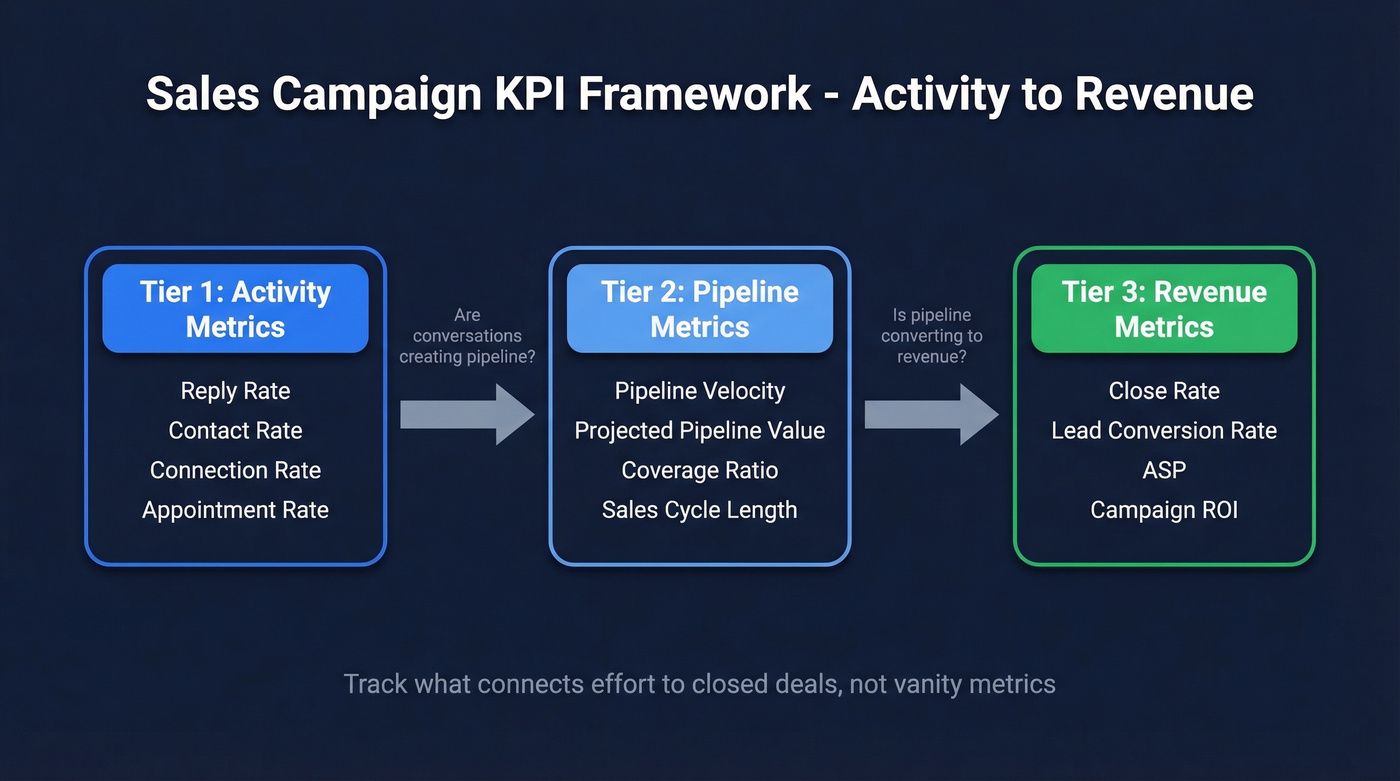
We've organized these into three tiers: what your reps do, what the pipeline looks like, and what closes. This framework applies whether you're building analytics for a five-person startup or scaling a 200-rep enterprise org.
Outbound Activity Metrics
These tell you whether campaigns are reaching real humans and generating conversations.
Reply Rate = (Replies Received / Emails Delivered) x 100 Cold outbound reply rates land between 2-8% depending on personalization and list quality. Above 10% is strong.
Contact Rate = (Live Person Contacts / Total Leads on List) x 100
Example: 50 live contacts from a 500-person list = 10%. Below 8%? Your data is the problem, not your messaging.
Connection Rate = (Live Conversations / Total Dials) x 100
Example: 15 conversations from 100 dials = 15%. B2B cold calling benchmarks run 10-20%.
Appointment Rate = (Appointments Scheduled / Prospects Contacted) x 100
Example: 10 meetings from 200 contacts = 5%. This bridges activity and pipeline, where SDR effort converts into AE opportunity. It's also one of the clearest lead-to-meeting conversion signals you can measure.
Pipeline Metrics
These tell you whether campaigns create real revenue potential or just fill the top of a leaky funnel.
Pipeline Velocity = (Number of Opportunities x Average Deal Size x Win Rate) / Sales Cycle Length (days) This is the single most diagnostic metric for campaign health. A campaign can generate tons of opportunities, but if they're small, slow, and low-probability, velocity exposes that instantly.
Projected Pipeline Value = Deal Value x Probability of Closing
Example: a $20k opportunity at 40% probability = $8k projected value. Sum this across all campaign-generated deals for a weighted pipeline view that's far more useful than raw opportunity count.
Pipeline Coverage Ratio - target 3-5x your quota per rep per quarter. Below 3x and you're flying blind on forecast. Above 5x and you're stuffing the pipe with unqualified deals.
Sales Cycle Length - the average B2B sales cycle runs 1-3 months, with 8% of high-value deals exceeding 5 months. Compare cycle length across campaigns to spot which ones attract faster-closing buyers.
Revenue Metrics
These are the metrics your CFO actually cares about.
Close Rate = (Won Deals / Total Opportunities) x 100 The average B2B close rate sits around 29%. Win rate (won / won + lost, excluding open) averages roughly 21%.
Lead Conversion Rate = (Closed Deals / Total Leads) x 100 This end-to-end metric reveals the true efficiency of a campaign from first touch to revenue. A campaign with a 2% lead conversion rate and $50k average deal size beats one with 5% conversion and $8k deals every time.
Average Selling Price (ASP) = Total Revenue / Number of Deals Closed. Tracking ASP per campaign reveals whether certain sequences attract higher-value buyers - a signal that raw close rate alone can't provide.
Cost per Meeting = Total Campaign Cost / Meetings Held Include rep time, tool costs, and data spend. If a campaign costs $5,000 and generates 20 meetings, that's $250/meeting. Compare across campaigns and you'll know where to invest.
Campaign ROI = (Revenue Attributed - Campaign Cost) / Campaign Cost Simple, but only works if your CRM attribution is clean.
2026 Benchmarks
| Metric | Benchmark | Context |
|---|---|---|
| Close rate | ~29% | B2B average |
| Win rate | ~21% | Won / (won + lost) |
| Forecast accuracy | 70-79% | Only 7% of orgs hit >90% |
| Speed to lead | <5 minutes | Conversion drops sharply after |
| Pipeline coverage | 3-5x target | Per rep, per quarter |
| Sales cycle | 1-3 months | 8% of high-value deals exceed 5 months |
| Buyer channels used | ~10 | Up from 5 in 2016 |
| Decision timeline | 75% taking longer | Compared to two years ago |
| Digital interactions | 80% of B2B | Gartner projection |
| Cold email reply rate | 2-8% | Varies by personalization |
| Connection rate (calls) | 10-20% | B2B cold calling |
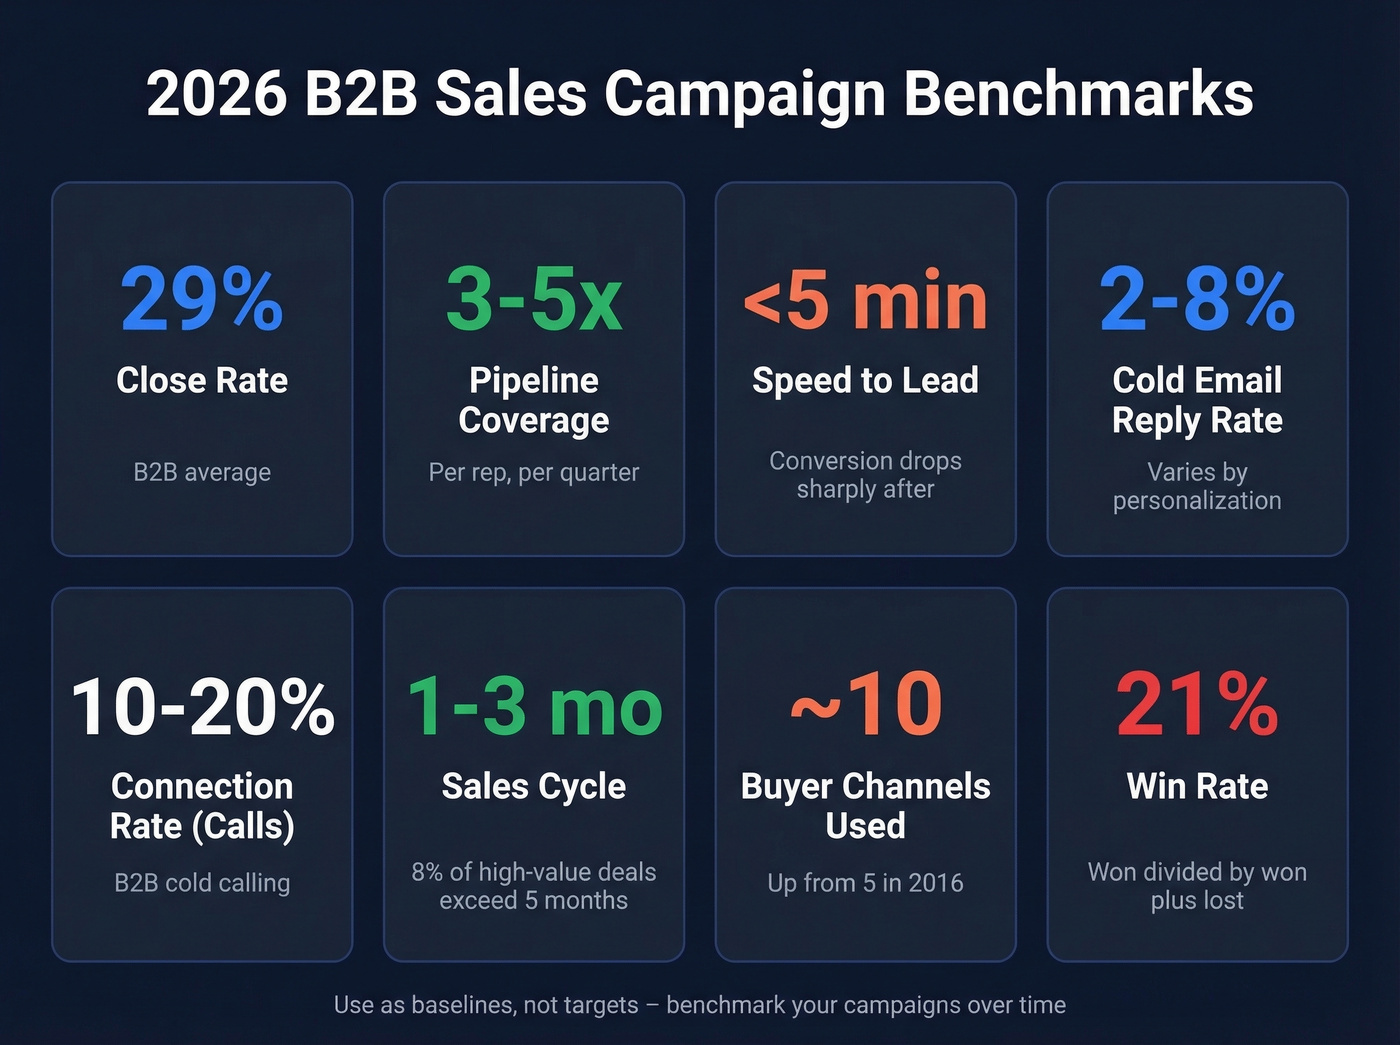
Use these as baselines, not targets. Your numbers will vary by industry, deal size, and sales motion. The point is to benchmark campaign performance over time - is this quarter's sequence outperforming last quarter's?
Every KPI in this article - reply rate, cost-per-meeting, campaign ROI - depends on emails reaching real inboxes. Prospeo's 98% email accuracy and 7-day data refresh mean your campaign metrics reflect actual performance, not bad data. Teams using Prospeo book 26% more meetings than ZoomInfo users.
Stop tracking campaigns built on bounced emails.
Setting Up Campaign Tracking in Your CRM
Your SDR team ran three sequences last month. One had a 12% reply rate. One had 2%. But nobody tagged the opportunities correctly, so the pipeline report shows all of it as "outbound" with no way to compare. Sales teams consistently cite CRM tagging discipline as the #1 breakdown in campaign attribution - and in our experience, they're right. Without proper tagging, any CRM becomes just an expensive contact database.
Required fields on every opportunity:
- Campaign/Source - the specific sequence, call blitz, or ABM play that generated the meeting. Not just "outbound." Use naming conventions like
outbound_cold-email_icp-fintech_2026-q2. - Sequence Name - if you're running Outreach or Salesloft, map the exact sequence name to the opportunity.
- Original Lead Source - inbound, outbound, referral, event. Keep this separate from campaign so you can slice both ways.
- First Touch Date - when the prospect first entered the sequence. Critical for calculating true cycle length.
UTM-to-CRM mapping matters for any campaign touching digital channels. If an SDR sends a cold email with a link to a case study, that click should flow through to the CRM via UTM parameters.
Pick a naming format - {motion}_{channel}_{segment}_{quarter} - and enforce it. One team member using "Q2 cold email" while another uses "cold-email-q2-fintech" will break every dashboard you build. This is especially critical for agencies running multi-client analytics, where inconsistent naming across accounts makes cross-client reporting impossible.
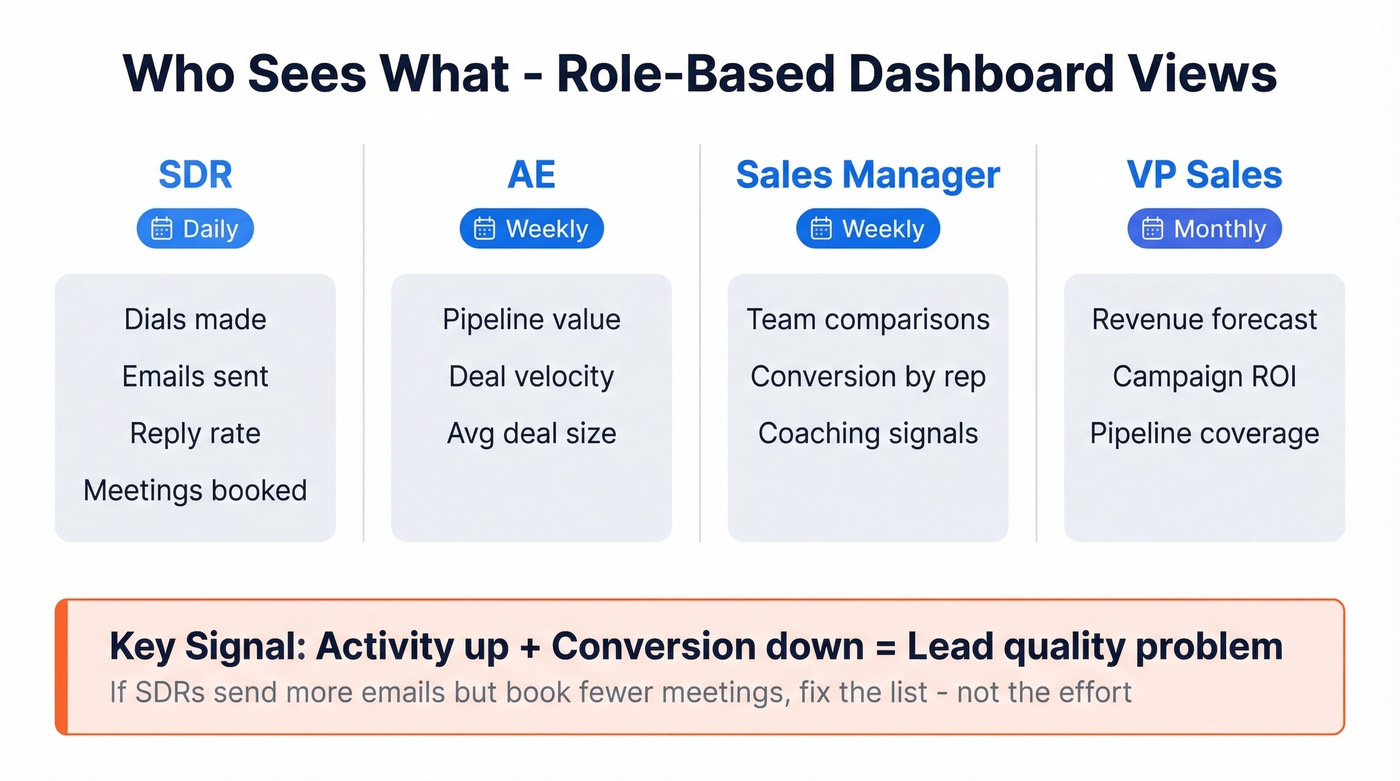
Role-Based Dashboard Views
A dashboard that works for an SDR is useless for a VP of Sales. The right setup gives each role exactly the data they need at the cadence they need it.
| Role | Primary Metrics | Cadence |
|---|---|---|
| SDR | Dials, emails sent, reply rate, meetings booked | Daily |
| AE | Pipeline value, deal velocity, avg deal size | Weekly |
| Sales Manager | Team comparisons, conversion by rep, coaching signals | Weekly |
| VP Sales | Revenue forecast, campaign ROI, pipeline coverage | Monthly |
The diagnostic insight that matters most: activity up + conversion down = lead quality problem. If your SDRs are sending more emails than ever but booking fewer meetings, the data is bad or the targeting is off. Don't coach harder dials - fix the list.
Organizations using mobile CRM hit targets 65% of the time vs 22% without. If your reps can't check pipeline on their phone between meetings, you're leaving visibility on the table. Set up real-time alerts for anomalies - stalled deals, velocity drops, reply rate crashes. Monthly reviews catch problems too late.
Sales managers should also build filtered views that surface at-risk deals, stalled sequences, and rep-level conversion gaps without requiring manual data pulls each week.
Five Tracking Mistakes That Destroy Your Data
Mistake 1: Last-Click Attribution Bias
Last-click attribution over-credits whatever happened right before the meeting booked. That cold call gets 100% credit, even though the prospect opened three emails, clicked a case study, and visited your pricing page first. This leads to budget misallocation - you over-invest in the closing channel and under-invest in the sequences that warm prospects up.
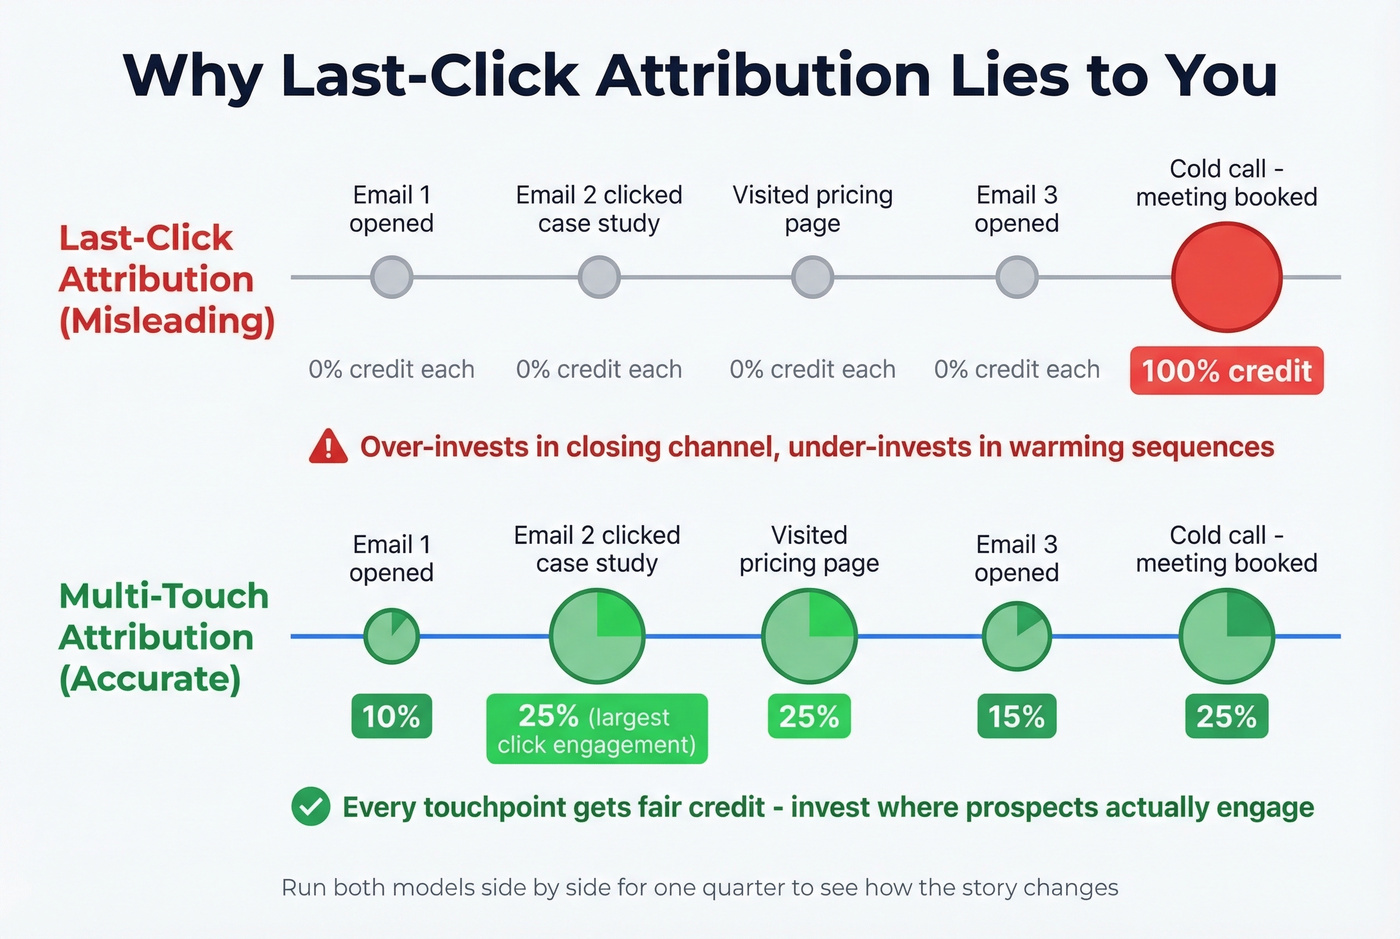
Use multi-touch attribution instead. Linear, time-decay, or data-driven models all beat last-click. Run them side by side for a quarter and you'll see how dramatically the story changes.
Mistake 2: Ignoring Data Quality
If 30% of your emails bounce, your reply rate is wrong. Your cost-per-meeting is wrong. Your campaign comparison is meaningless. You're making decisions based on a denominator that doesn't reflect reality.
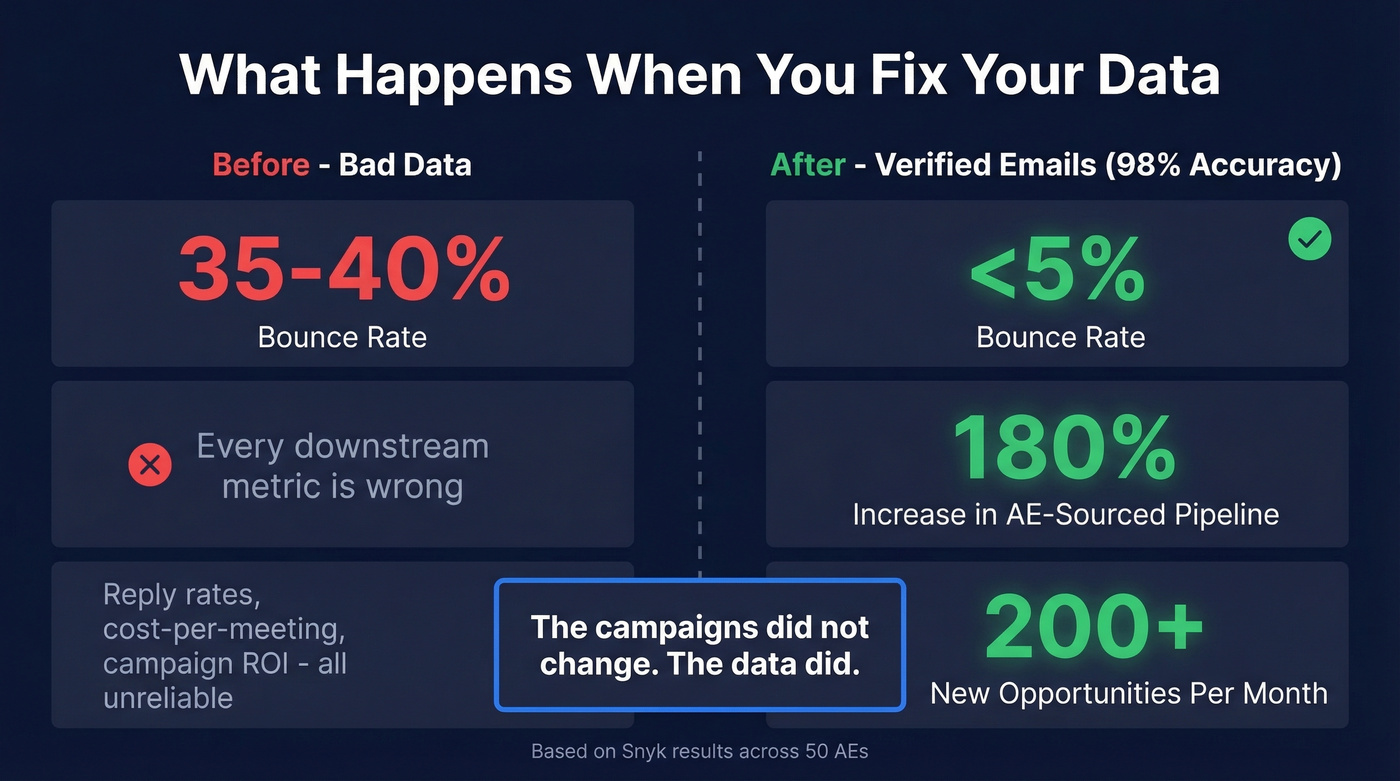
This happened at Snyk - their bounce rate was running 35-40% across 50 AEs. Once they fixed their data layer with verified email lists (98% accuracy, 7-day refresh cycle), bounce dropped under 5%. AE-sourced pipeline jumped 180%, generating 200+ new opportunities per month. The campaigns didn't change. The data did.
Mistake 3: Tracking Vanity Metrics
Opens without replies. Dials without connects. Emails sent without meetings booked. These activity metrics feel productive but tell you nothing about campaign effectiveness. Track the conversion between stages, not the raw activity numbers.
Mistake 4: No Cross-Device Stitching
A prospect reads your cold email on mobile, clicks through on desktop, and books a meeting via a calendar link in a follow-up. Without cross-device stitching, that meeting gets attributed to "direct" traffic. Google Ads conversion lookback windows max at 90 days, which misses plenty of B2B deals with longer cycles.
Mistake 5: Not Connecting Campaigns to Revenue
Teams track meetings booked per campaign but never close the loop to revenue won. A campaign that books 50 meetings at $200/meeting looks great - until you realize those meetings convert at 5% with $10k average deals. Meanwhile, the campaign that booked 15 meetings at $400/meeting converts at 30% with $50k deals. Without the revenue connection, you'd double down on the wrong one.
Let's be honest: most teams don't have a campaign performance problem. They have a campaign attribution problem. The data to make good decisions usually exists - it's just scattered across three tools with no common key. Fix attribution first, then optimize.
Best Tools for Tracking Campaign Performance
Every team needs coverage across four categories: data quality, CRM, sales engagement, and analytics. The right stack ties these layers together so campaign-level stats flow from sequence to pipeline to revenue without manual stitching.
| Tool | Category | Starting Price | Best For |
|---|---|---|---|
| Prospeo | Data Quality | Free tier; ~$0.01/email | Verified contact data |
| HubSpot Sales Hub | CRM | Free; from $20/user/mo | All-in-one tracking |
| Salesforce | CRM | From $25/user/mo | Enterprise reporting |
| Outreach | Engagement | ~$100-150/user/mo | Sequence analytics |
| Salesloft | Engagement | ~$100-150/user/mo | Enterprise sequences |
| Pipedrive | CRM | From $14/user/mo | Small team pipelines |
| Close | CRM | From $35/user/mo | Inside sales + calling |
| Looker Studio | Analytics/BI | Free | Custom CRM dashboards |
| Power BI | Analytics/BI | Free; Pro from ~$10/user/mo | Cross-source reporting |
Skip everything else if your data is bad. Prospeo sits in the data quality layer - the part most teams ignore until their metrics are already broken. It verifies emails at 98% accuracy with a 7-day refresh cycle, and CRM enrichment returns 50+ data points at an 83% match rate. At roughly $0.01 per email with a free tier, it's the cheapest insurance against the garbage-in problem described in Mistake #2.
For teams under 50 reps who want the fastest path to campaign analytics, HubSpot is a strong option - but you'll want to separate Sales Hub reporting from Campaigns reporting. HubSpot's campaign analytics, ROI settings, and attribution-model filtering live in Marketing Hub's tooling, while Sales Hub covers core sales activity and pipeline reporting. The free tier is genuinely usable for getting visibility fast, though it falls short on complex multi-touch attribution at enterprise scale. For small teams, HubSpot's free CRM paired with Looker Studio dashboards is hard to beat on value.
Salesforce Sales Cloud remains the enterprise default. The reporting engine is powerful but demands admin time. Budget for a RevOps hire if you're building campaign-level analytics dashboards from scratch.
For teams where outbound is the primary motion, Outreach is the gold standard for sequence-level analytics - A/B variants, reply rates by persona, step-level meeting attribution. Custom reporting lets you build views by sequence, persona, or territory so campaign comparisons don't require a separate BI tool. At roughly $100-150/user/month it isn't cheap, but the data justifies it. Salesloft competes at similar price points; enterprise buyers prefer its governance features, while growth-stage teams lean Outreach for flexibility.
At $14/user/month, Pipedrive gives small teams visual pipeline management without complexity. Close is the better pick for inside sales teams that want built-in calling. Looker Studio (free) and Power BI (free; Pro from ~$10/user/month) handle custom dashboards pulling from multiple sources - Looker for simplicity, Power BI for complex data models.
For teams that rely heavily on phone outreach, pairing a call review tool like Gong or Chorus with your CRM data lets you correlate call quality with campaign-level conversion rates - a layer of insight that email-only tracking misses entirely.
If you're building outbound from scratch, start with a tight B2B cold email sequence and a clear ideal customer profile so your tracking reflects real targeting, not random list pulls. And if you're standardizing your stack, use a shortlist of SDR tools to keep engagement + attribution clean.
Your contact rate formula is only as good as your contact data. Prospeo delivers 143M+ verified emails and 125M+ verified mobiles with a 30% pickup rate - so your CRM attribution stays clean from first touch to closed-won. At $0.01 per email, your cost-per-meeting drops before you even write the first sequence.
Clean data in, accurate campaign metrics out.
FAQ
What's the difference between sales and marketing campaign tracking?
Marketing campaign tracking follows impressions, clicks, and MQLs through demand gen channels. Sales campaign tracking starts at outbound activity - emails, calls, sequences - and follows the full journey through pipeline creation to closed revenue. The metrics, attribution models, and dashboards are fundamentally different, even when they share a CRM.
How often should I review campaign performance?
SDRs should check activity dashboards daily; managers review pipeline and conversion weekly; executives review campaign ROI monthly. Set automated alerts for anomalies - stalled deals, velocity drops, reply rate crashes - so problems surface between scheduled reviews. Match review cadence to your sales cycle length: shorter cycles warrant more frequent check-ins.
Why do my campaign metrics look inflated?
Bad contact data is almost always the culprit. If 30% of your emails bounce, your reply rate denominator is wrong and every downstream metric is overstated. Verifying your list before launching campaigns ensures comparisons reflect actual performance rather than data noise.
What tracking approach works best for agencies?
Agencies need a multi-client setup where each client's campaigns, tags, and attribution models are isolated but reportable in aggregate. Prefix every campaign tag with the client name, then build cross-client dashboards in Looker Studio or Power BI. This lets you benchmark performance across accounts while keeping each client's data clean.
Do I need separate tools for CRM reporting and campaign analytics?
Not necessarily. HubSpot, Salesforce, and Pipedrive all include native reporting that covers basic pipeline analysis. Teams outgrow native reporting when they need to blend CRM data with engagement platform data, call analytics, or enrichment sources - that's when a BI layer like Looker Studio or Power BI becomes essential for unified campaign-level views.