Sales Data Analytics: Why Most Teams Get It Wrong (and How to Fix It)
79% of sales organizations miss their forecast by more than 10%. That's not a rounding error - it's a structural failure in how teams collect, clean, and interpret their sales data. The downstream cost is brutal: poor data quality costs organizations an average of $12.9 million per year, per Gartner. Sales data analytics isn't about buying another dashboard. It's about getting the fundamentals right.
The Short Version
- Fix your data quality before buying another dashboard. No visualization tool can paper over garbage inputs.
- Track 3-5 metrics tied to revenue - not 15 vanity KPIs. Start with win rate, pipeline velocity, and conversion rate.
- Layer in AI only after your CRM data is clean. 84% of data and analytics leaders say AI outputs are only as good as data inputs.
What Sales Data Analytics Actually Means
At its core, this is the practice of collecting, processing, and interpreting sales performance data to make better decisions. It spans four types. Descriptive tells you what happened - last quarter's revenue by region. Diagnostic explains why - deal slippage in mid-market because reps lacked executive sponsors. Predictive forecasts what's likely based on historical patterns. Prescriptive recommends action, like reprioritizing pipeline toward accounts showing buying signals right now.
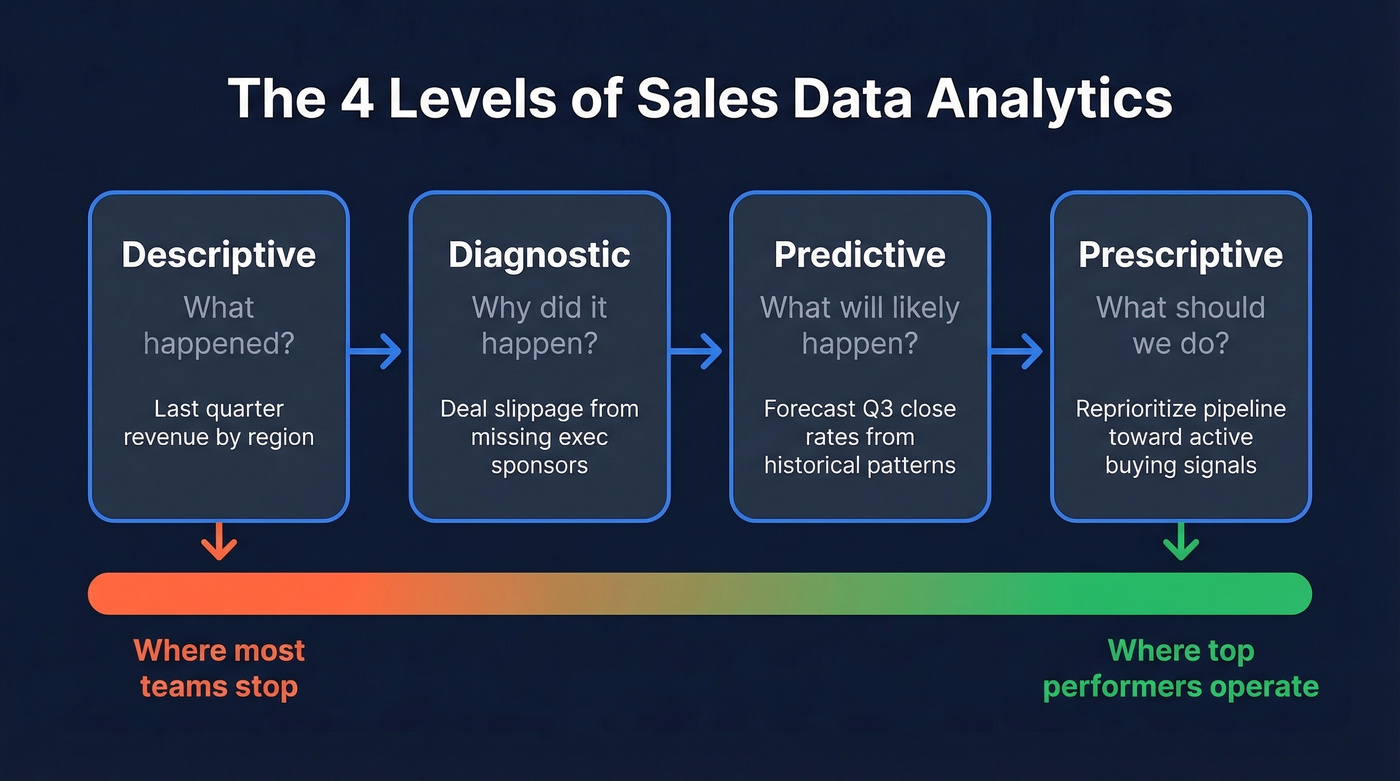
Most teams never get past descriptive. That's the problem.
Why Most Efforts Fail
The #1 pain point on r/SalesOperations is brutally simple: reps don't enter data. They skip fields, log vague notes, and move on. When your CRM is half-empty, every report built on top of it is fiction.
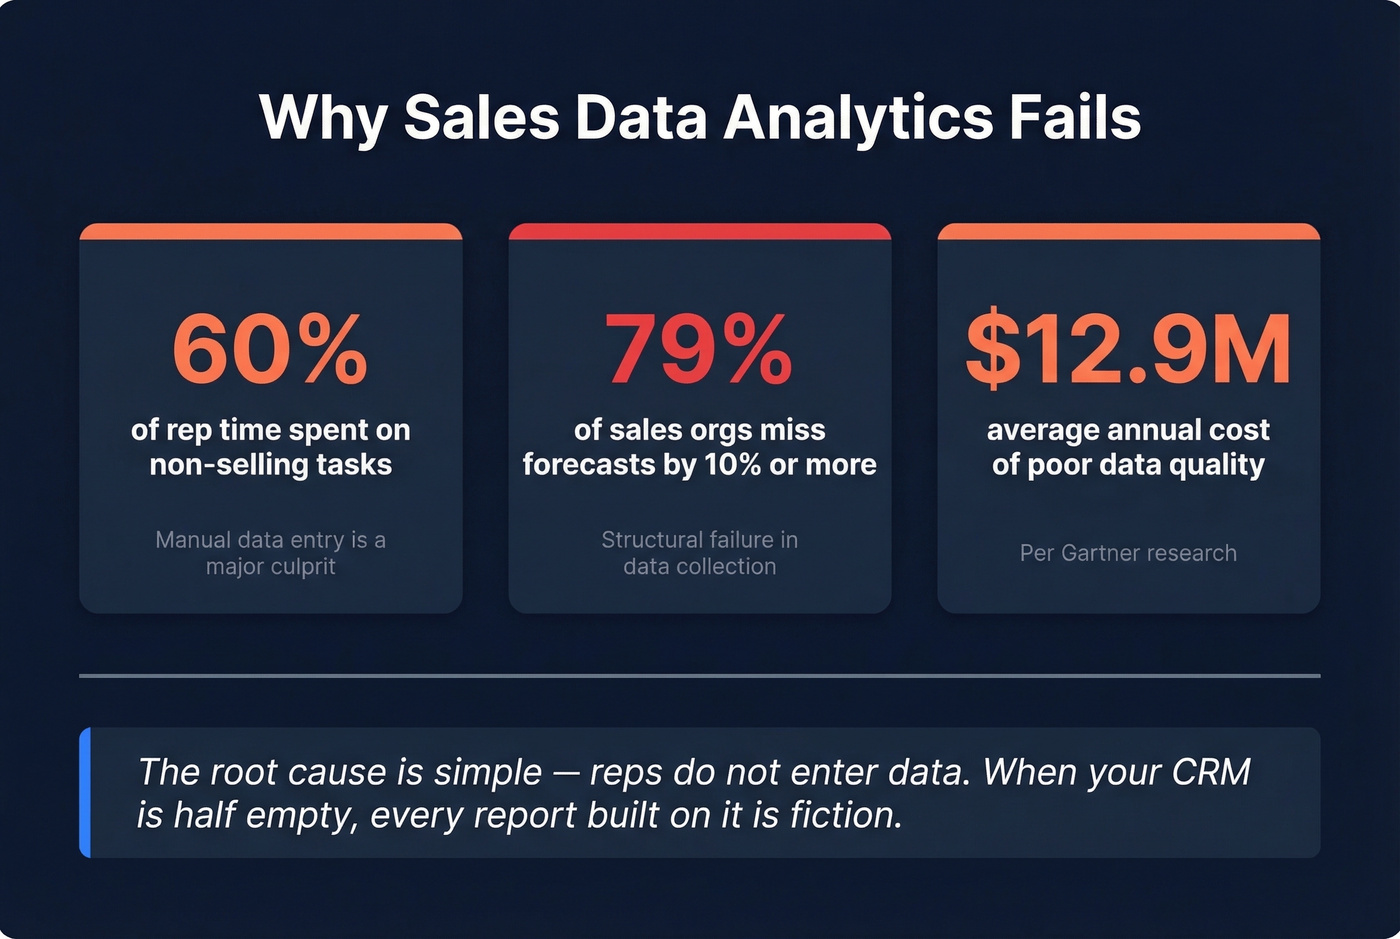
Reps spend 60% of their time on non-selling tasks, and manual data entry eats a big chunk of that. The people generating the data have every incentive to skip it, and the people analyzing it are working with half a picture. Worse, 73% of B2B buyers actively avoid sellers who send irrelevant outreach - so bad data doesn't just break your reports, it kills deals before they start.
In our experience, the teams that fix data quality first see results within one quarter. Conversation intelligence tools like Gong sit in many enterprise stacks precisely because they pull insights directly from call recordings when reps won't fill in CRM fields. But the best dashboard in the world fails if reps won't use it. Adoption is a change management problem, not a technology problem.
Here's the thing: your analytics pipeline starts with contact data. If emails bounce and phone numbers are disconnected, every downstream metric is compromised - activity metrics inflate, conversion rates deflate, and pipeline reports become unreliable. We've found that using Prospeo to verify emails at 98% accuracy and refresh records every 7 days keeps CRM data reflecting reality instead of last quarter's guesses.

The Metrics That Matter
Here's the contrarian take: pick 3-5 metrics. Ignore the rest until you've mastered those. We've seen teams build 20-metric dashboards that nobody opens after week two. Simplicity wins.
| Metric | Formula | Benchmark |
|---|---|---|
| Win Rate | Won / Total Deals | 47% under 50-day cycles |
| Pipeline Velocity | (Opps x Deal Size x Win%) / Cycle Days | See example below |
| Conversion Rate | Leads Converted / Total | ~2-5% B2B typical |
| CAC | Sales + Mktg Spend / New Customers | Ratio to LTV matters more |
| Sales Cycle Length | Avg days, first touch to close | 34% report 1-2 quarters |
Let's work through pipeline velocity with real numbers. Say you've got 50 qualified opportunities, $25K average deal size, a 30% win rate, and a 60-day average cycle. That's (50 x $25,000 x 0.30) / 60 = $6,250 in pipeline value generated per day. Now you know exactly which lever to pull - more opportunities, bigger deals, higher win rate, or shorter cycles.
The win rate benchmark is worth internalizing: deals that close within 50 days show a 47% win rate. Beyond 50 days, that drops to roughly 20%. Speed isn't just an efficiency play - it's a conversion play.
If your average sales cycle exceeds 90 days and your ACV is under $25K, you don't have an analytics problem. You have a qualification problem. No amount of dashboarding fixes a leaky top of funnel. (If you want a tighter framework, start with MEDDIC qualification.)
Every metric in your sales analytics dashboard depends on clean contact data. Prospeo refreshes 300M+ profiles every 7 days - not every 6 weeks - so your pipeline velocity, conversion rates, and win rate calculations reflect reality. At 98% email accuracy and $0.01 per lead, you stop inflating activity metrics with bounced emails and disconnected numbers.
Stop building dashboards on data that expired last month.
Building Your Sales Intelligence Dashboard
Build in this order. Each step requires the previous one to be working.
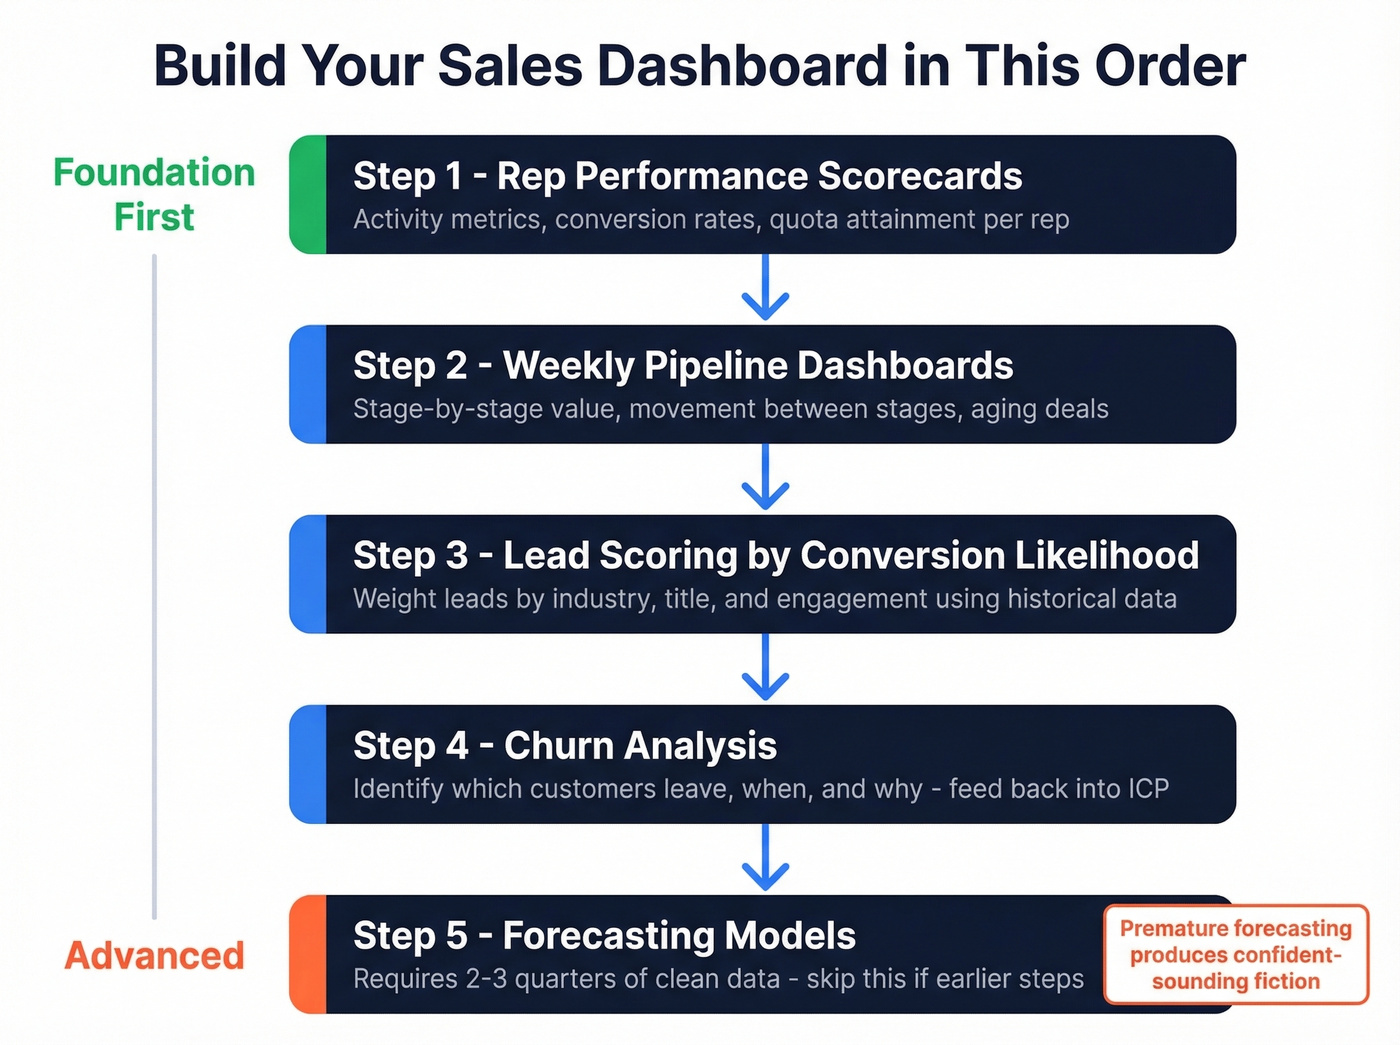
Start with rep performance scorecards. Activity metrics, conversion rates, and quota attainment per rep. We recommend starting here because scorecards are the fastest path to coaching insights. From there, add weekly pipeline dashboards showing stage-by-stage pipeline value, movement between stages, and aging deals. Review these in your Monday forecast call.
Once those are solid, layer in lead scoring by conversion likelihood. Use historical conversion data to weight leads - even a simple model using industry, title, and engagement beats treating every lead equally. Then add churn analysis to identify which customers leave, when, and why, feeding that back into your ICP definition.
Forecasting models come last. They require clean data and at least 2-3 quarters of consistent tracking to produce anything useful. Skip this if you haven't nailed the previous steps - premature forecasting just produces confident-sounding fiction. (If you need options, compare sales forecasting solutions.)
The Revenue Analytics Tool Stack
| Tool | Best For | Starting Price |
|---|---|---|
| Salesforce Sales Cloud | Enterprise CRM analytics | From $25/user/mo |
| HubSpot Sales Hub | SMB CRM + reporting | Free; paid from ~$20/user/mo |
| Pipedrive | Small teams, simple pipeline | From $14/user/mo |
| Tableau | Advanced BI / visualization | From $15/user/mo |
| Power BI | Budget BI / Microsoft shops | From $10/user/mo |
| Gong | Conversation intelligence | ~$100-200+/user/mo |
| Clari | Revenue intelligence | ~$30K-100K+/yr |
Your analytics tools are only as good as the data feeding them. A data enrichment tool that refreshes records weekly helps ensure your pipeline metrics and conversion rates reflect what's happening in the field - not what happened six weeks ago.
Mistakes That Kill Your Analytics
Not automating lead capture. Manual entry means delayed follow-up and typos that cascade through every report. A third of companies still move data manually. Missing lead-source data is equally destructive - if you can't attribute where a deal came from, you can't double down on what works. (This is where a tighter lead generation workflow pays off.)
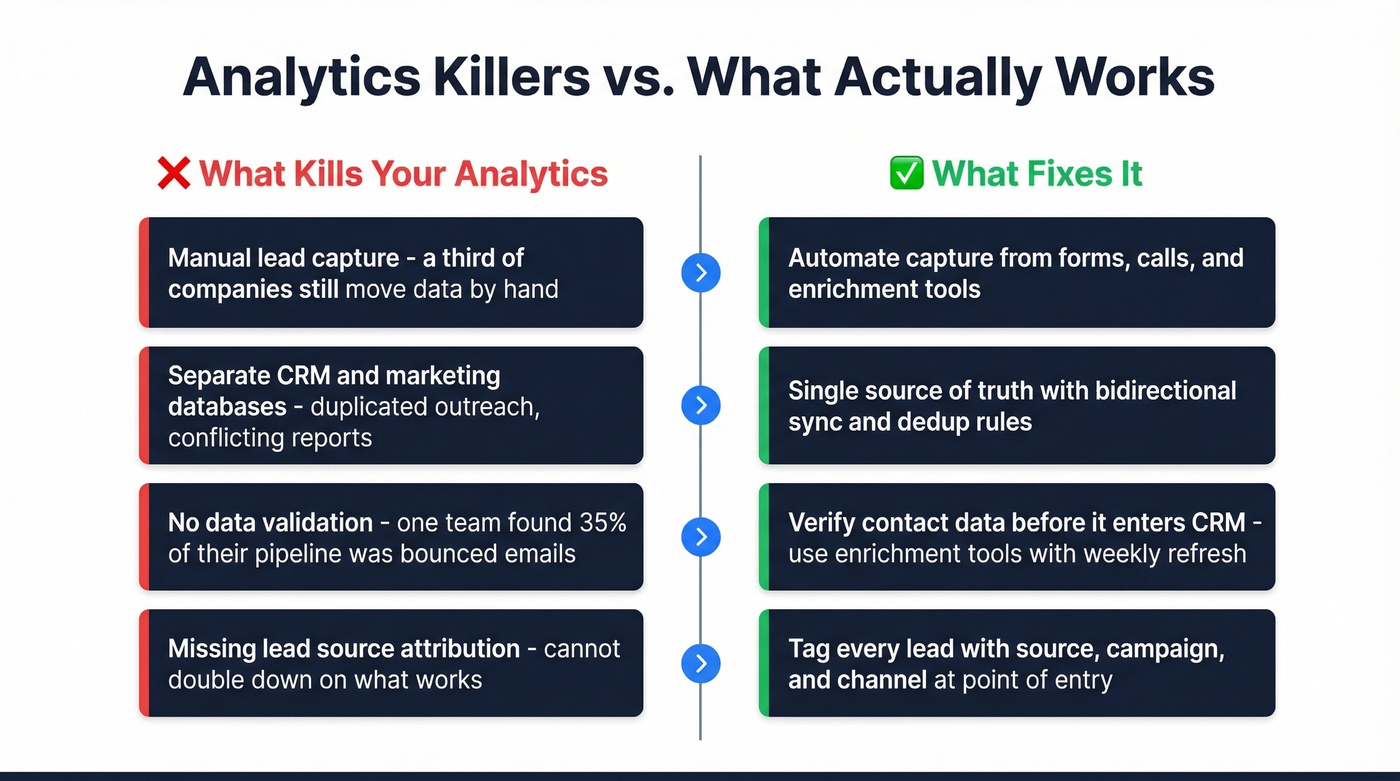
Running separate CRM and marketing databases. This leads to duplicated outreach and conflicting reports. One-way sync integrations break silently, and qualified leads get stuck in limbo for weeks. Ignoring duplicate records inflates pipeline counts and makes forecasts meaningless, which is exactly the opposite of what your leadership team needs when they're making headcount and budget decisions.
Skipping data validation entirely. Look - if you're not verifying contact data before it enters your CRM, you're building analytics on sand. One team we spoke with discovered that 35% of their "active pipeline" consisted of bounced emails and disconnected numbers. Their real pipeline was a third smaller than what the dashboard showed.
Where Sales Analytics Is Heading in 2026
The AI hype is meeting reality. 74% of sales teams using AI are prioritizing data hygiene first - because feeding messy CRM data into a model just produces confident-sounding garbage. Outreach reports that deals supported by AI close 11 days faster on average, but only when the underlying data is clean.
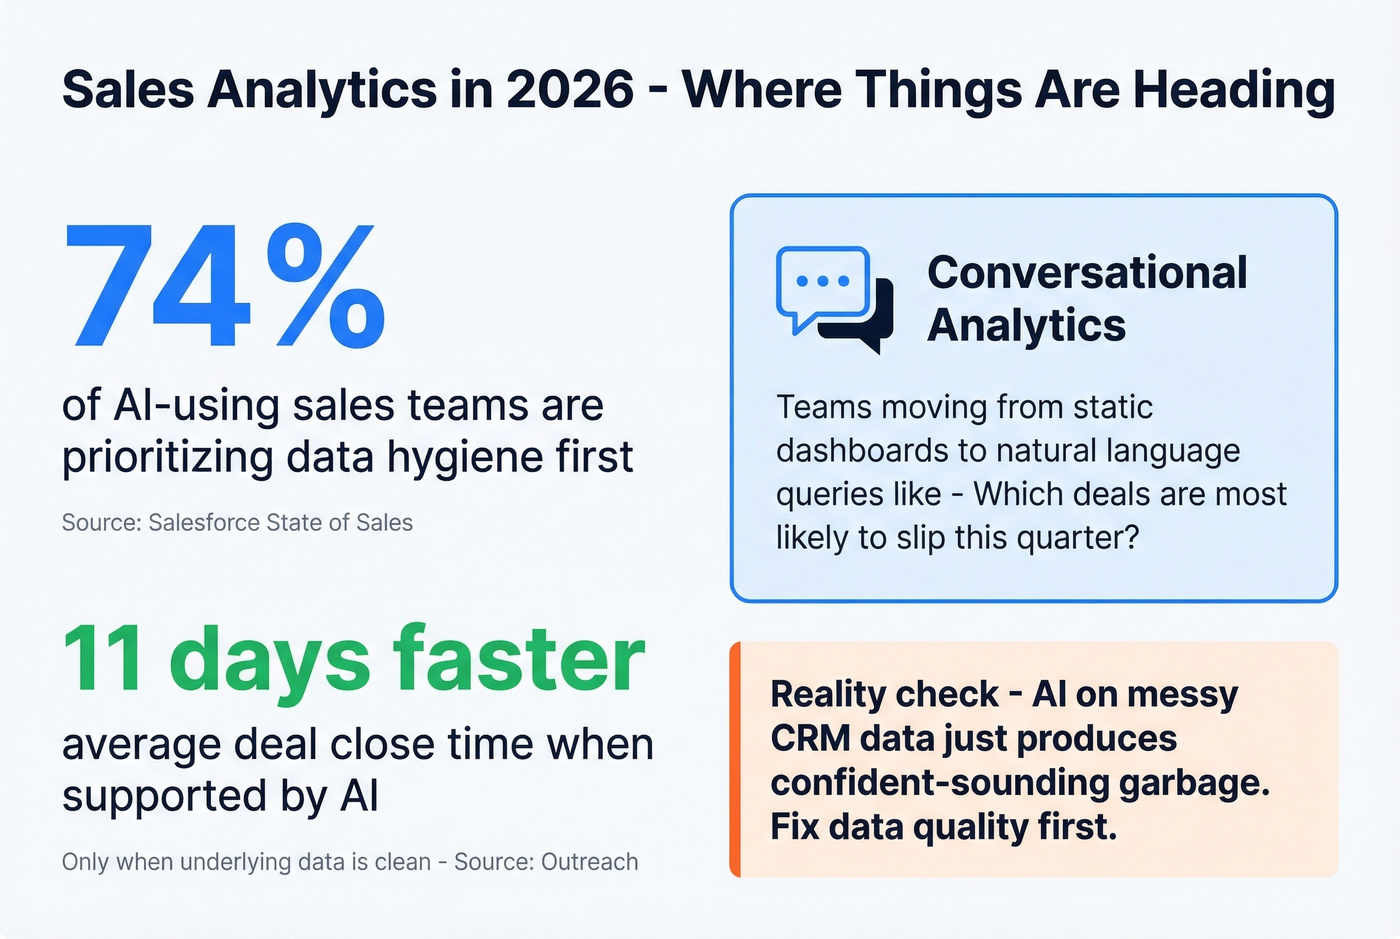
The other shift worth watching: conversational analytics. Teams are moving from static dashboards to natural language querying - asking "which deals are most likely to slip this quarter?" instead of building a Tableau view. Within the next year or two, this will be standard for mid-market and up.
Bad data costs organizations $12.9M per year. Prospeo's 5-step verification and weekly refresh cycle eliminate the stale records that corrupt your CRM, break your forecasts, and deflate your conversion rates. 15,000+ sales teams already trust it to keep their analytics pipeline clean.
Fix the foundation before you buy another dashboard.
FAQ
What's the difference between sales analytics and sales intelligence?
Sales analytics examines performance data - win rates, pipeline velocity, conversion rates - to improve decisions. Sales intelligence gathers external prospect and market data to fuel outreach. They're complementary: intelligence feeds the data that analytics interprets, and a well-built sales intelligence dashboard brings both views together.
Which metrics should a small team track first?
Win rate, average sales cycle length, and lead-to-opportunity conversion rate. These three tie directly to revenue and are measurable with a basic CRM. Add pipeline velocity once you've got 2-3 quarters of clean data to calculate it reliably.
How do you fix bad CRM data before running analytics?
Automate lead capture to eliminate manual entry errors, deduplicate records monthly, and use a data enrichment tool to verify and refresh contact data on a recurring basis. Clean data is the prerequisite, not the afterthought.