Stop Tracking 30 Sales Metrics. You Need These 9.
69% of reps missed quota last year - and quotas were already cut 19%. Without that reduction, 79% would've missed. The problem isn't effort. Teams are drowning in dashboards full of numbers that don't connect to outcomes. We've watched orgs track 30+ sales effectiveness metrics and still miss forecast by 20%.
Here are the nine metrics that actually diagnose whether your sales motion is working, with formulas, benchmarks, and the measurement mistakes that make the rest of your data useless.
If your VP just asked for a dashboard, start with three: win rate, pipeline coverage, and sales efficiency ratio. Everything else is supporting detail.
Why These Metrics Hit Different in 2026
The B2B buying process looks nothing like it did three years ago. A Gartner survey of 646 buyers found 67% prefer a rep-free experience, 45% used AI during a recent purchase, and the average deal now involves 13 decision-makers. Confident buyers are 2x as likely to report a high-quality deal - which means your metrics need to reflect execution quality, not just activity volume.
Gartner's top three CSO priorities for 2026 all center on measurement: building an AI roadmap tied to outcomes, transforming GTM motions, and maximizing sales manager impact. The old playbook of tracking call volume and meetings booked doesn't capture any of this. Redefining sales success metrics around buyer confidence and deal quality is the shift most orgs still haven't made.
Effectiveness vs. Efficiency vs. Productivity
These three get conflated constantly. They're not the same thing.
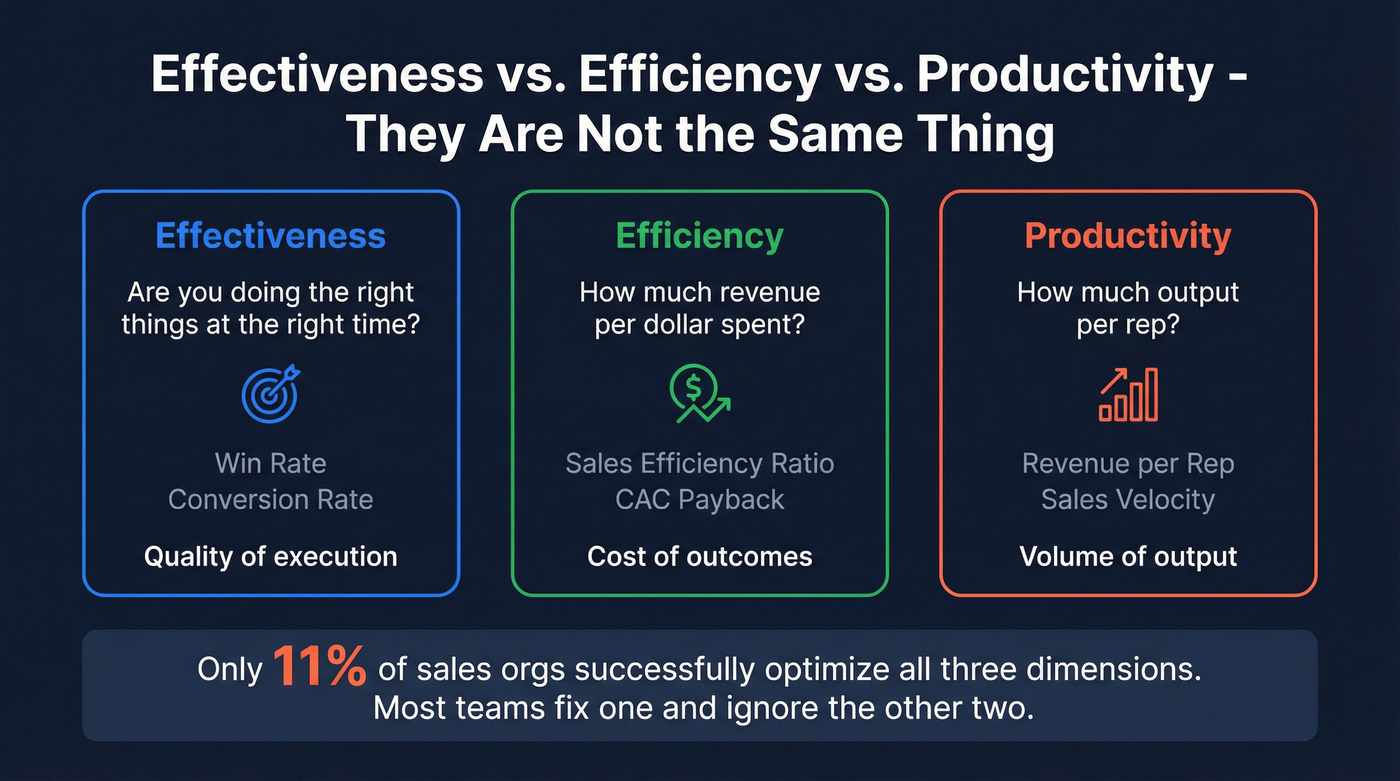
| Concept | What It Measures | Example Metric |
|---|---|---|
| Effectiveness | Right tasks, right time | Win rate, conversion |
| Efficiency | Revenue per dollar spent | Sales efficiency ratio |
| Productivity | Output per rep | Revenue per rep, velocity |
Only 11% of sales orgs successfully drive commercial success while executing transformations. Most teams optimize one dimension and ignore the other two. Understanding how to measure sales effectiveness as a distinct discipline - separate from efficiency and productivity - is the first step toward fixing that.
The 9 Metrics That Matter
Quota Attainment
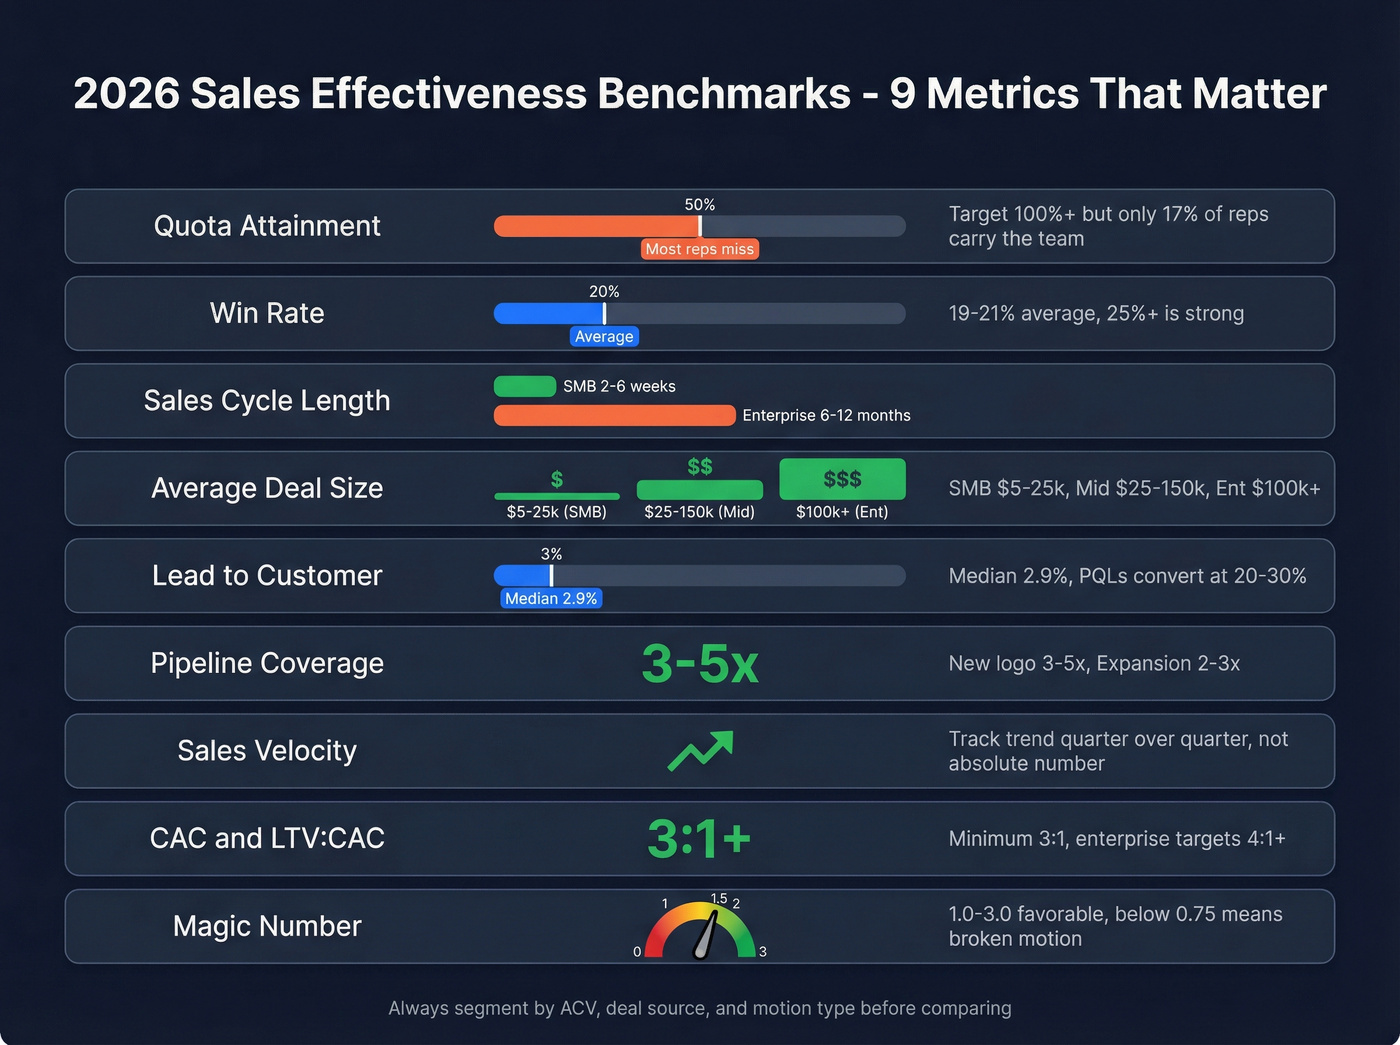
(Closed revenue / Quota) x 100. Fewer than 50% of reps have met quota consistently since 2017. And 17% of reps generate 81% of revenue. Your team average is lying to you - segment by cohort, tenure, and territory. Benchmark quota-to-OTE ratio at 4-6x, with commission rates around 10%.
Win Rate
Won deals / Total opportunities. The 19-21% B2B average masks huge variance. Enterprise deals with ACV above $100k sit at 17%, down from 26% in 2022. Track by segment and deal source - inbound win rates are often 2x outbound. Of all the metrics available, win rate most directly reflects execution quality at the rep level.
Sales Cycle Length
Average days from first touch to close. Mid-market cycles are up 24-32%; enterprise up to 36%. If you're not tracking this by segment, you can't forecast accurately. SMB typically runs 2-6 weeks; enterprise stretches 6-12 months.
Average Deal Size
Total revenue / Deals closed. PLG deals and sales-led deals have completely different profiles - blending them hides whether your expansion motion is working or your new-logo ACV is shrinking. Rough ranges: SMB $5-25k, mid-market $25-150k, enterprise $100k+.
Lead-to-Customer Conversion
If your coverage looks healthy but win rates are dropping, you've got a quality problem, not a volume problem. Median B2B SaaS conversion is 2.9%, with the biggest drop-off at MQL-to-SQL around 15%. PQLs convert at 20-30% vs. MQLs at roughly 6% - one of the strongest arguments for a product-led motion.
Pipeline Coverage Ratio
Qualified pipeline / Revenue target. New logo needs 3-5x coverage; expansion 2-3x. This is the metric that catches forecast problems earliest. When coverage looks strong but close rates are falling, stop adding top-of-funnel and fix stage progression.
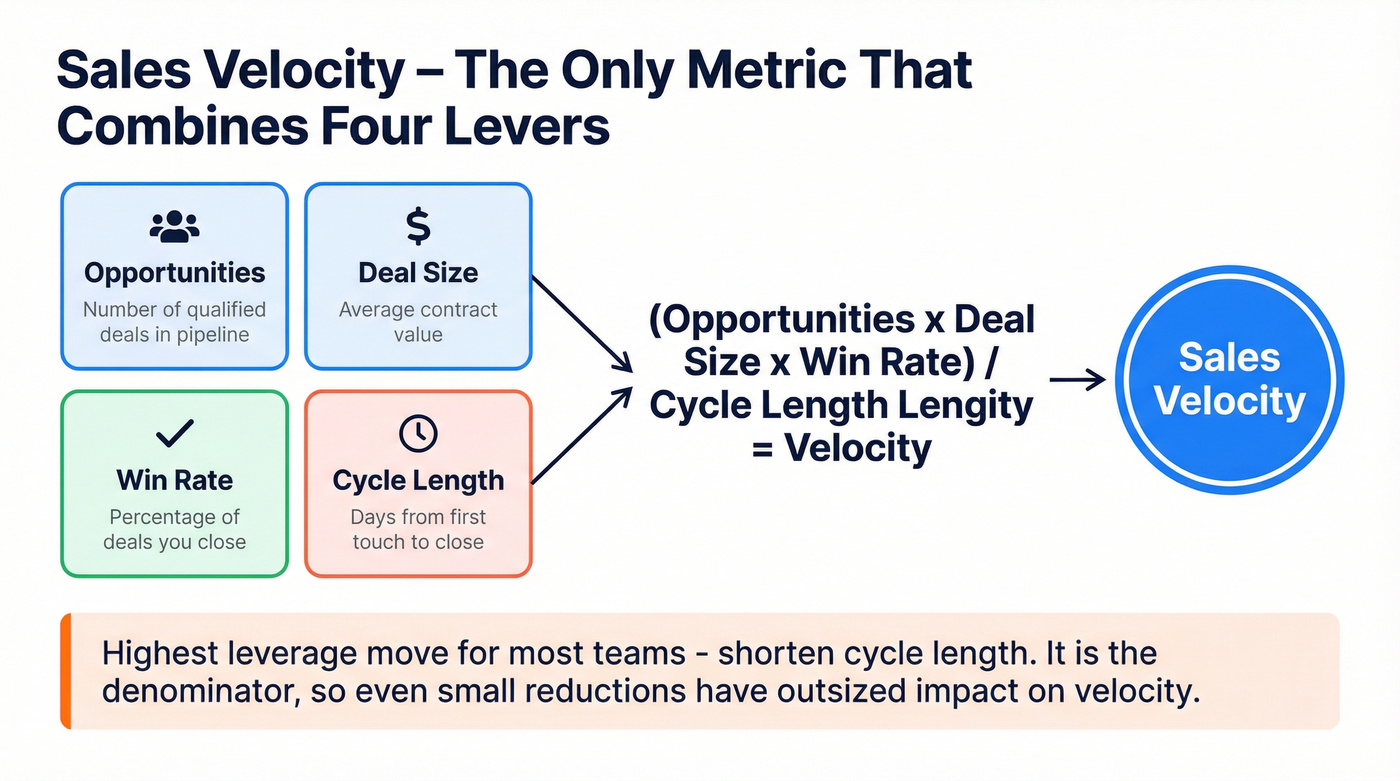
Sales Velocity
This is the only metric that combines four levers into one number: (Opportunities x Deal size x Win rate) / Cycle length. Improve any input and velocity goes up - but shortening cycle length is the highest-leverage move for most teams. On r/salestechniques, practitioners push for even more granular versions like deal velocity per stage and revenue per rep hour.
CAC and LTV:CAC Ratio
Total S&M spend / New customers. Median New CAC Ratio is $2.00 - you spend $2 in sales and marketing to acquire $1 in new ARR. LTV:CAC minimum is 3:1; enterprise targets 4:1+. CAC payback under 18 months is standard; elite PLG companies hit under 12.
Sales Efficiency Ratio (Magic Number)
Net New ARR / S&M Spend. A ratio of 1.0 means break-even; 1.0-3.0 is favorable. Below 1.0, you're burning cash. Worked example: spend $1M on S&M, generate $1.5M in net new ARR, and your Magic Number is 1.5x - healthy territory. This is one of the metrics your board cares about most.
Here's the thing: if your Magic Number is below 0.75 for two consecutive quarters, your go-to-market motion is broken. No amount of metric tracking fixes a fundamentally uneconomic sales model. Fix the motion first, then measure it.
Win rate and sales velocity both depend on reaching real decision-makers. When 35% of your emails bounce, every metric downstream is corrupted. Prospeo delivers 98% email accuracy and 125M+ verified mobiles - so your reps spend time selling, not chasing bad data.
Clean data is the input that fixes every output metric.
Benchmark Reference Table
| Metric | Good Range | Segment By |
|---|---|---|
| Quota Attainment | >100% (top 17% of reps) | Tenure, territory |
| Win Rate | 19-21% avg; 25%+ strong | ACV, deal source |
| Cycle Length | SMB 2-6w; Ent 6-12mo | Segment |
| Avg Deal Size | SMB $5-25k; Ent $100k+ | PLG vs. sales-led |
| Lead-to-Customer | 2-5% (median 2.9%) | Channel |
| Pipeline Coverage | New 3-5x; Expand 2-3x | Deal type |
| Sales Velocity | Track trend, not absolute | Segment |
| CAC / LTV:CAC | LTV:CAC 3:1+ | Motion |
| Magic Number | 1.0-3.0 | Quarterly trend |
Using Benchmarks Without Getting Burned
Benchmarks only matter when they're segmented. A win rate of 22% - is that good? For enterprise SaaS, that's above average. For transactional SMB, it's probably terrible. The key is comparing your numbers against the right peer set, then tracking directional movement quarter over quarter. Companies that layer segmented benchmarks on top of these nine sales effectiveness metrics consistently outperform teams relying on blended averages.
Three Mistakes That Corrupt Your Data
Gaming Activity Metrics
The r/sales community nails this one: when you only track activity volume, reps optimize for the metric instead of the outcome. The fix is tension metrics - balance quality, time, and cost. "How many meetings proceed to a second call?" tells you more than meetings booked ever will.
Metrics Without Benchmarks
A metric without a benchmark is just a number on a screen. Without segmented benchmarks, your quota attainment numbers tell you nothing about whether your team is healthy or dangerously top-heavy. Skip the vanity dashboard and build one that compares against your actual peer set.
Bad Data In, Bad Metrics Out

Every formula above depends on accurate CRM data. If contact records are outdated, conversion rates are artificially low, pipeline coverage is inflated with unreachable prospects, and sales velocity is distorted by phantom opportunities. In our experience, teams that fix data quality first see their other metrics stabilize within one quarter - sometimes faster. Prospeo's CRM enrichment returns 50+ data points per contact on a 7-day refresh cycle, which means your pipeline numbers actually reflect reality instead of stale records from six months ago.
Let's be honest: most "metric problems" are actually data problems wearing a trench coat.
Your Magic Number tanks when reps burn S&M budget on contacts that never connect. Prospeo's data refreshes every 7 days - not 6 weeks - at $0.01 per email. Teams using Prospeo book 26% more meetings than ZoomInfo users, directly improving CAC and pipeline coverage.
Stop measuring a broken motion. Fix the data feeding it.
Who Tracks What
| Cadence | Role | Metrics |
|---|---|---|
| Daily | Rep | Activity + pipe hygiene |
| Weekly | Manager | Coverage, win rate, velocity |
| Monthly | VP/Director | CAC, efficiency, conversion |
| Quarterly | Exec/Board | LTV:CAC, Magic Number, quota trend |
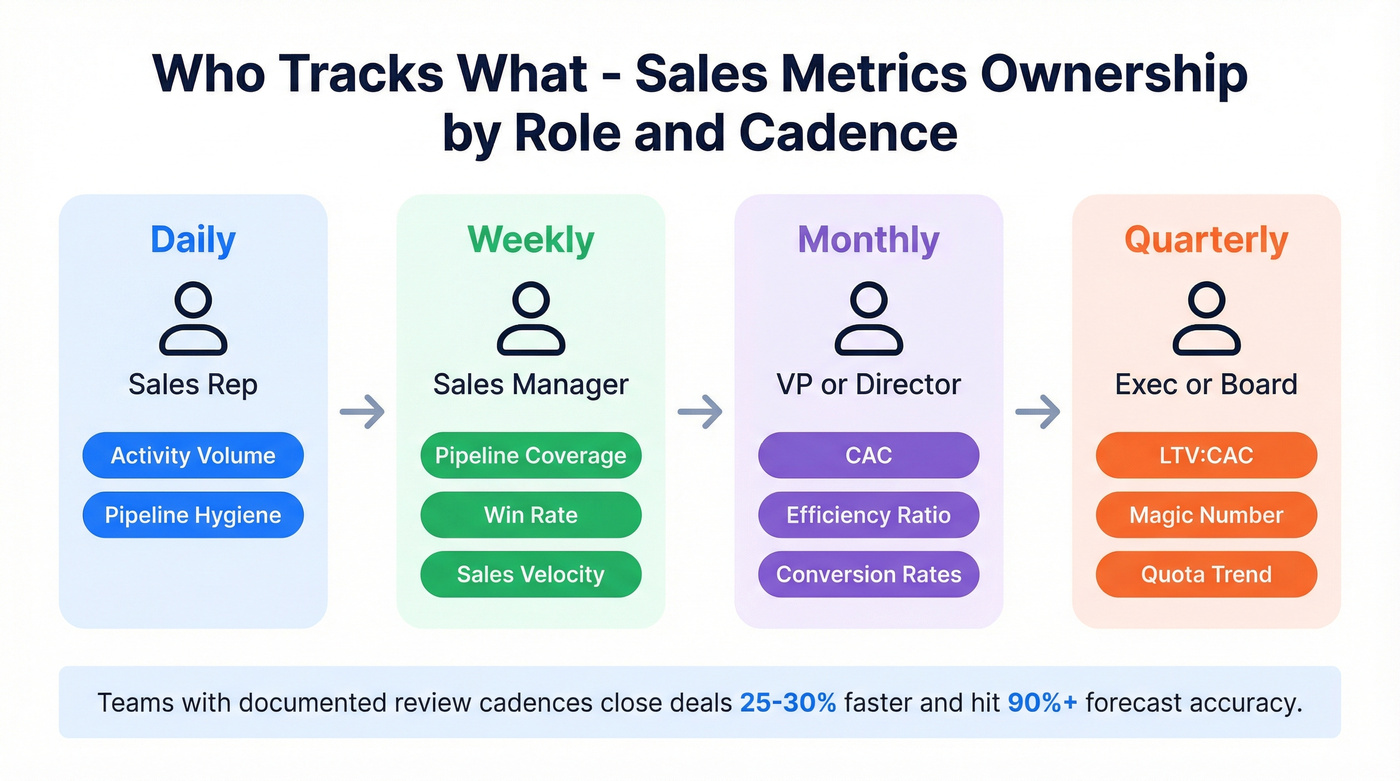
Companies with documented sales ops strategies close deals 25-30% faster and achieve 90%+ forecast accuracy. The difference isn't the metrics themselves - it's having a clear owner and review cadence for each one.
What we deliberately left out: CRM adoption rate and sales enablement metrics like content usage and training completion matter, but they're leading indicators of process health, not direct effectiveness measures. Track them operationally; keep them off the executive dashboard.
FAQ
What's the difference between sales effectiveness and sales efficiency?
Effectiveness means doing the right things - win rate, deal progression, conversion quality. Efficiency means doing them cheaply - revenue per dollar of S&M spend. You need both. Focus on outcome quality first, then layer in cost metrics like the Magic Number to get the full picture.
How many metrics should a team actually track?
Eight to ten core metrics with segmented benchmarks cover the full sales motion. Most teams track 20-30 and understand none of them. Start with win rate, pipeline coverage, and sales efficiency ratio, then expand as your reporting matures.
How do I fix bad CRM data before building dashboards?
Run your contacts through an enrichment tool with a short refresh cycle. Teams like Snyk cut bounce rates from 35-40% to under 5% after switching to weekly-refreshed data, which immediately made their pipeline and conversion metrics trustworthy. Flag stale records before you build reporting on top of them.