Sales Enablement Evaluation: How to Actually Prove Your Program Works
Your CRO just asked for the ROI on your enablement program. You pull up the dashboard, and all you've got is completion rates and a content library nobody opens. The sales enablement platform market is projected to hit $8.79B by 2029, but most teams still can't answer the question every sales enablement evaluation should start with: is any of this working?
Here's the uncomfortable truth. One enablement practitioner described reps needing 7-20 clicks just to find info, engagement with enablement materials is abysmal across most orgs, and leadership is right to be skeptical of vendor-supplied ROI claims. If your evaluation framework doesn't connect training to deal outcomes, it's a survey, not an assessment.
The Only Question Your Assessment Must Answer
Enablement is typically measured by completion rates or content usage. Neither tells you whether reps changed how they sell. A rep can score 95% on a MEDDIC quiz and still fill out CRM fields to make their manager happy without ever using the framework to qualify a deal - the r/sales community calls this out constantly, describing methodologies that become "CRM exercises disguised as a sales methodology," where reps treat qualification as paperwork rather than a thinking tool.
The only question that matters: did reps change their behavior in live deals, and did that change move revenue?
A useful lens is a 6-level scoring rubric. Level 1 is "don't have it." Level 6 is "team uses it with development support, integrated into all sales management layers." In our experience, most programs stall at Level 3 - compliance, not adoption.
Sales Enablement Maturity Model
Before you improve anything, you need to know where you are. This 4-stage model is adapted from Brevet's framework, scored across five dimensions.
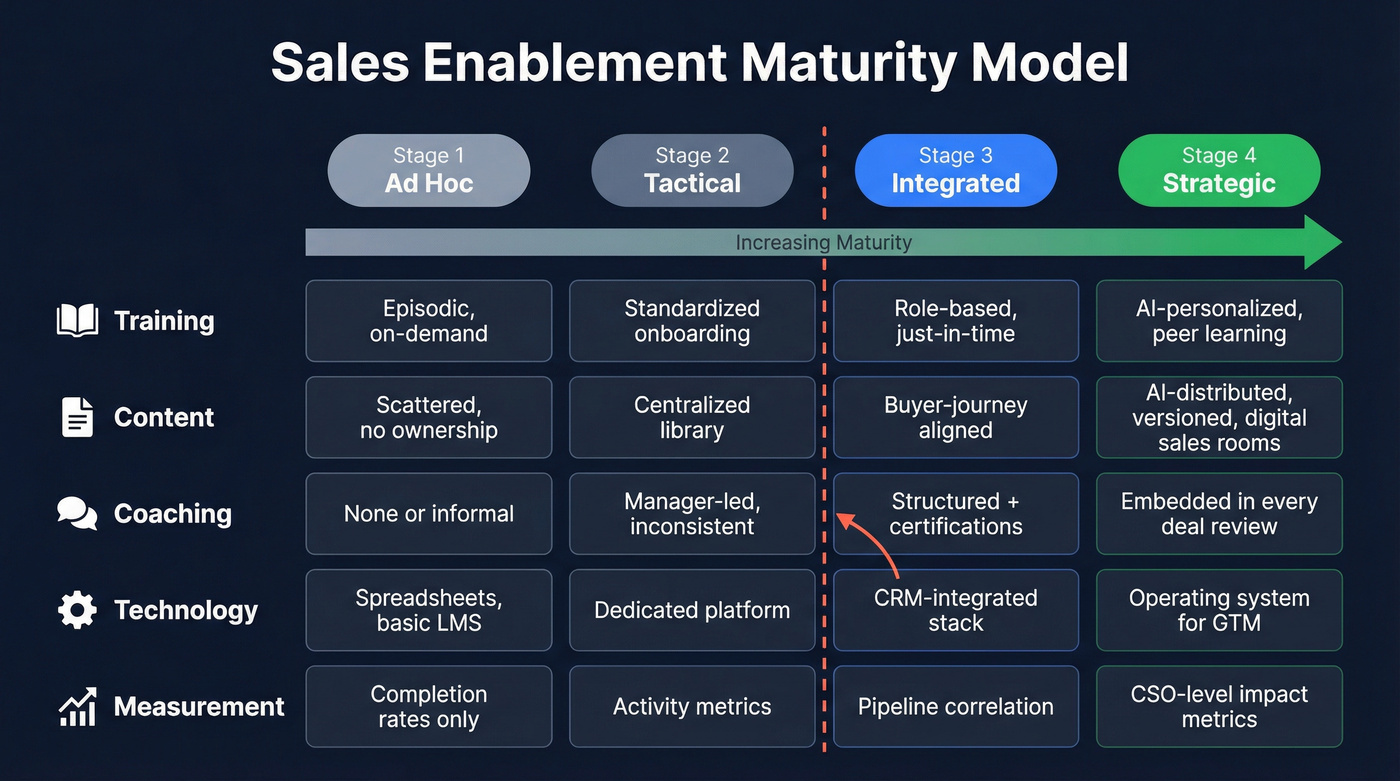
| Dimension | Ad Hoc | Tactical | Integrated | Strategic |
|---|---|---|---|---|
| Training | Episodic, on-demand | Standardized onboarding | Role-based, just-in-time | AI-personalized, peer learning |
| Content | Scattered, no ownership | Centralized library | Buyer-journey aligned | AI-distributed, versioned, digital sales rooms |
| Coaching | None or informal | Manager-led, inconsistent | Structured + certifications | Embedded in every deal review |
| Technology | Spreadsheets, basic LMS | Dedicated platform | CRM-integrated stack | Operating system for GTM |
| Measurement | Completion rates only | Activity metrics | Pipeline correlation | CSO-level impact metrics |
If your CRO calls enablement "the training team," you're not past Stage 2. Strategic programs function as performance consulting - enablement metrics sit in the same dashboards the CSO reviews.
How to assess where you sit: Survey your reps and customers directly. Have reps score each dimension 1-10, then average across the team. Layer in customer feedback on rep preparedness and content relevance. The gap between self-assessment and customer perception is where your biggest opportunities hide. Copy this framework into a Google Sheet, score each dimension, and you'll have a shareable diagnostic in 30 minutes.
Metrics That Connect to Revenue
The Kirkpatrick model maps enablement metrics to business outcomes. It's time-intensive and doesn't isolate external variables, but it's still the best starting framework we've found.
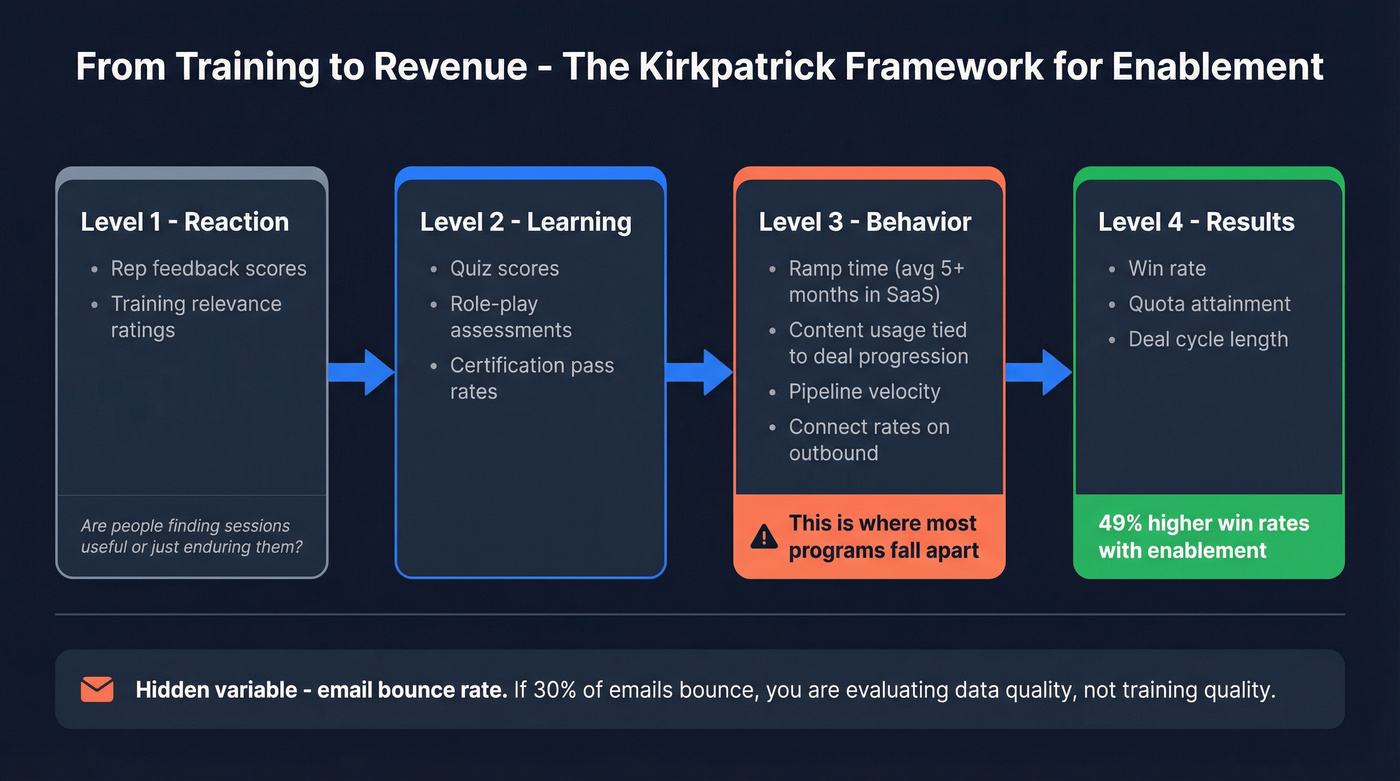
Reaction - rep feedback scores on training relevance. Are people finding sessions useful, or just enduring them?
Learning - quiz scores, role-play assessments, certification pass rates.
Behavior - this is where most programs fall apart. Track ramp time (the average SaaS rep takes 5+ months), content usage correlated to deal progression, pipeline velocity, and connect rates on outbound. If you're only measuring the first two levels, you're grading homework, not performance.
Results - win rate, quota attainment, deal cycle length. Organizations with enablement strategies achieve 49% higher win rates on forecasted deals.
One metric teams overlook: email bounce rate on outbound sequences. If 30% of your emails bounce, you're evaluating data quality, not training quality. Prospeo's 98% email accuracy and 7-day refresh cycle fix this upstream so your connect rate metrics actually reflect rep skill.
Let's be honest about scope, though. If your average deal size is under $15K and your team has fewer than 20 reps, a full Kirkpatrick evaluation is overkill. Track ramp time, win rate, and bounce rate. That's it. The overhead of a full framework will eat more productivity than it saves.
Cadence that works: Weekly pipeline reviews with an enablement lens. Monthly metric reviews on leading indicators. Quarterly program assessments against your maturity model. Annual evaluations are post-mortems - they catch problems months too late.
You can't evaluate rep performance when 30% of emails bounce. Prospeo's 98% email accuracy and 7-day refresh cycle remove data quality as a variable - so your enablement metrics actually measure what reps do, not whether contacts exist.
Stop grading reps on bad data. Start with emails that land.
ROI Math You Can Show Leadership
Two scenarios your CFO can evaluate.
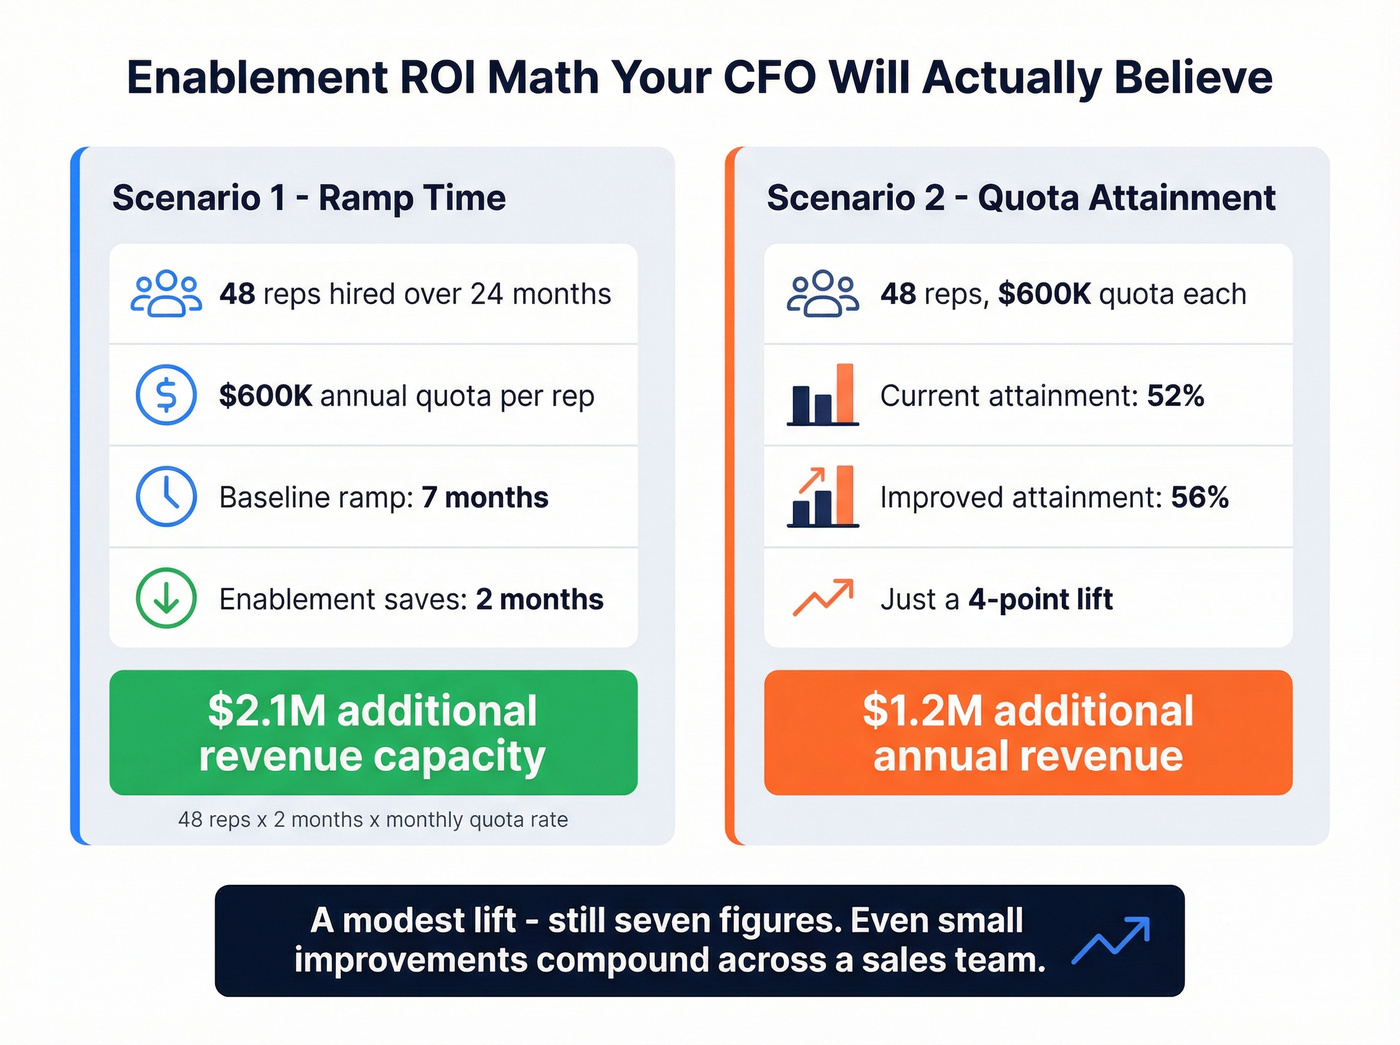
Scenario 1: Ramp time. 48 reps hired over 24 months, each carrying a $600K annual quota. Baseline ramp is 7 months. If enablement shaves 2 months off that ramp, those reps start producing sooner: 48 reps x 2 months of earlier production = roughly $2.1M in additional revenue capacity across the cohort. Full methodology in the GTMnow analysis.
Scenario 2: Quota attainment. Same 48 reps, same $600K quota. Average attainment sits at 52%. A 4-point improvement to 56% yields about $1.2M in additional annual revenue.
A modest lift - still seven figures. Show leadership the inputs and let them adjust the numbers. The conclusion holds either way: even small improvements compound across a sales team.
Evaluating Enablement Technology
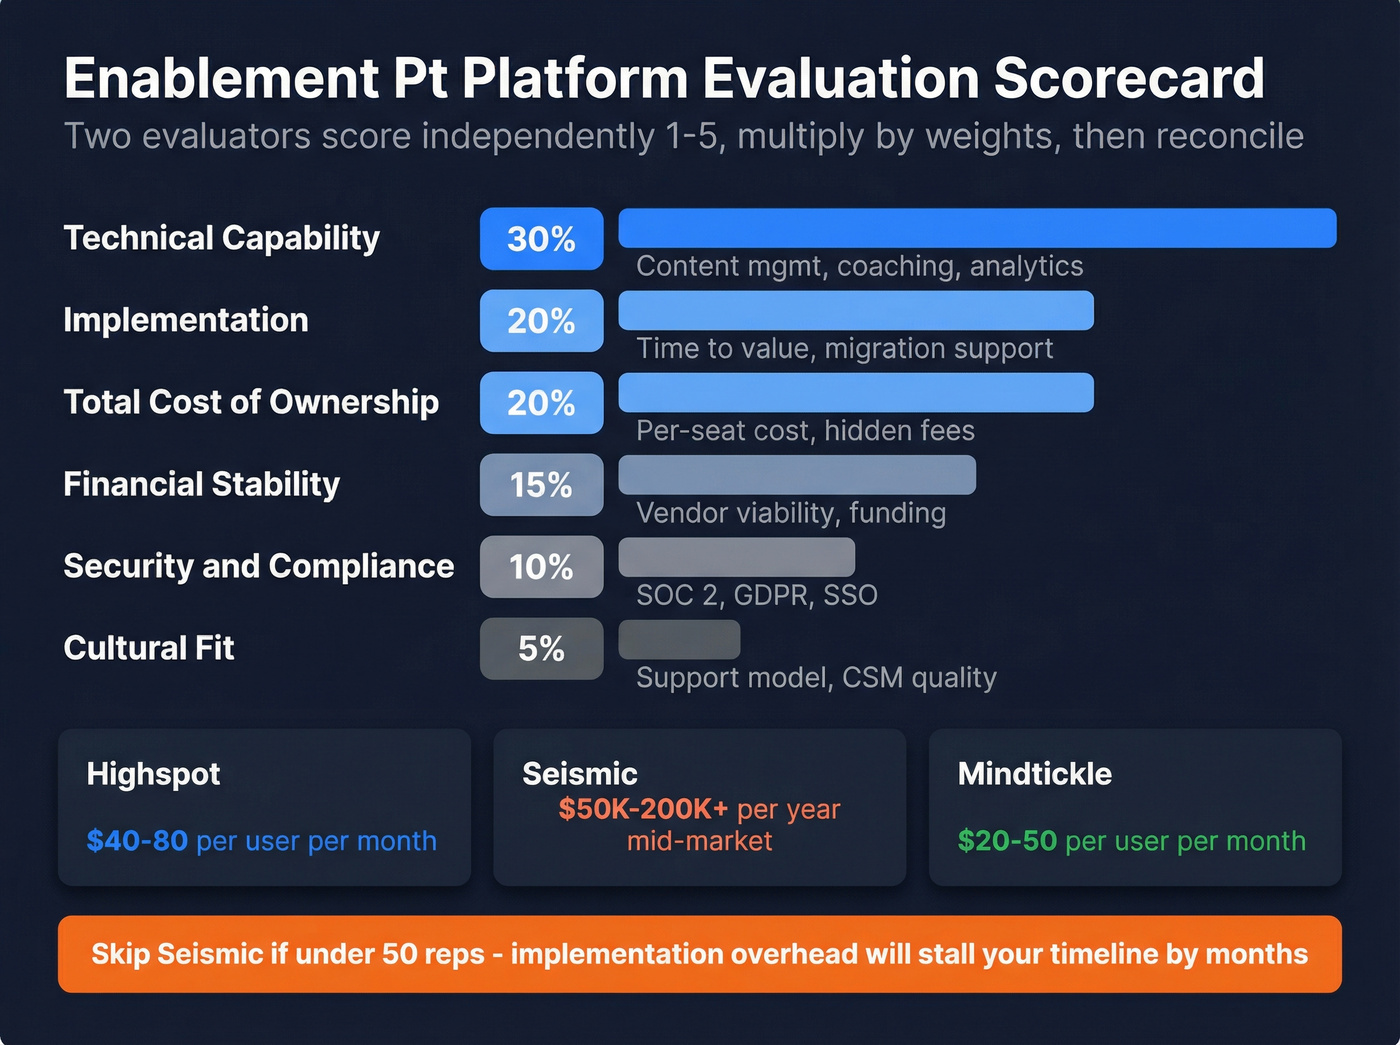
A weighted scorecard keeps platform selection honest. We've used this exact framework on multiple evaluations, and it prevents the loudest voice in the room from picking the tool with the best demo.
| Category | Weight | What to Score |
|---|---|---|
| Technical capability | 30% | Content mgmt, coaching, analytics |
| Implementation | 20% | Time to value, migration support |
| Total cost of ownership | 20% | Per-seat cost, hidden fees |
| Financial stability | 15% | Vendor viability, funding |
| Security & compliance | 10% | SOC 2, GDPR, SSO |
| Cultural fit | 5% | Support model, CSM quality |
Two evaluators score independently on a 1-5 scale, multiply by weights, then reconcile. Forrester's Q3 2024 Revenue Enablement Wave scored vendors across 32 criteria - your internal scorecard doesn't need that complexity, but it should cover five core use cases: content management, onboarding, coaching, product launches, and virtual selling.
For budgeting context: Highspot runs around $40-80/user/month, Seismic typically lands $50K-200K+/year for mid-market, and Mindtickle sits around $20-50/user/month. Skip Seismic if you're under 50 reps - the implementation overhead alone will stall your timeline by months.
If you're also auditing the rest of your outbound stack, compare your SDR tools and how you’re implementing a sales engagement platform before you lock in a long contract.
Ramp time is your highest-leverage enablement metric. Cut it faster by giving new reps verified emails and direct dials from day one - 300M+ profiles, 125M+ mobiles, 30% pickup rate. At $0.01/email, it costs less than one lost selling hour.
Shave weeks off ramp time with contacts that actually connect.
Common Evaluation Mistakes
Five failure modes we see repeatedly:
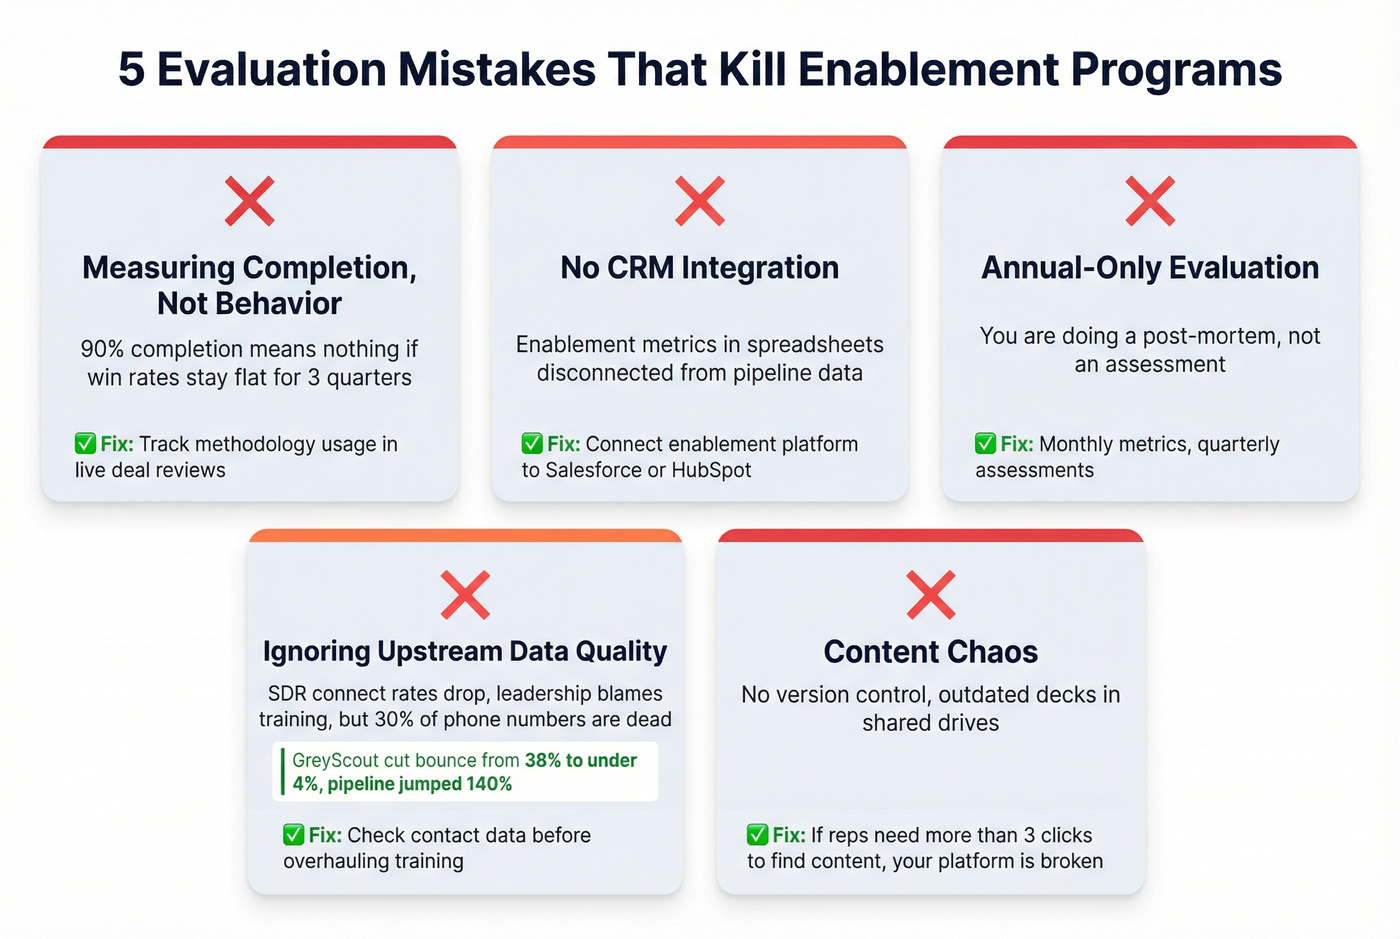
- Measuring completion, not behavior. A 90% training completion rate means nothing if reps aren't applying the methodology in live deals. We've seen teams celebrate completion dashboards while win rates stayed flat for three straight quarters.
- No CRM integration. If enablement metrics live in spreadsheets disconnected from Salesforce or HubSpot pipeline data, you can't measure results-level outcomes. Period. (If you need a baseline, start with examples of a CRM and the Salesforce pricing reality check.)
- Annual-only evaluation. You're doing a post-mortem, not an assessment. Monthly metrics, quarterly assessments.
- Ignoring upstream data quality. SDR connect rates drop, leadership blames training, but 30% of the phone numbers in the CRM are dead. Check your contact data before you overhaul your training program. GreyScout cut bounce rates from 38% to under 4% after fixing their data layer and saw pipeline jump 140% - a "training problem" that was really a data problem. (If you’re diagnosing this, start with email deliverability and data enrichment services.)
- Content chaos. No version control, outdated decks in shared drives. If reps can't find the right content in under 3 clicks, your enablement platform isn't enabling anything.
FAQ
How often should you run a sales enablement evaluation?
Run monthly metric reviews on leading indicators like ramp time, content engagement, and connect rates, then do quarterly program assessments against your maturity model. Annual evaluations catch problems months too late. Continuous measurement lets you course-correct before small gaps become budget-threatening failures.
What's the fastest way to calculate enablement ROI?
Pick one metric - ramp time or quota attainment - and calculate the revenue impact of a small improvement across your team. Multiply reps hired by months saved by monthly quota capacity. For a 48-rep team, shaving 2 months off ramp yields roughly $2.1M in additional revenue capacity.
What should an enablement evaluation include?
At minimum: a maturity assessment across training, content, coaching, technology, and measurement; a metrics framework tied to business outcomes rather than completion rates; and a technology fit score using a weighted scorecard. Layer in rep surveys and customer feedback for the full picture.
Can bad data skew enablement metrics?
Absolutely. Stale contact data is the most common hidden variable in enablement evaluation. If 30%+ of emails bounce or phone numbers are disconnected, connect rate metrics reflect data quality, not rep skill. Fixing data upstream - through verified contact providers with frequent refresh cycles - eliminates this noise so your metrics measure what they're supposed to.